Trending Resource: Tape Sudoku - A New Circular Sudoku Variant
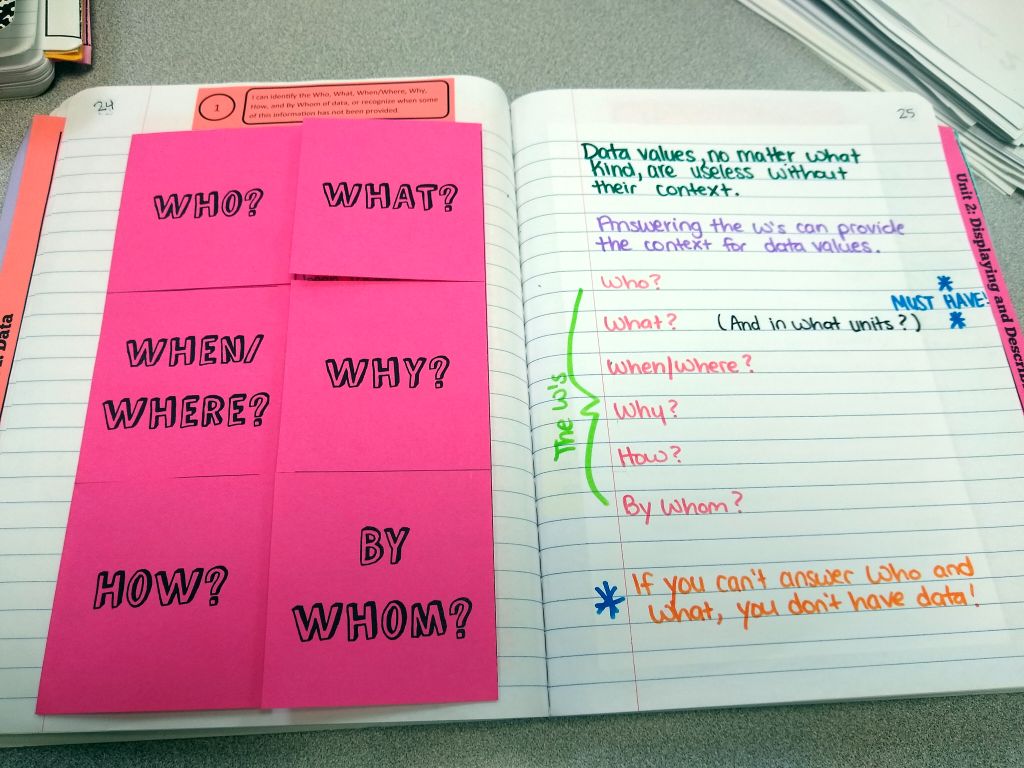
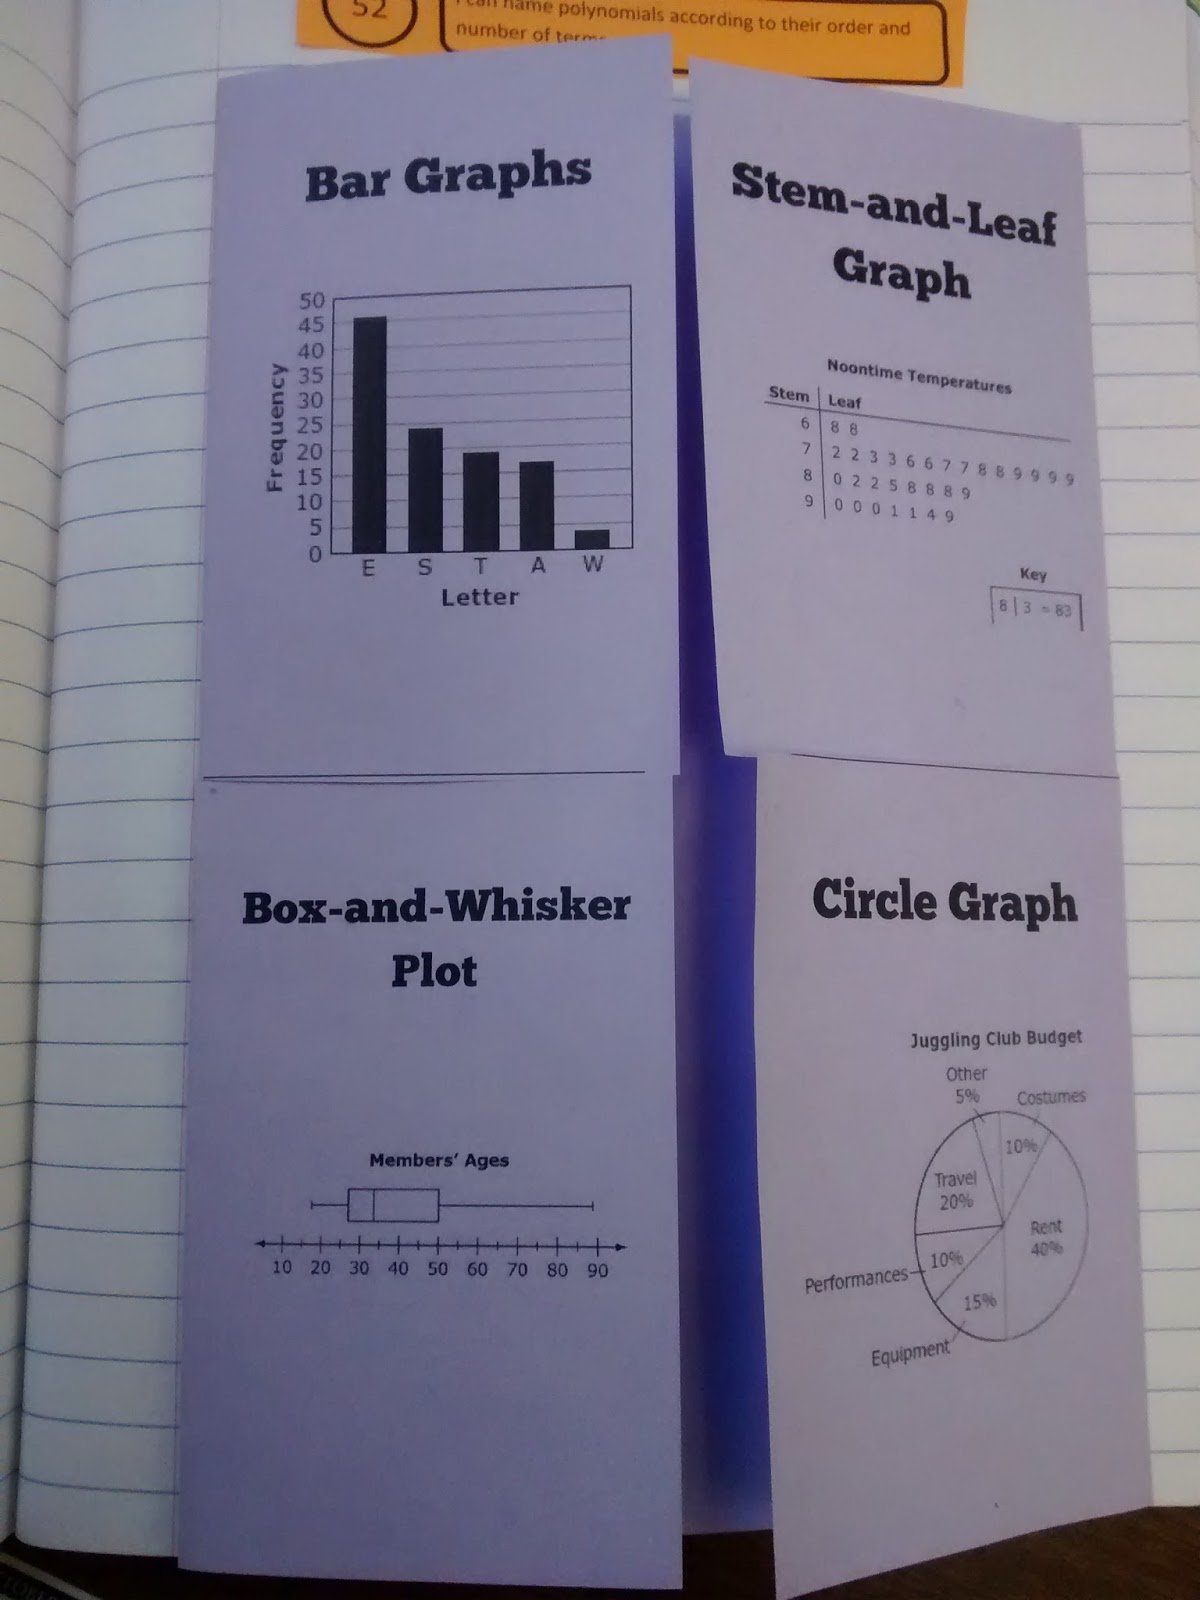
Home » INBs » Foldables » Math Foldables » Statistics Foldables