Estimating 30 Seconds Data Collection Activity
This blog post contains Amazon affiliate links. As an Amazon Associate, I earn a small commission from qualifying purchases.
I used this estimating 30 seconds data collection activity with my Algebra 1 students, and it turned out to be a ton of fun.
How well can you estimate 30 seconds? This is the question I posed to my Algebra 1 students a couple of weeks ago as part of our unit on data analysis.
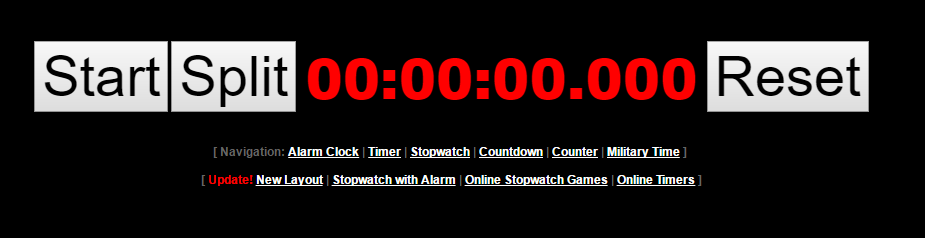
My original plan and the plan I carried out during first period was to project an online stopwatch on my SMARTBoard.
I had all of my students close their eyes. I told them the exact moment that I pressed “Start” on the timer. Their job was to open their eyes when they thought 30 seconds had passed and to record the amount of time that actually passed.
This would probably have worked just fine if my students hadn’t been so excited by this activity. One of my students first hour opened his eyes, saw that he was at exactly 30 seconds, and yelled out a shout of glee.
This, of course, caused my other students to open their eyes and also achieve near-perfect results. Not exactly what I was going for!
For my two afternoon classes, I pulled out my set of MyChron timers. I received three of these timers from attending an OERB workshop. I received an additional six timers from a local donor through the OK Education Needs Facebook group.
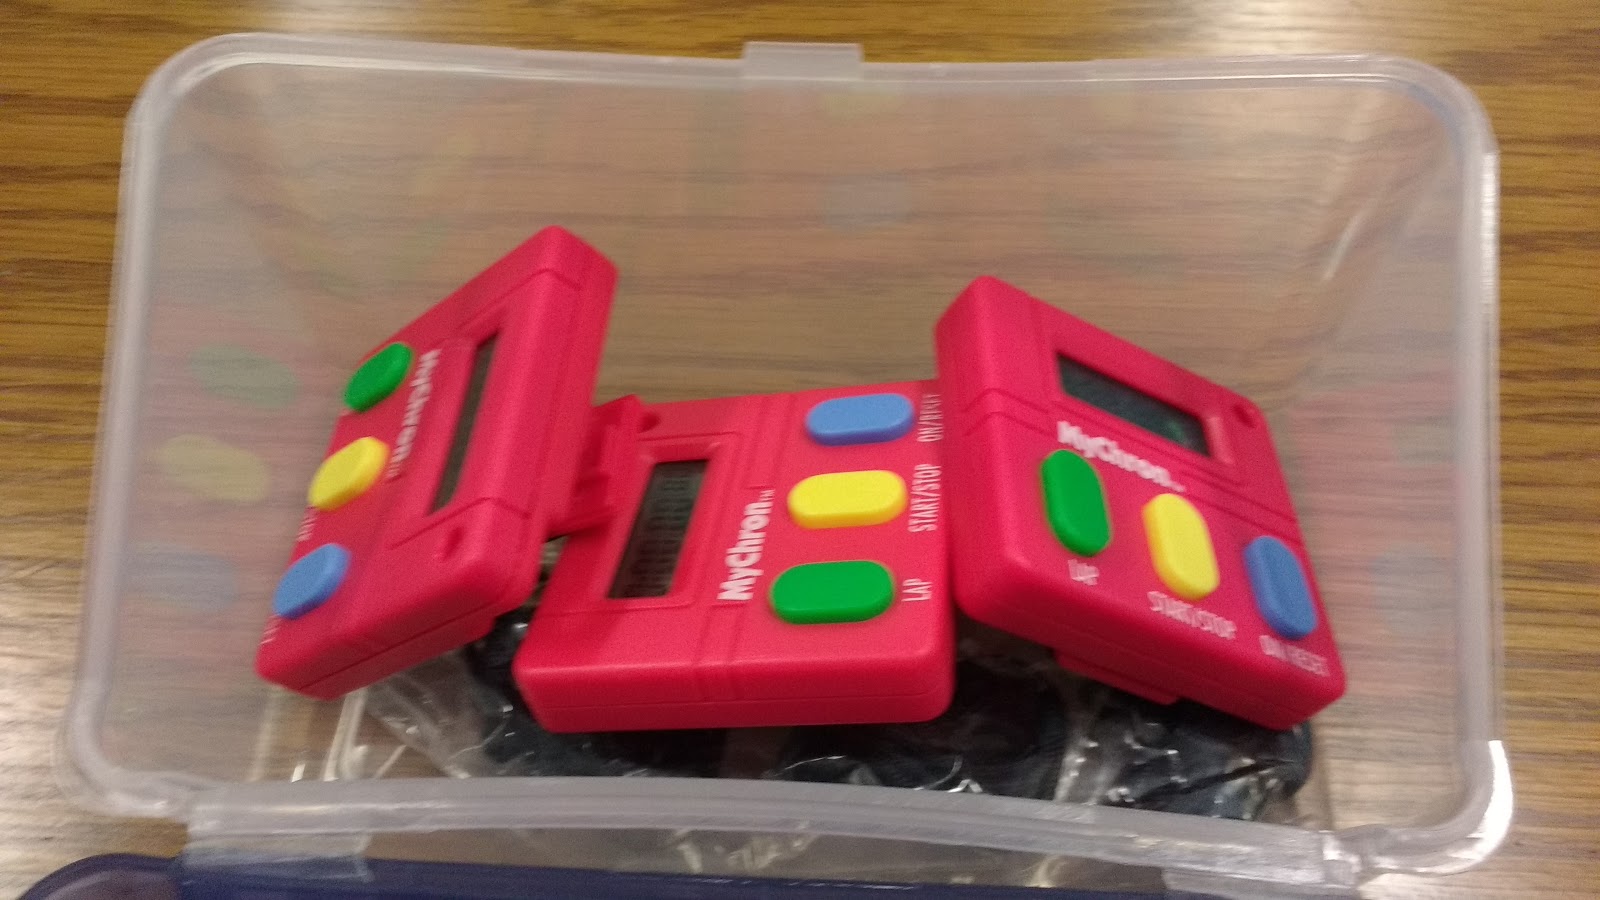
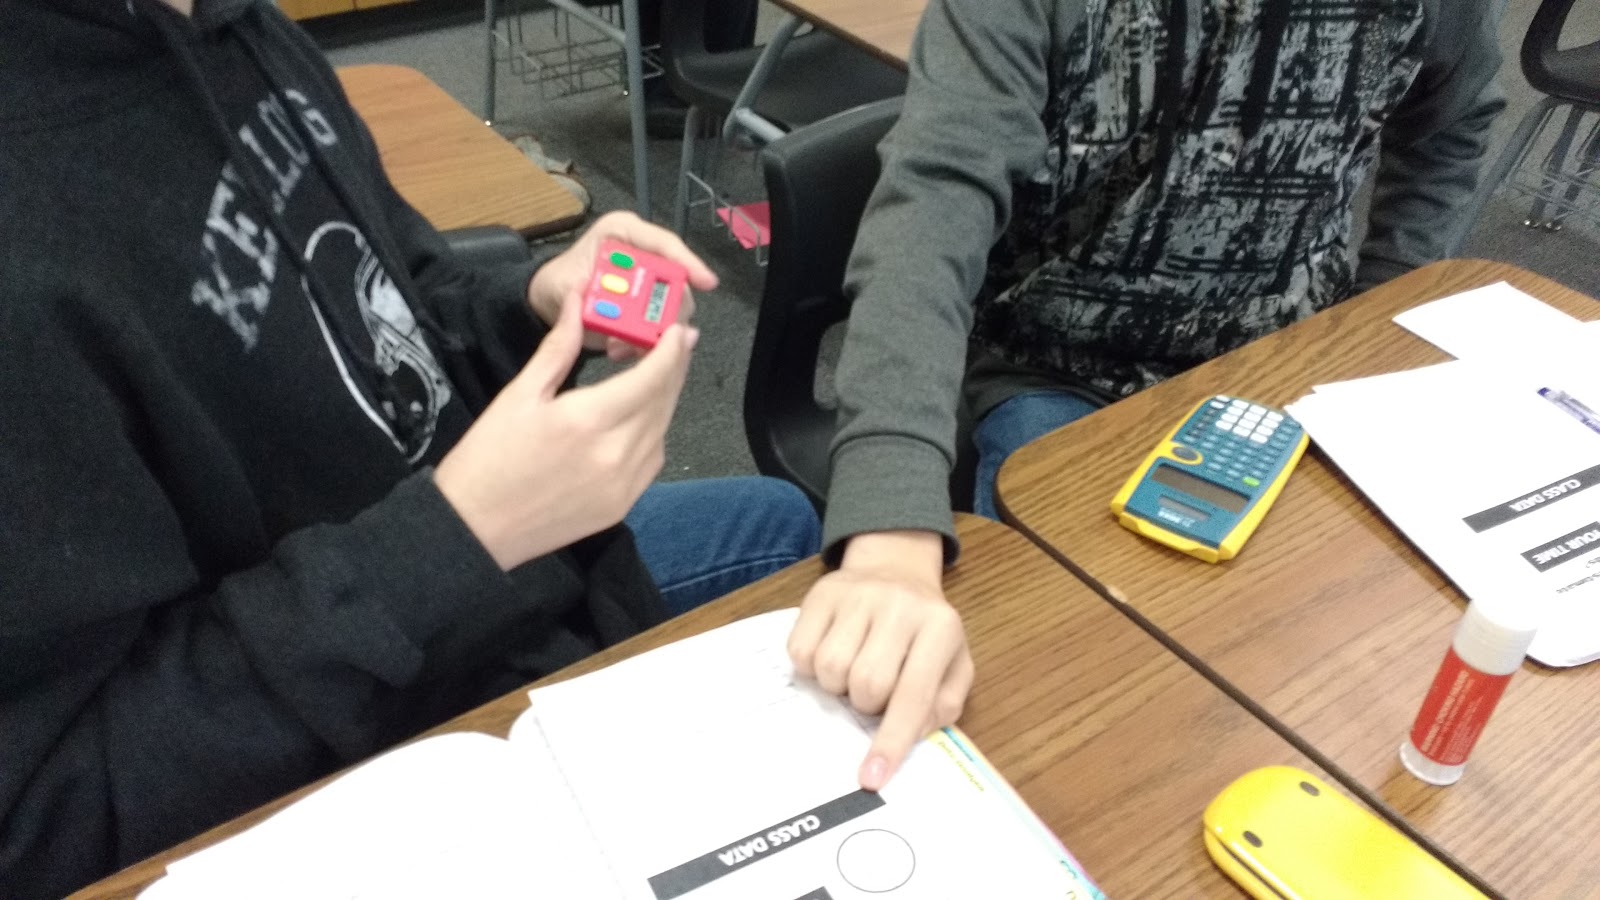
Students were instructed to take turns estimating 30 seconds in PAIRS. This took a bit more than twice as long as doing it as an entire class, but the data was so much more accurate!
One student would close their eyes and estimate 30 seconds while their partner timed how long their estimate really was. Then, they would switch.
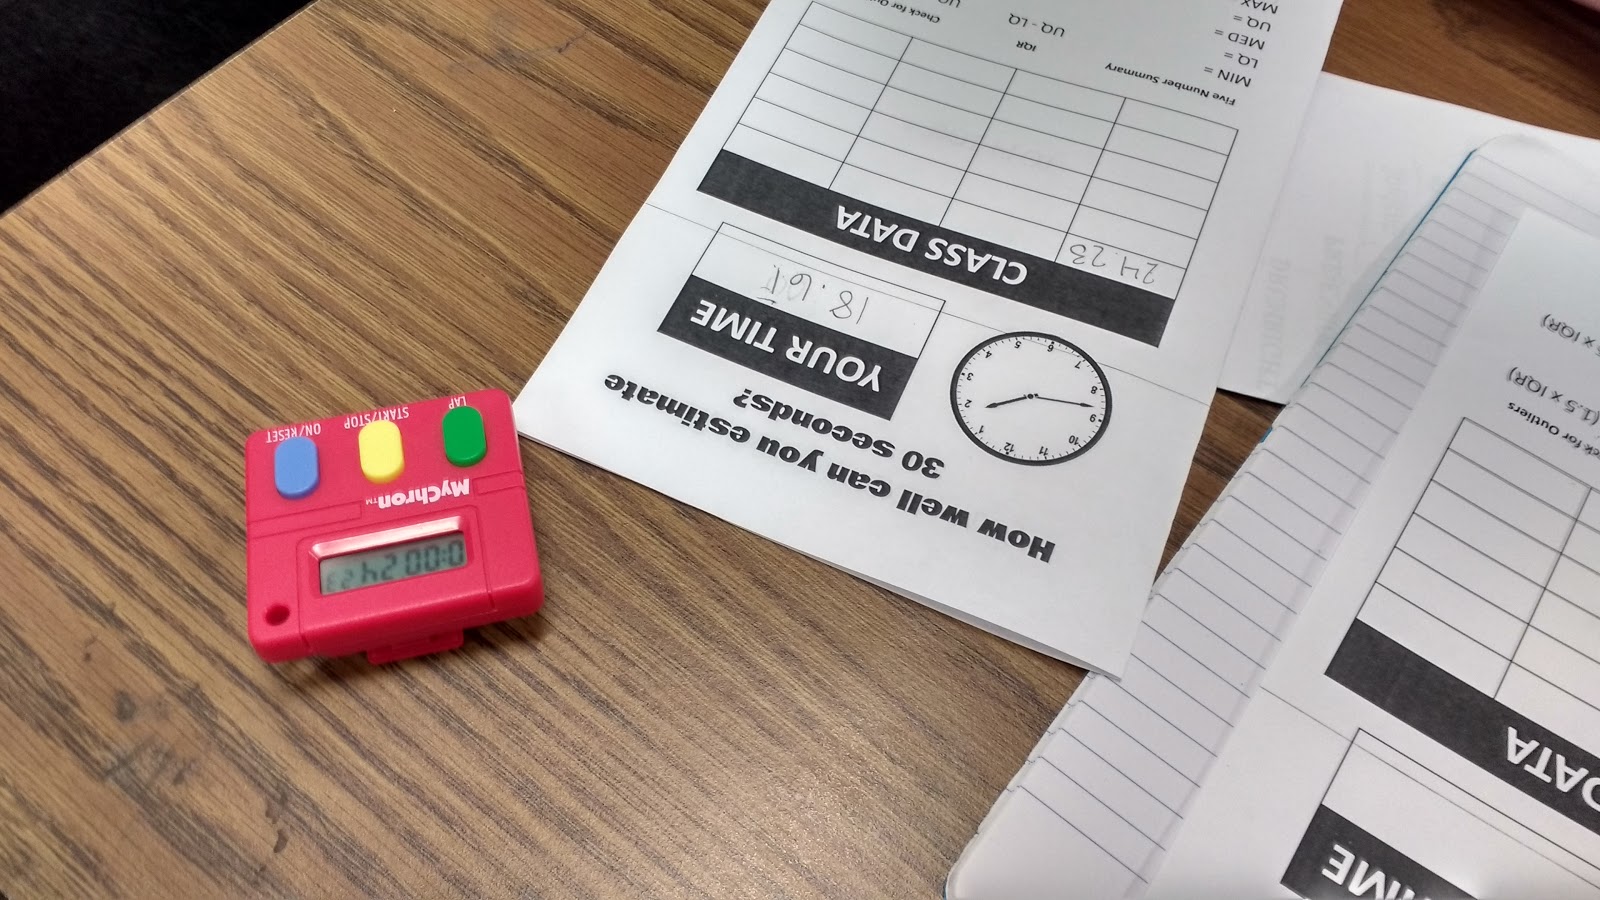
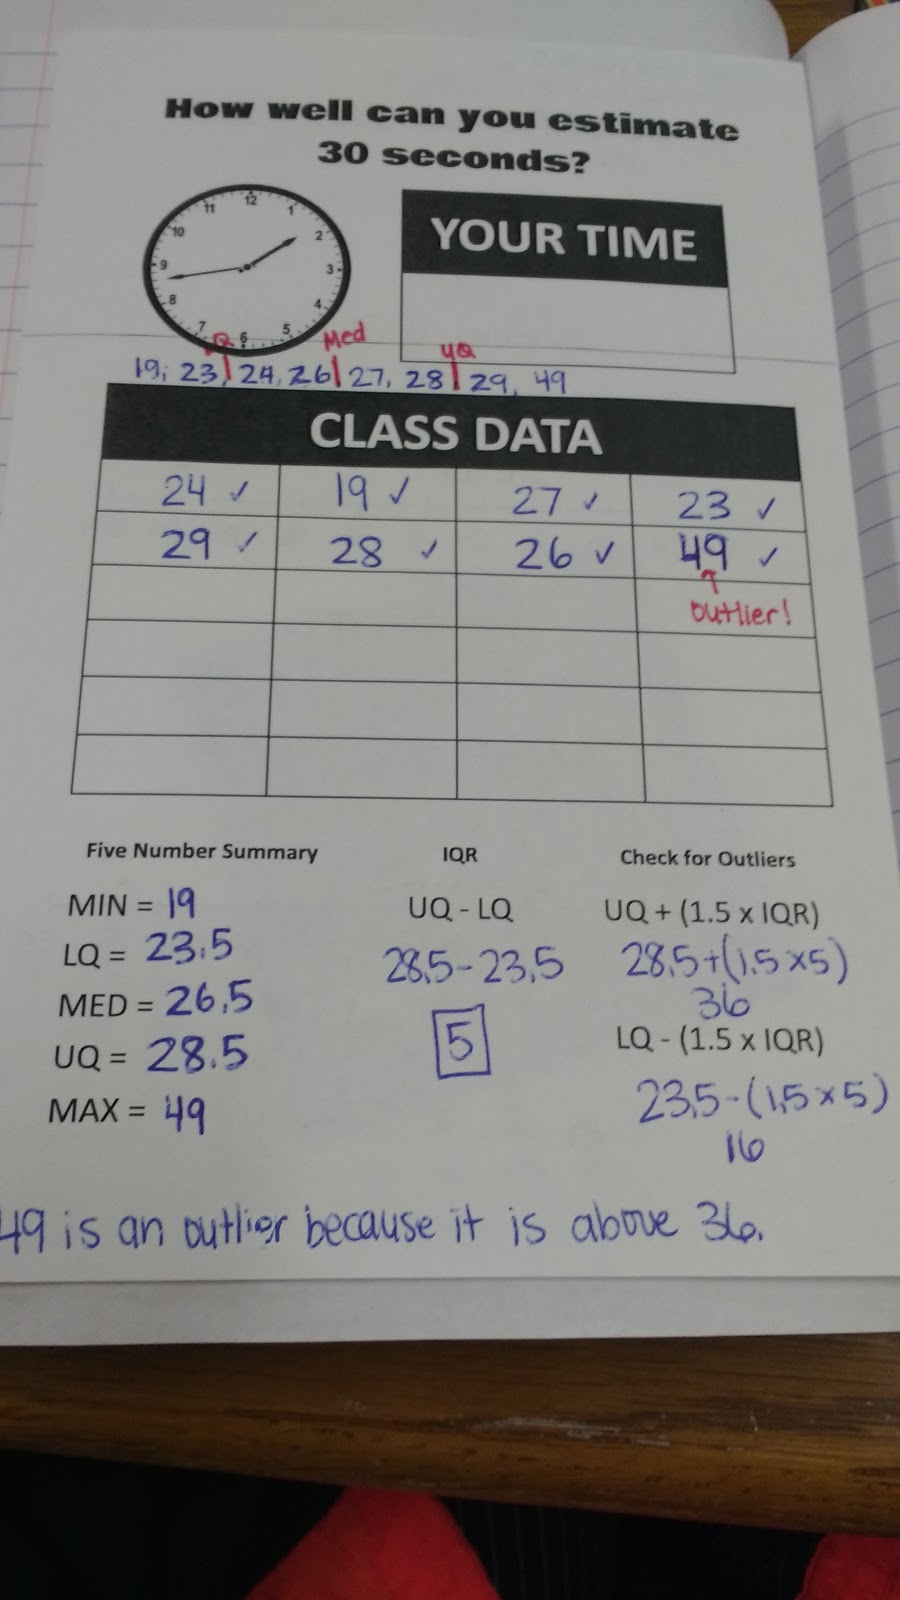
Here’s the data collection form I gave students to glue in their interactive notebooks:
Silly me gave students a box titled “Your Time.” In retrospect, this should have been titled “My Time!” Earlier in this unit, I didn’t give students a designated space to record their data value. This led to lots of confusion later on. Lesson learned!
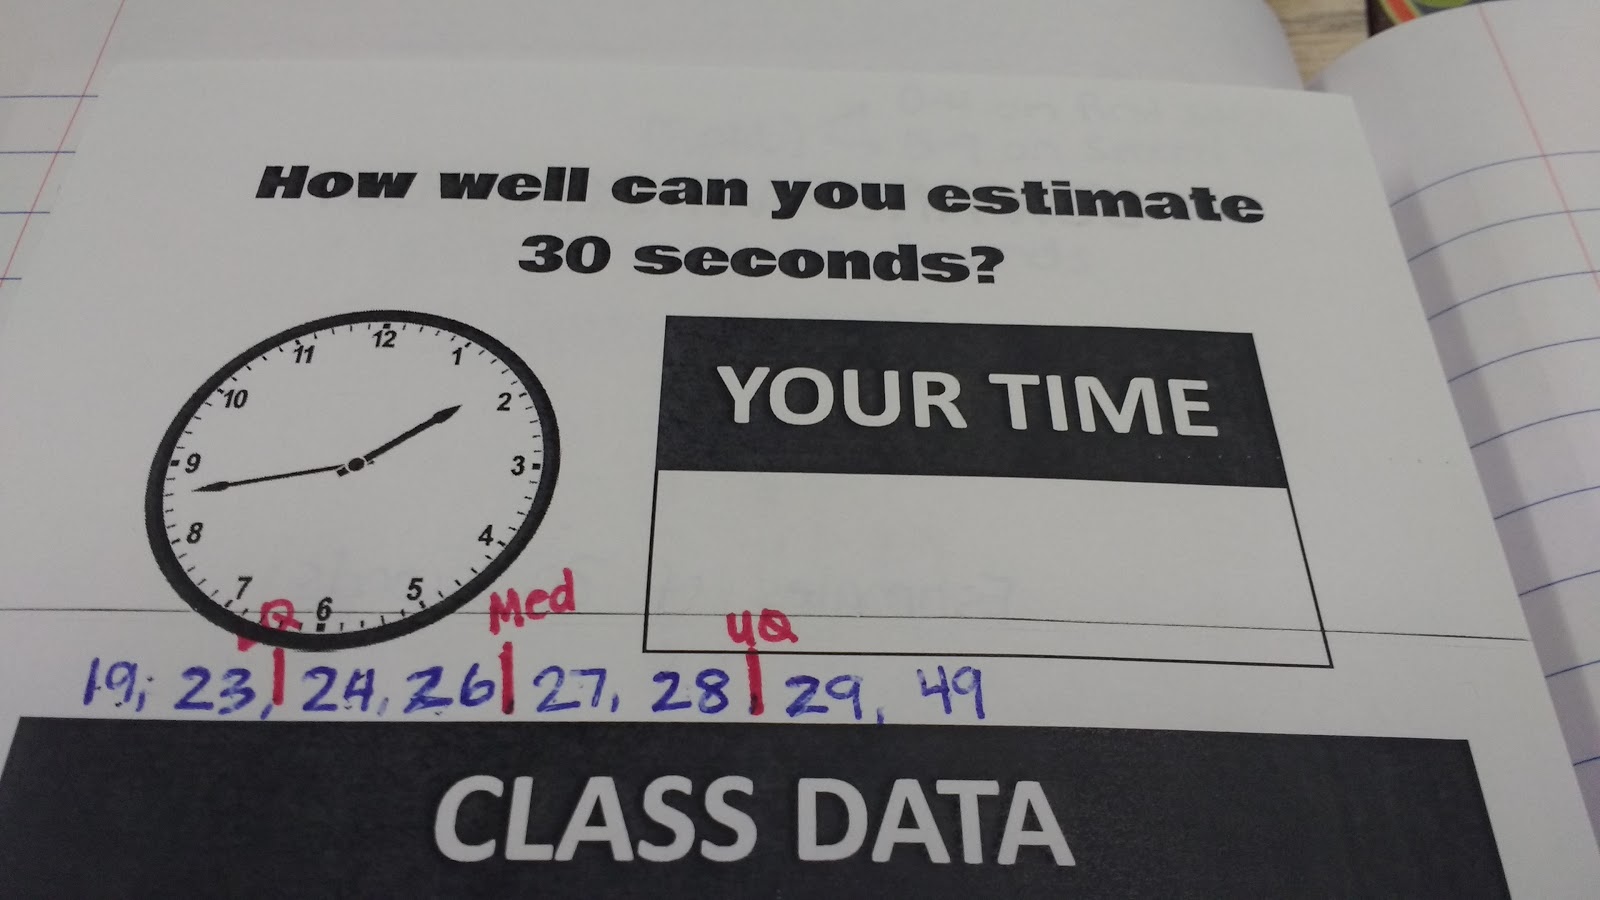
Another modification I need to make for next year is to give students a specified place to write the data in order. I had to squeeze this in, and it would look better if it had a box of its own.
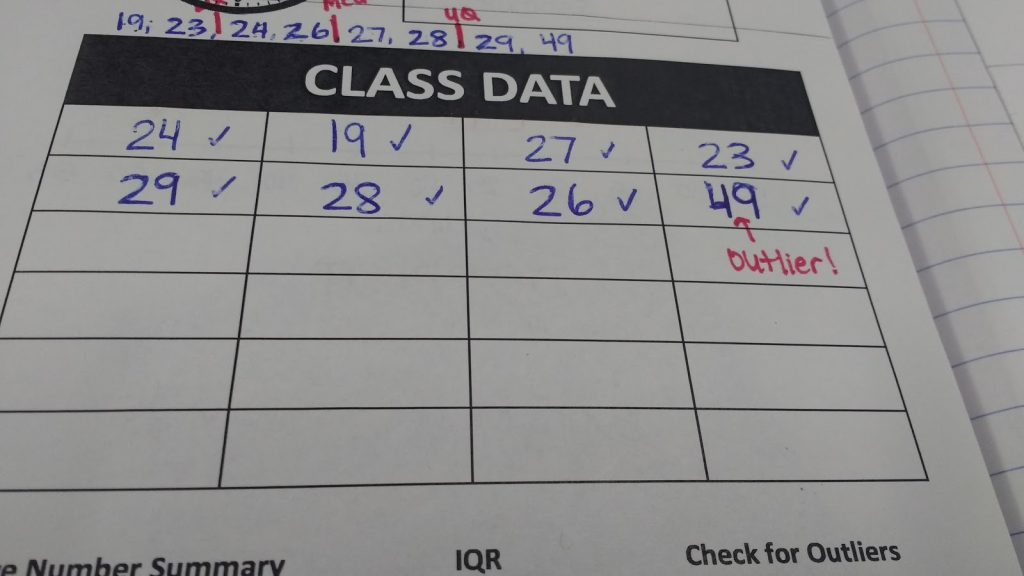
Students copied down the data from the other students in their class as I recorded it on the SMARTBoard. We ended up rounding our times to the nearest second to make calculations and pretty much everything easier!
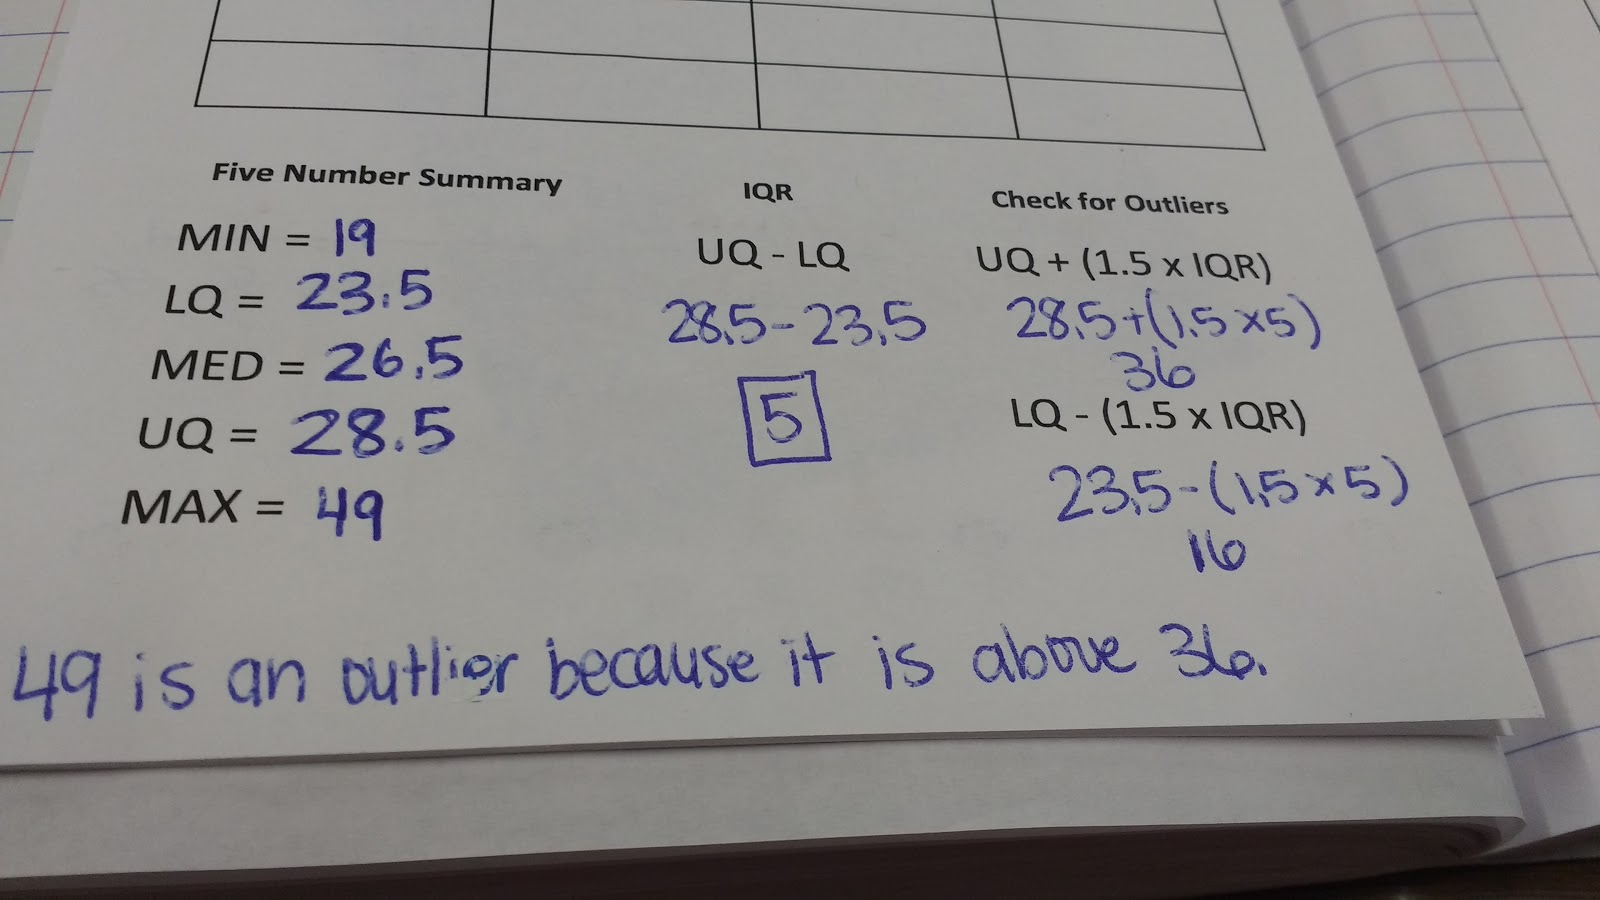
After putting our data in order (see above!), I had students find the five number summary, IQR, and check for outliers.
6th hour discovered that 49 was an outlier.
For next year, I would add a question to the bottom that asks if there are any outliers. When my students took this quiz, man
y of them struggled when I asked them to write a sentence explaining if there were any outliers. I need to make sure my students are writing down a sentence to justify the presence or absence of outliers each time we practice!
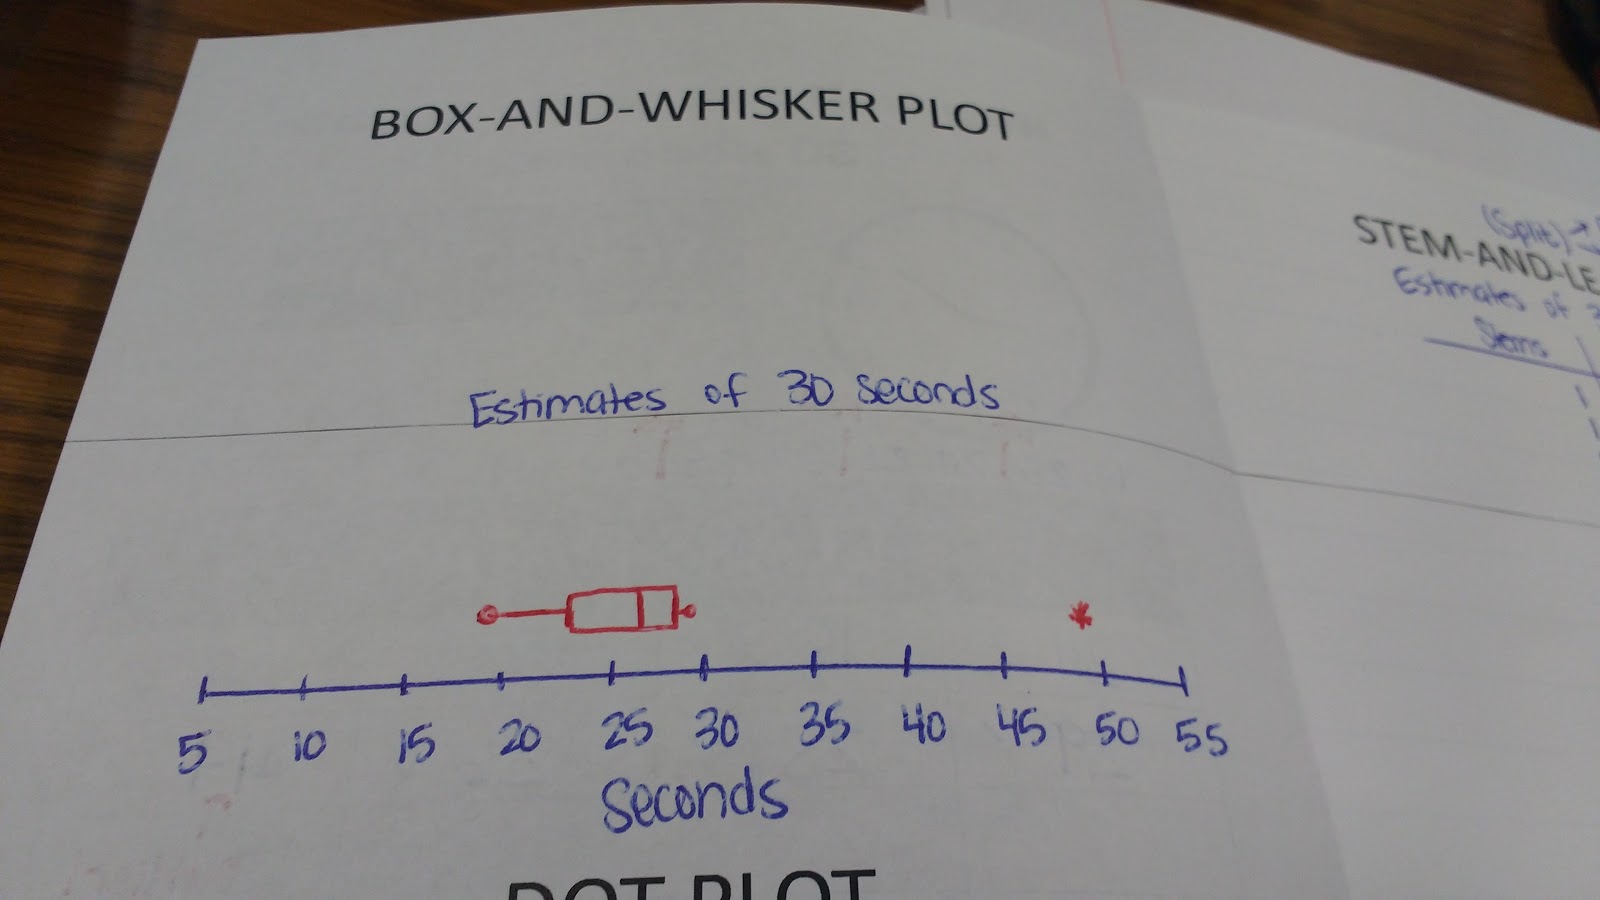
On the inside of our booklet foldable, students were given space to make a box-and-whisker plot, dot plot, stem-and-leaf plot, and histogram.
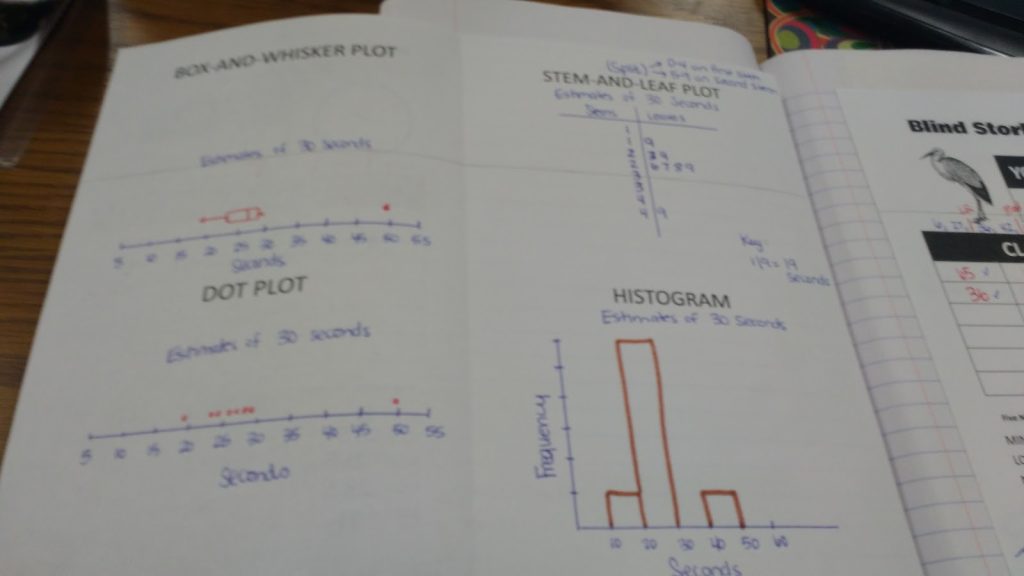
See that annoying line that the school’s copy machine put through my page? My students were actually really excited about it because many of them used it to form the number line for their box-and-whisker plot.
In the future, I will give students a pre-printed number line. Then, they will only have to decide how to number their number line to capture all of the data. This should save a bit of precious class time!
I would provide a pre-printed number line for the dot plot, too.
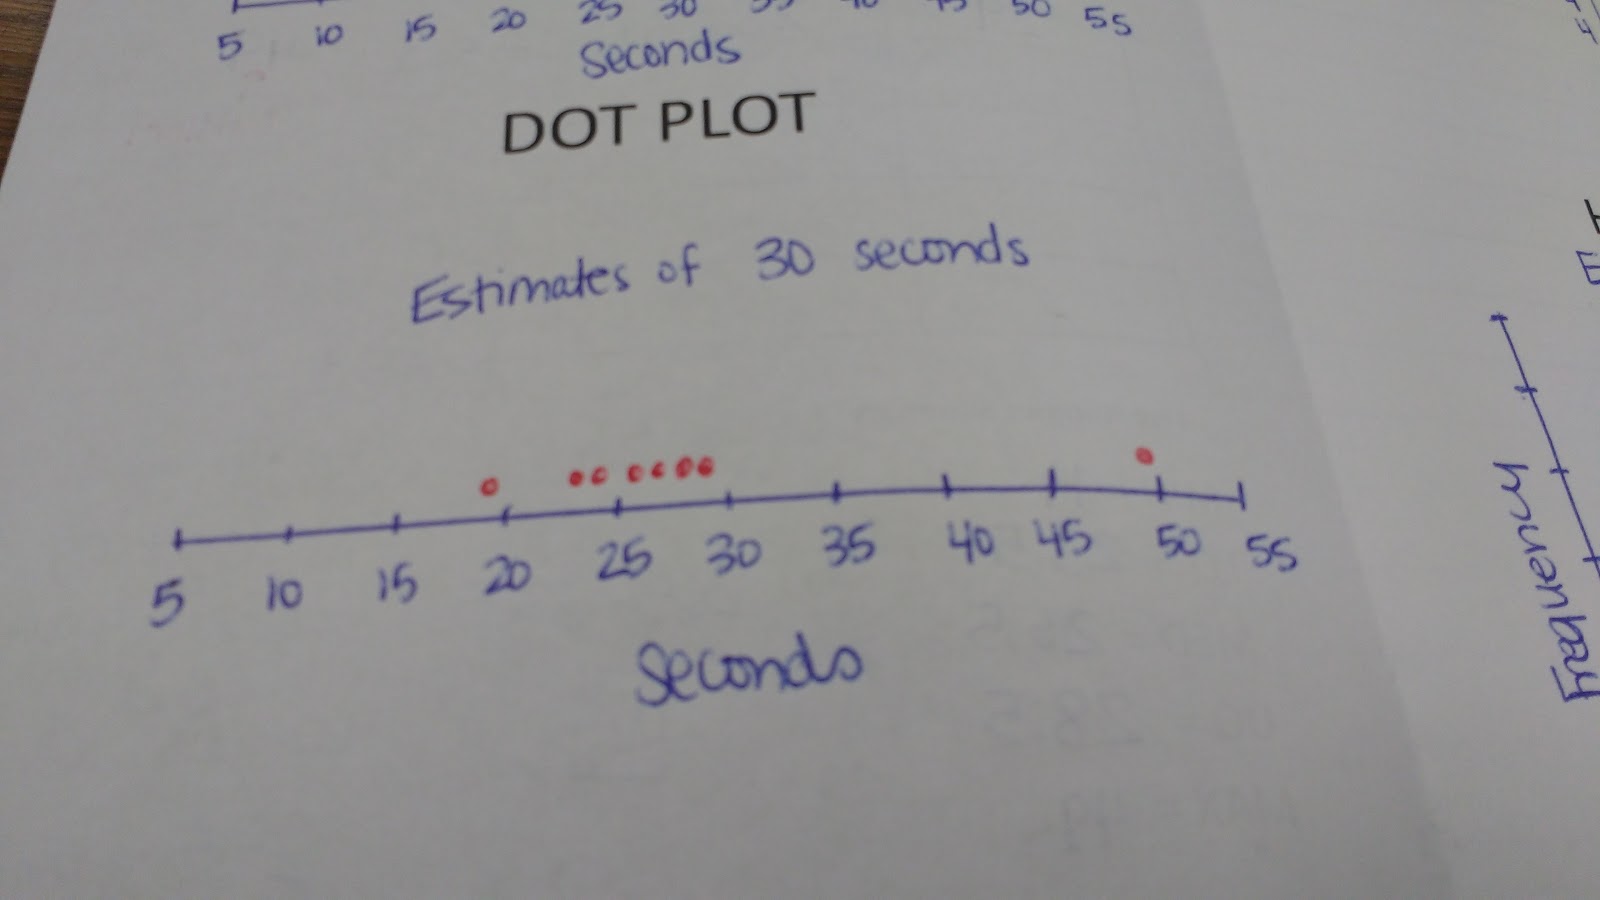
I think I might actually have them make the dot plot on top of the number line and make the box-and-whisker plot under the same number line. I did this with a Tenzi activity I have yet to blog about, and it worked pretty well!
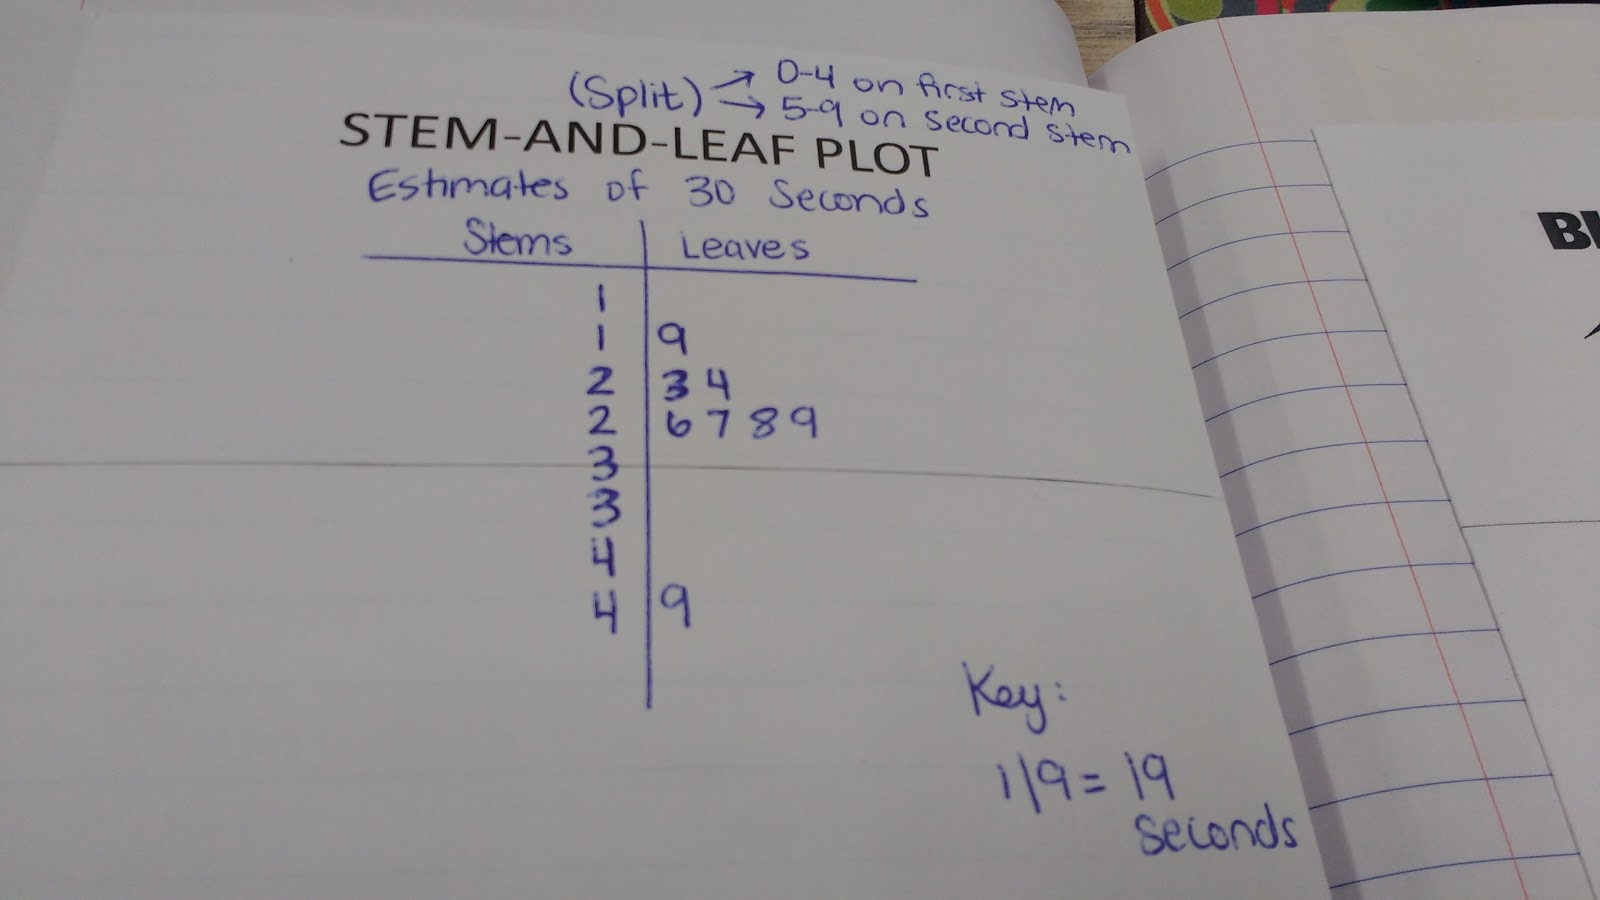
Since our data was so close together, my students and I chose to make a split stem-and-leaf plot. Originally, I thought my students would be really opposed to this modification of the stem-and-leaf plot, but they keep suggesting time after time that we split the stems.
Many of them even chose to split the stems on their quizzes!
Next year, I want to put some graph paper in the background to help students line up their digits. This will also ensure that all of the digits end up taking the same amount of space!
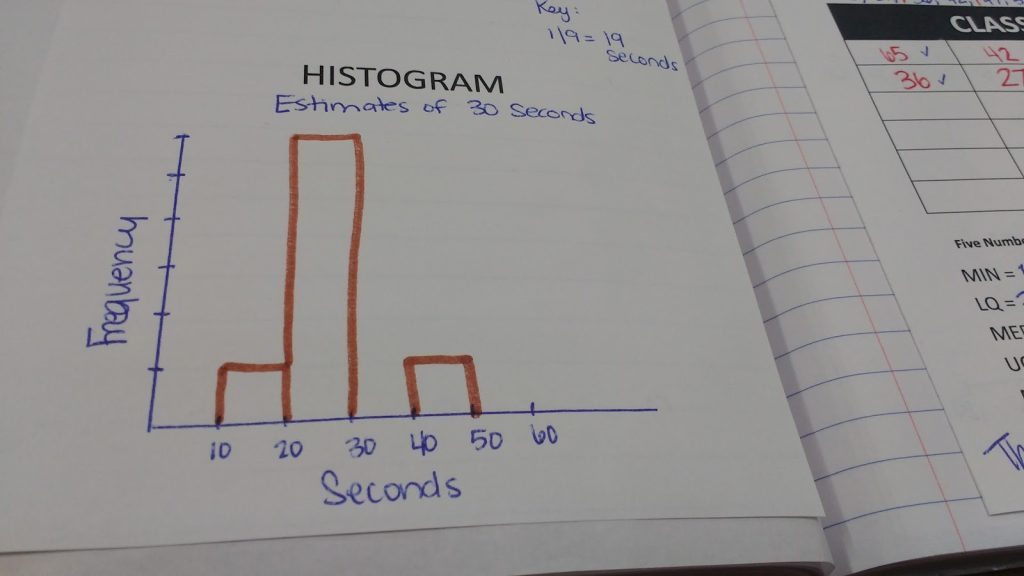
Finally, my students made a histogram from our data of estimating 30 seconds. In the future, I would also put graph paper in the background. This should help students make all of their equivalent towers equivalent heights.