Trending Resource: Tape Sudoku - A New Circular Sudoku Variant
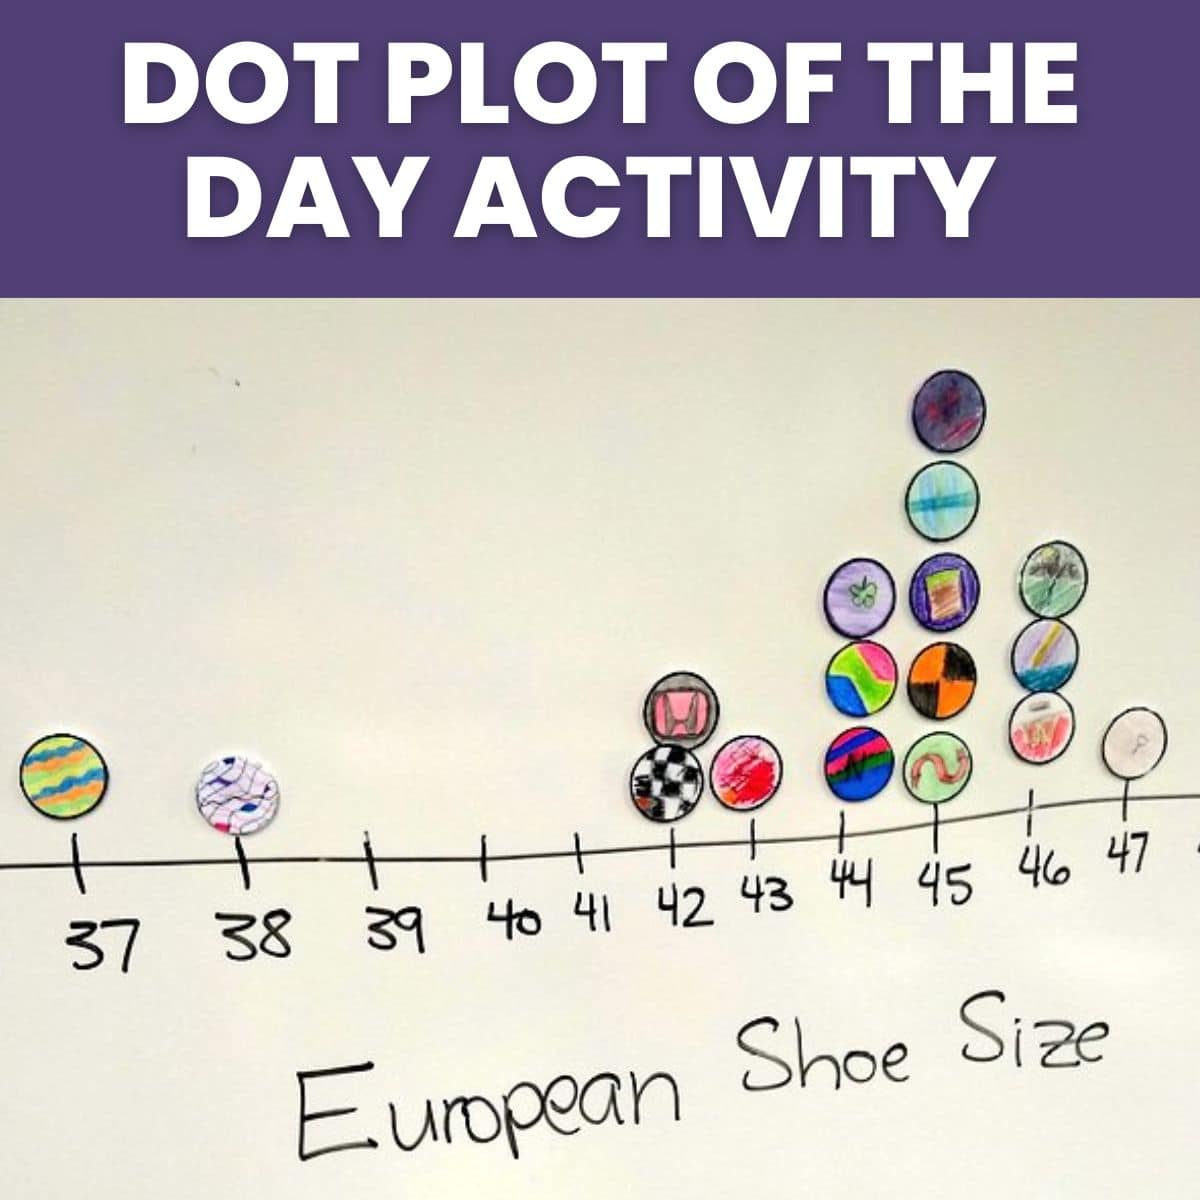
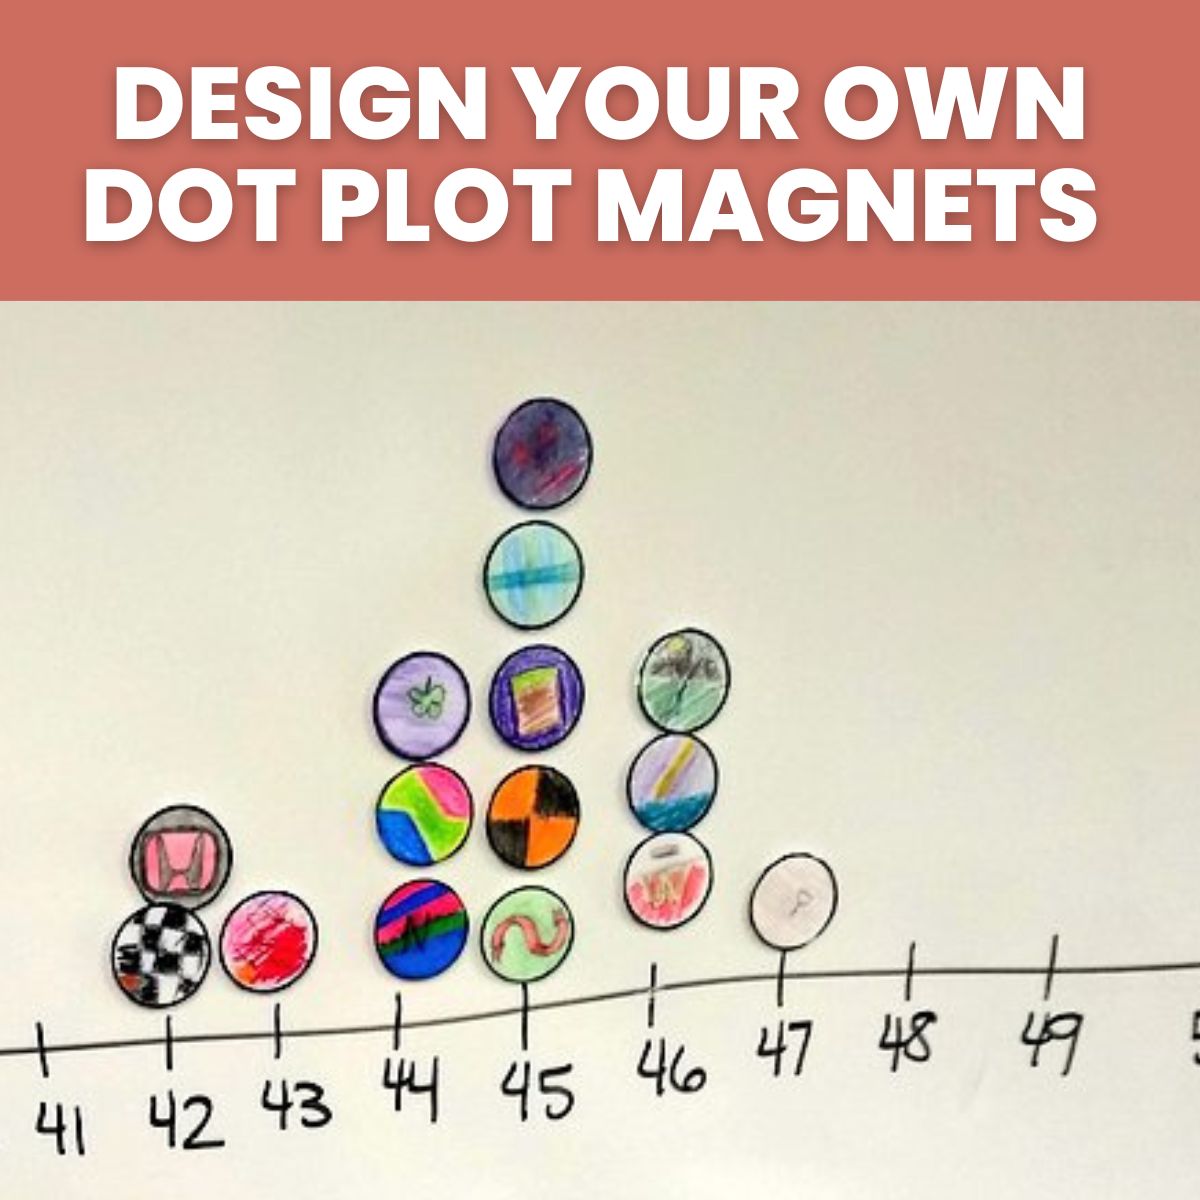
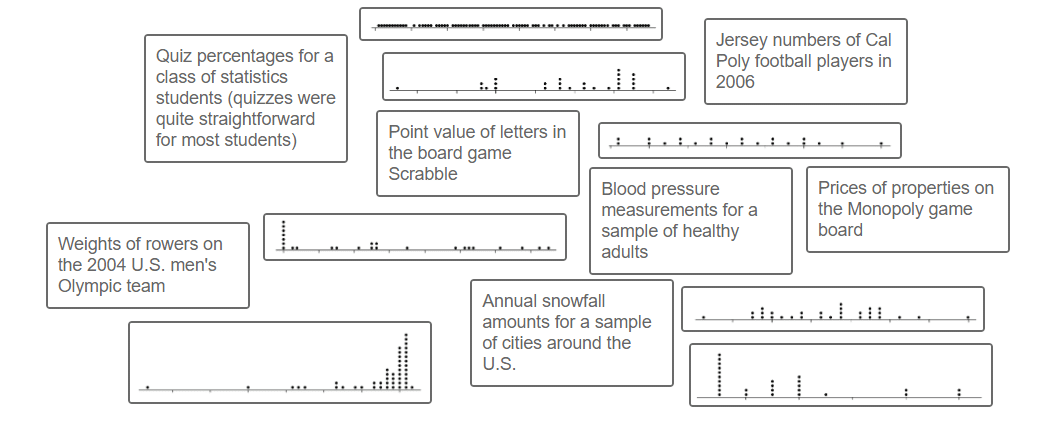
Home » Statistics » Quantitative Data » Quantitative Data Displays » Dot Plots