Dotplot Matching – A Desmos Card Sort Activity for Statistics
This blog post contains Amazon affiliate links. As an Amazon Associate, I earn a small commission from qualifying purchases.
I’m super excited today to share a dotplot matching activity I recently created for my statistics class. This summer when I realized I was actually going to get to teach statistics again after a multi-year hiatus, I got super excited and started doing lots of research.
One of the books that came across my path during my research was Workshop Statistics: Discovery with Data by Allan J. Rossman and Beth L. Chance.
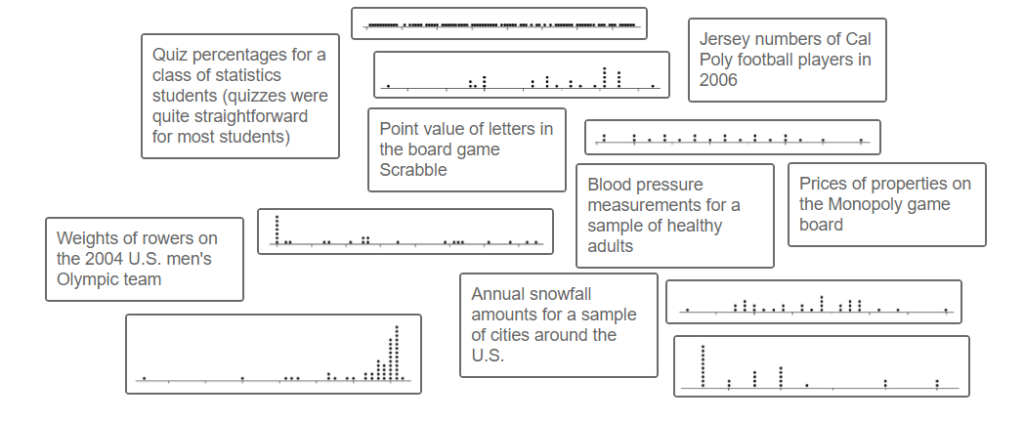
The book features many activities, but some of my favorite activities from the book are the matching games. For example, Activity 7-1 is a matching game where students are given seven variables and seven dotplots. The scales have been intentionally left off the axes of the dotplots. Students are tasked with matching each variable with its corresponding dotplot. I completed this dotplot matching activity myself, and I found it a really interesting activity in logical thinking.
Want to try the dotplot matching activity out yourself? You are in luck. Rossman has the activity posted on his university website. Even more exciting is the fact that Rossman has written a blog post on his Ask Good Questions blog about doing this activity with his students via Zoom with breakout rooms. I find it fascinating to read about distance learning from the perspective of a leader in the field of statistics education who is currently in the trenches of teaching virtually. In this blog post,
Rossman states that this dotplot matching activity is “adapted from Activity-Based Statistics, a wonderful collection based on an NSF-funded project led by Dick Scheaffer in the 1990s. This variation is also strongly influenced by Beth Chance’s earlier adaptations of this activity, which included generating the graphs from data collected from her students on various variables.”
When I was flipping through the Workshop Statistics book this past summer, I had visions of creating lots of laminated card sorts for my statistics classes to work through. As it became evident that this pandemic was most definitely not going to be over by the time school was back in session, I had to shift gears and try to figure out how to take the hands-on statistics class I wanted to teach and turn it into a class that could run largely virtually.
This led to my creation of my very first Desmos card sort! Well, I technically didn’t create the card sort, but I did Desmos-ify it. And, I want to share my Desmos version with you today in case you want to try the dotplot matching activity with your own students.
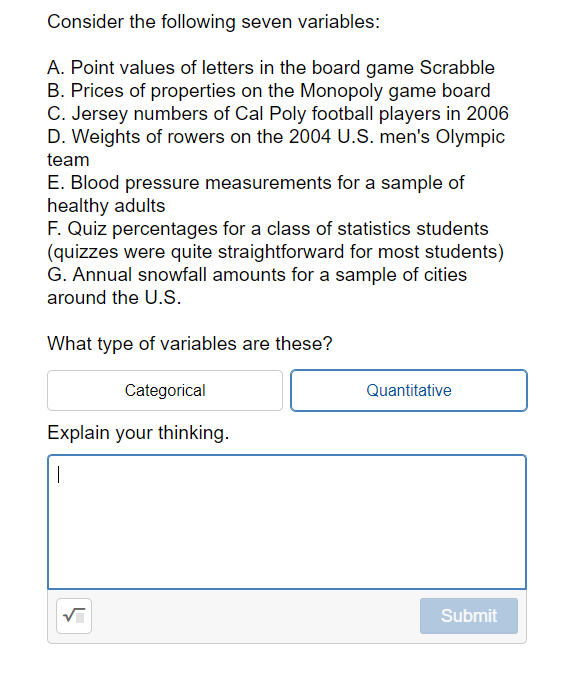
The first screen of my Desmos version had students read through the seven variables and determine if they are categorical or quantitative variables.
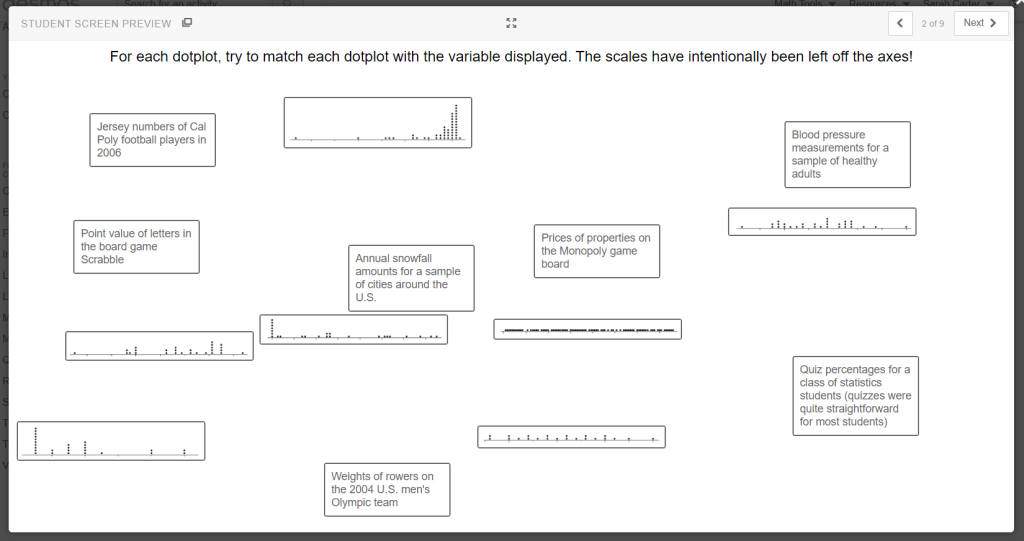
Then, students were presented with the classic dotplot matching activity using the Desmos card sort feature. Students had to drag and drop each variable to match it to its corresponding dotplot.
From my teacher dashboard, I could see how students were doing. My students found this dotplot matching activity to be quite tricky.
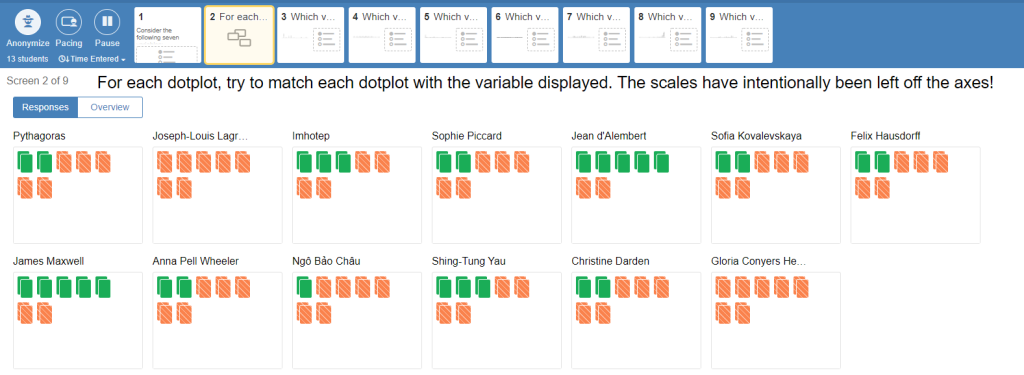
The green sets of cards represent correct matches. The orange sets of cards represent incorrect pairings. As you can see, none of my students matched all of the variables and dotplots correctly in this dotplot matching activity.
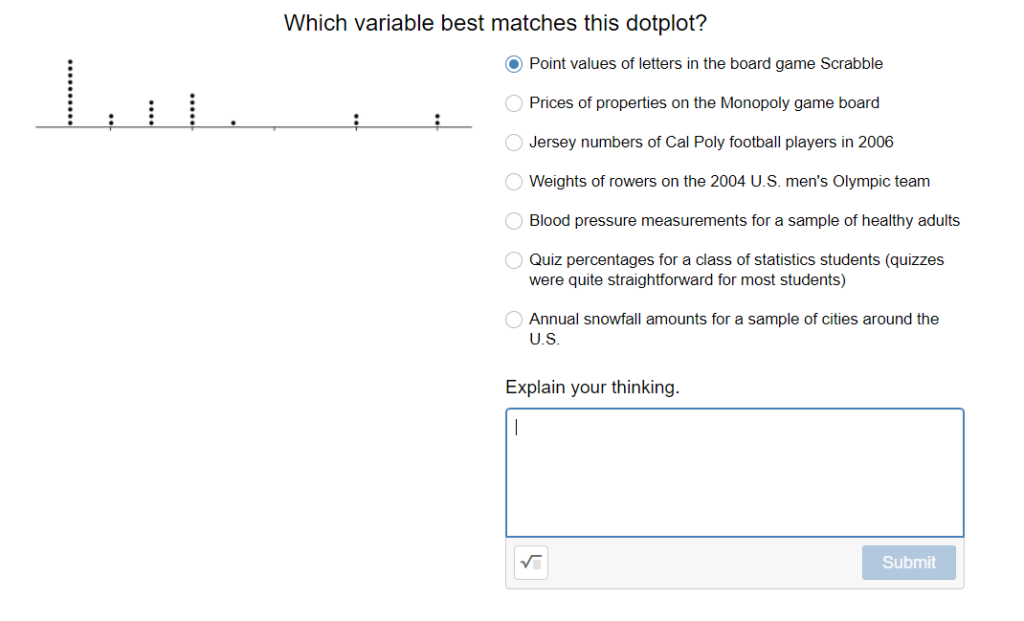
To help get students thinking critically and not just randomly matching variables and graphs, I added individual screens for each dotplot where students had to select the variable and explain their reasoning.
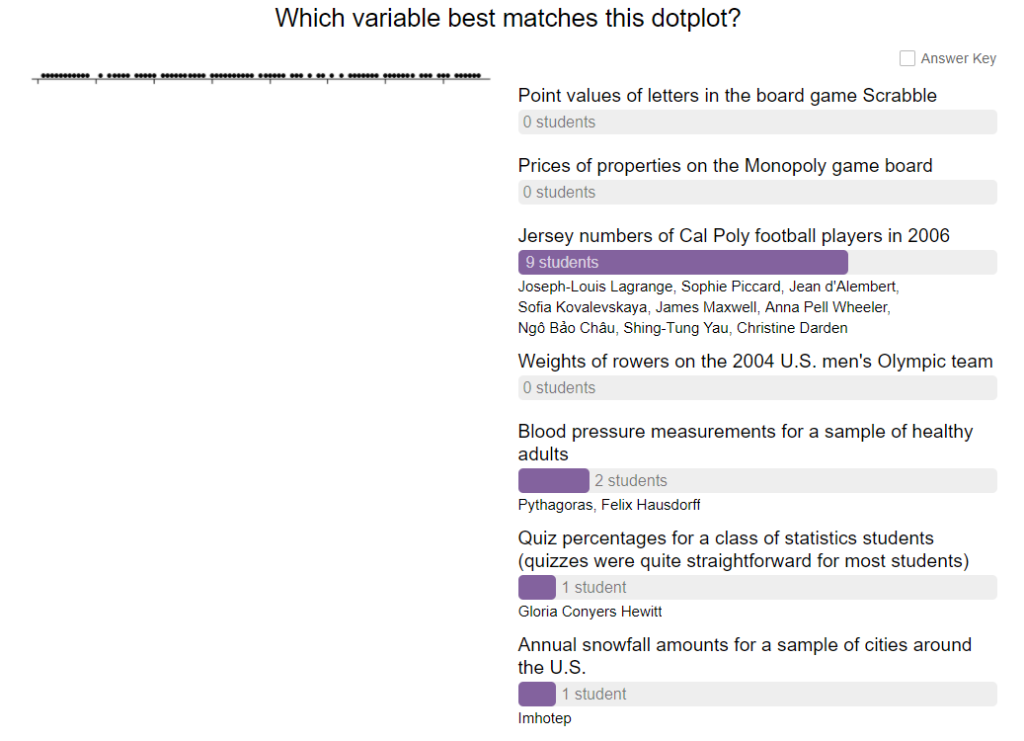
The teacher dashboard lets me see how students did on each particular dotplot.
I’m happy with how this turned out, but I also see lots of room for improvement. Here’s what I’m thinking for future implementations.
After determining if the variables were categorical or quantitative, I jumped straight into the cardsort. I did it this way because it was the way the original activity was designed. Students match the cards and write an explanation for each match. I think this digital platform would allow me to move the cardsort to the absolute end of the activity, hopefully resulting in a better percentage of correct matches.
So, here’s what I’m thinking. (And, I really didn’t have any of this planned. Originally, I was just going to write this blog post and share the activity. But, this is why I love blogging so much. There’s something about the act of blogging about an activity that I have done with my students that really forces me to be reflective. The teacher I am today is a direct result of the blogging that I have done over the past ten years.)
Version 2.0 of this dotplot matching activity would still start with a screen asking about categorical vs quantitative. Screen 2, however, would give one dotplot and two variable choices. Students would be asked to choose which variable they think best matches the dotplot. I think that restricting the choices at the beginning will lead to better student thinking. Should these be the same dotplots/variables as the full cardsort at the end? I’m not so sure about that…
Another screen might give students a dotplot and all seven variable choices. The task for this screen would not be to select the correct variable but to determine one variable that it could NOT be and to justify that choice.
I might follow this up with another doplot and all seven variable choices. This time, two students have chosen their variable. My student would have to choose which student they agreed with and explain their reasoning.
I guess what I’m saying is I want to sort of flip the script on the lesson and move the justifying to the front of the lesson and the very cool matching activity to the end.
I apologize that I can’t say that I have a perfect card sort activity to share with you. But I hope you can take what I created, learn from my experiences, and turn it into an even better dotplot matching experience for your students.
Free Digital Version of Dotplot Matching Activity
Without further ado, here’s Version 1.0 of the Dotplot Matching Activity on Desmos. I look forward to seeing what you do with it! This post wouldn’t be complete without a very special thank you to Rossman and Chance for sharing amazing resources online and in print that make my job as a statistics teacher so much more engaging.
Hi Sarah. I have been teaching AP Stat for many years. Your reflections and ideas for changing the activity are spot on! Thanks for everything you share.