Blind Stork Test for Data Collection
This blog post contains Amazon affiliate links. As an Amazon Associate, I earn a small commission from qualifying purchases.
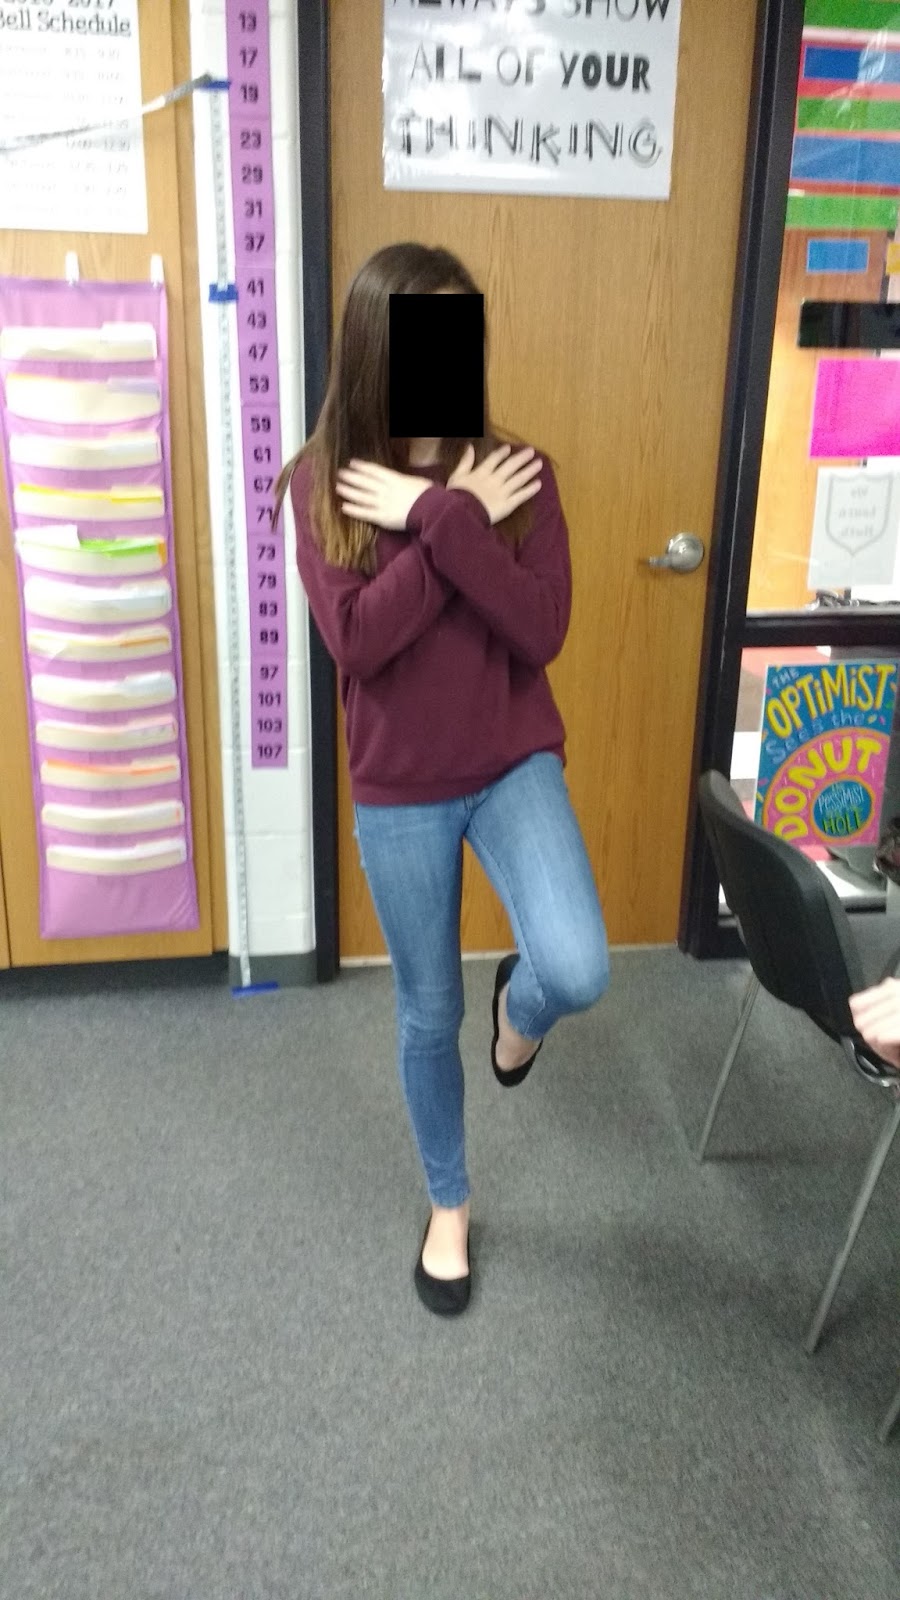
While looking through Don Steward’s blog for data collection ideas, I ran across the idea of a “blind stork test.” The idea is simple. Close your eyes and see how long you can stand on one leg. Don Steward claims that most people can’t last more than one minute.
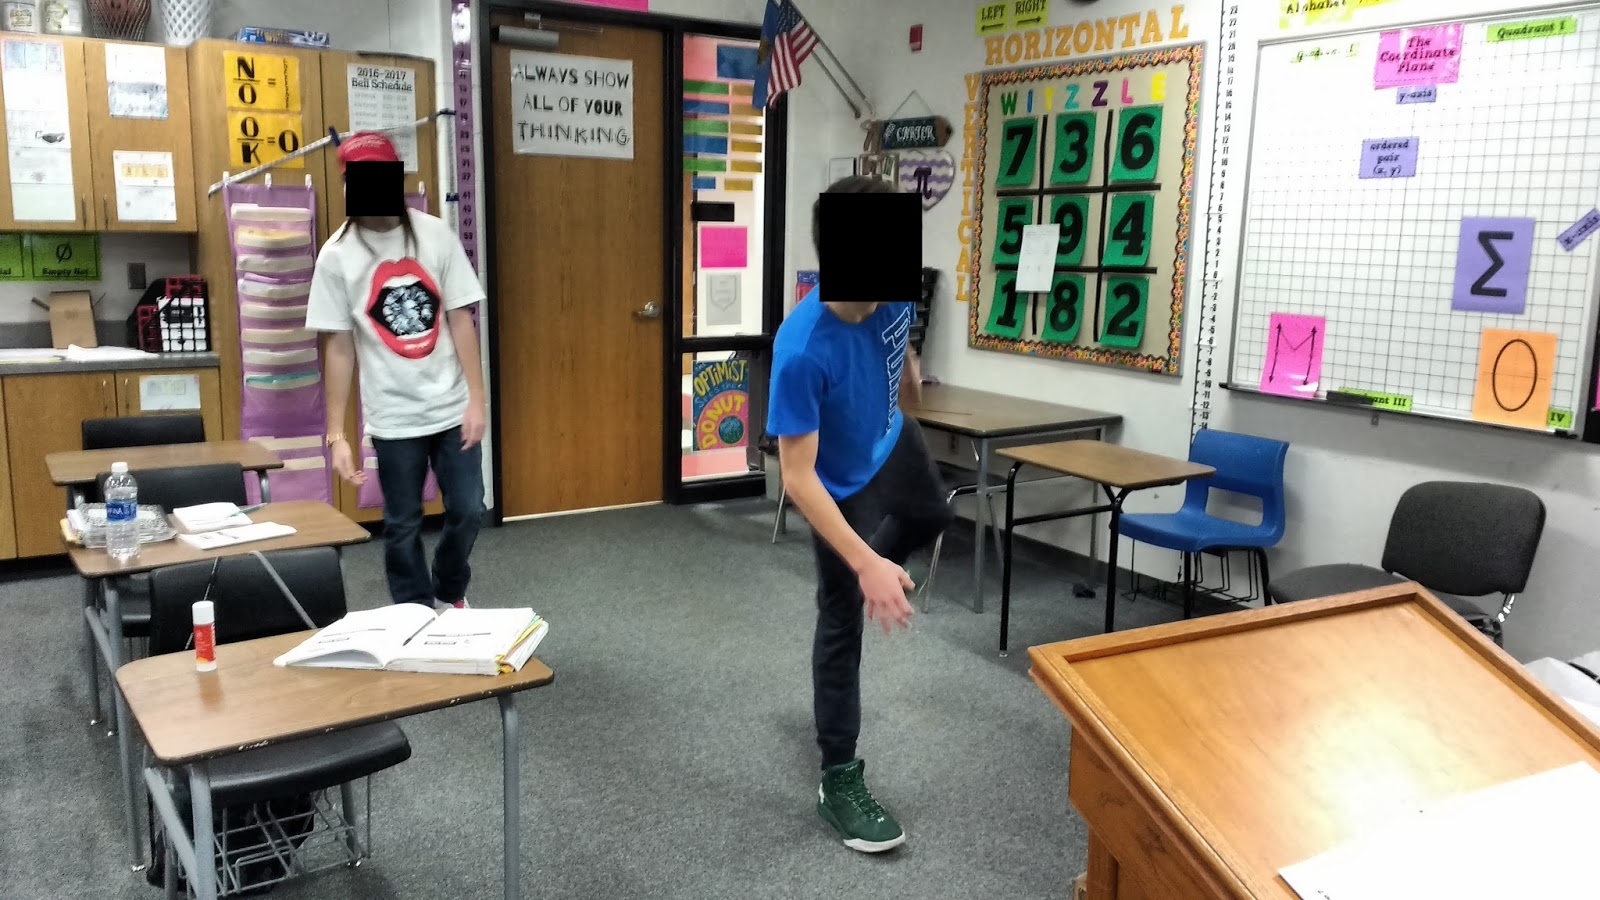
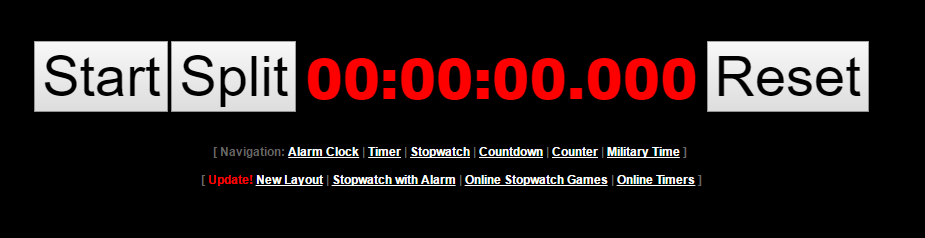
As with my Estimating 30 Seconds Activity, I originally planned to use an online stopwatch on the SMARTBoard for this activity. When I tried this first hour, I had two buys who simply wouldn’t give up. They both stood on one foot with their eyes closed for over five minutes. Five minutes. We couldn’t write down our data or move on until both of them gave up!
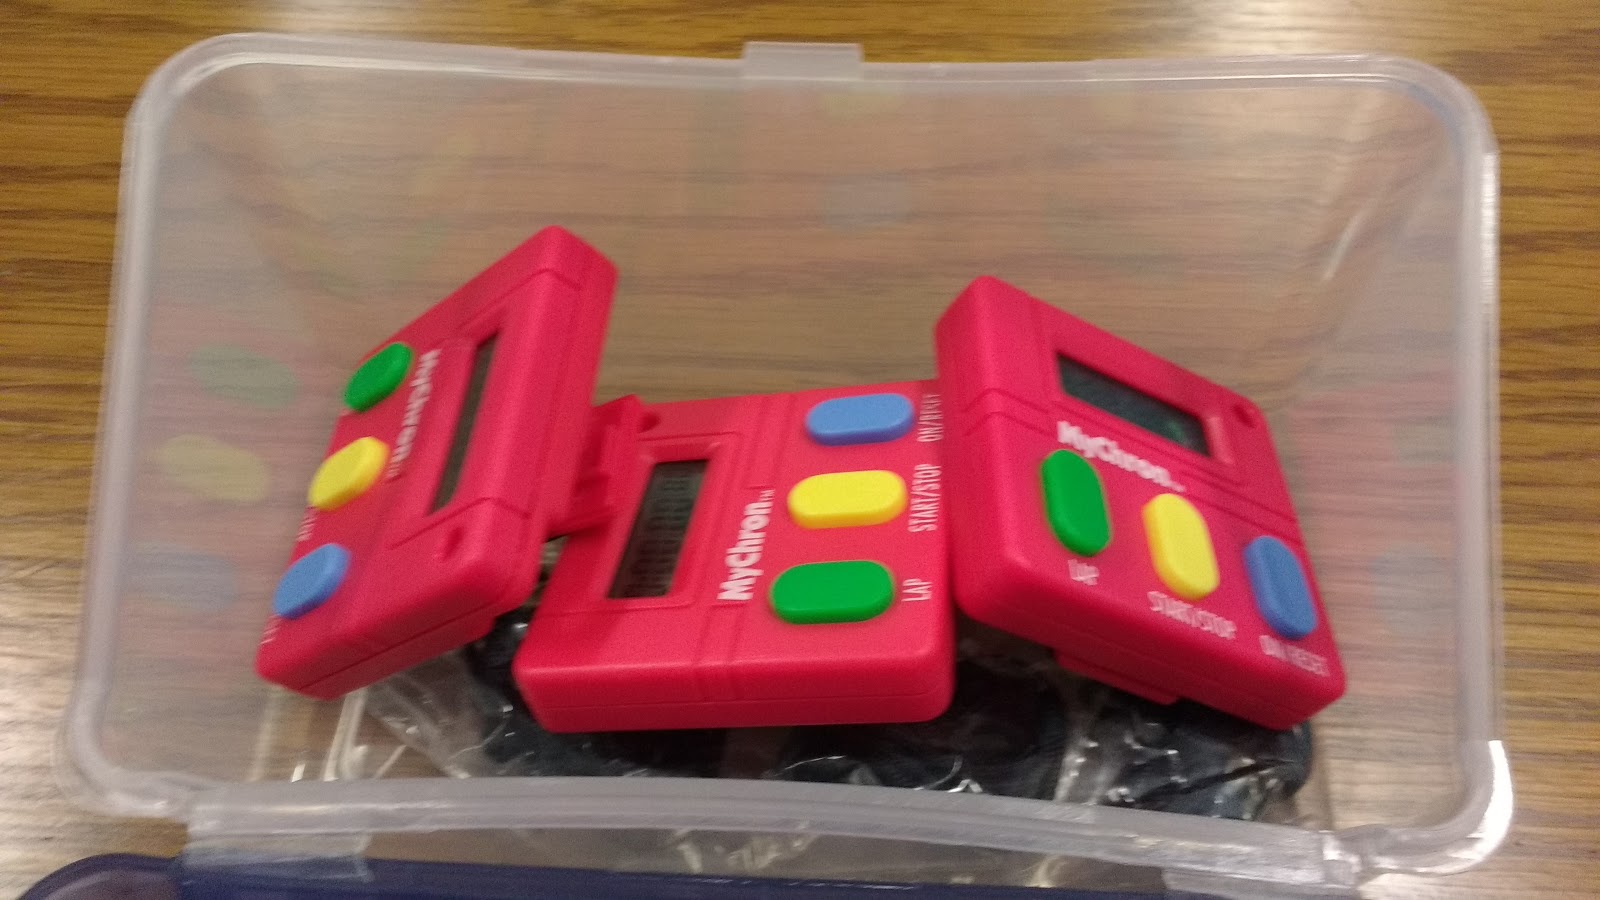
For my afternoon classes, I had my students form pairs for this activity. We pulled out our MyChron timers to help us collect our data. One student would time the other student, then they would trade places. This resulted in a much more timely data collection period!
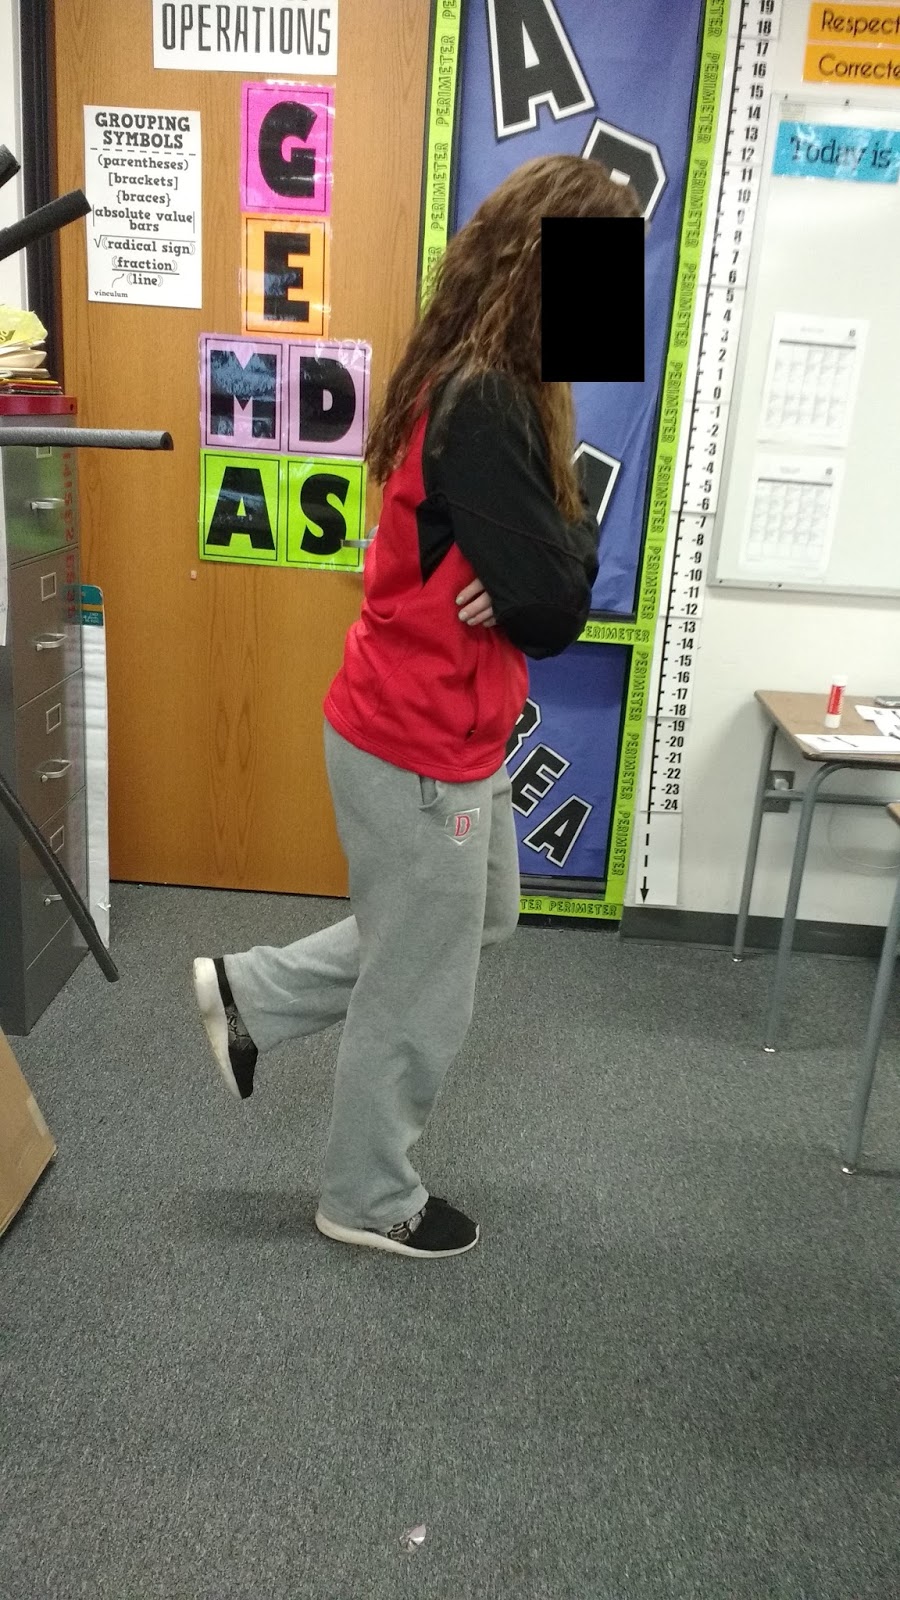
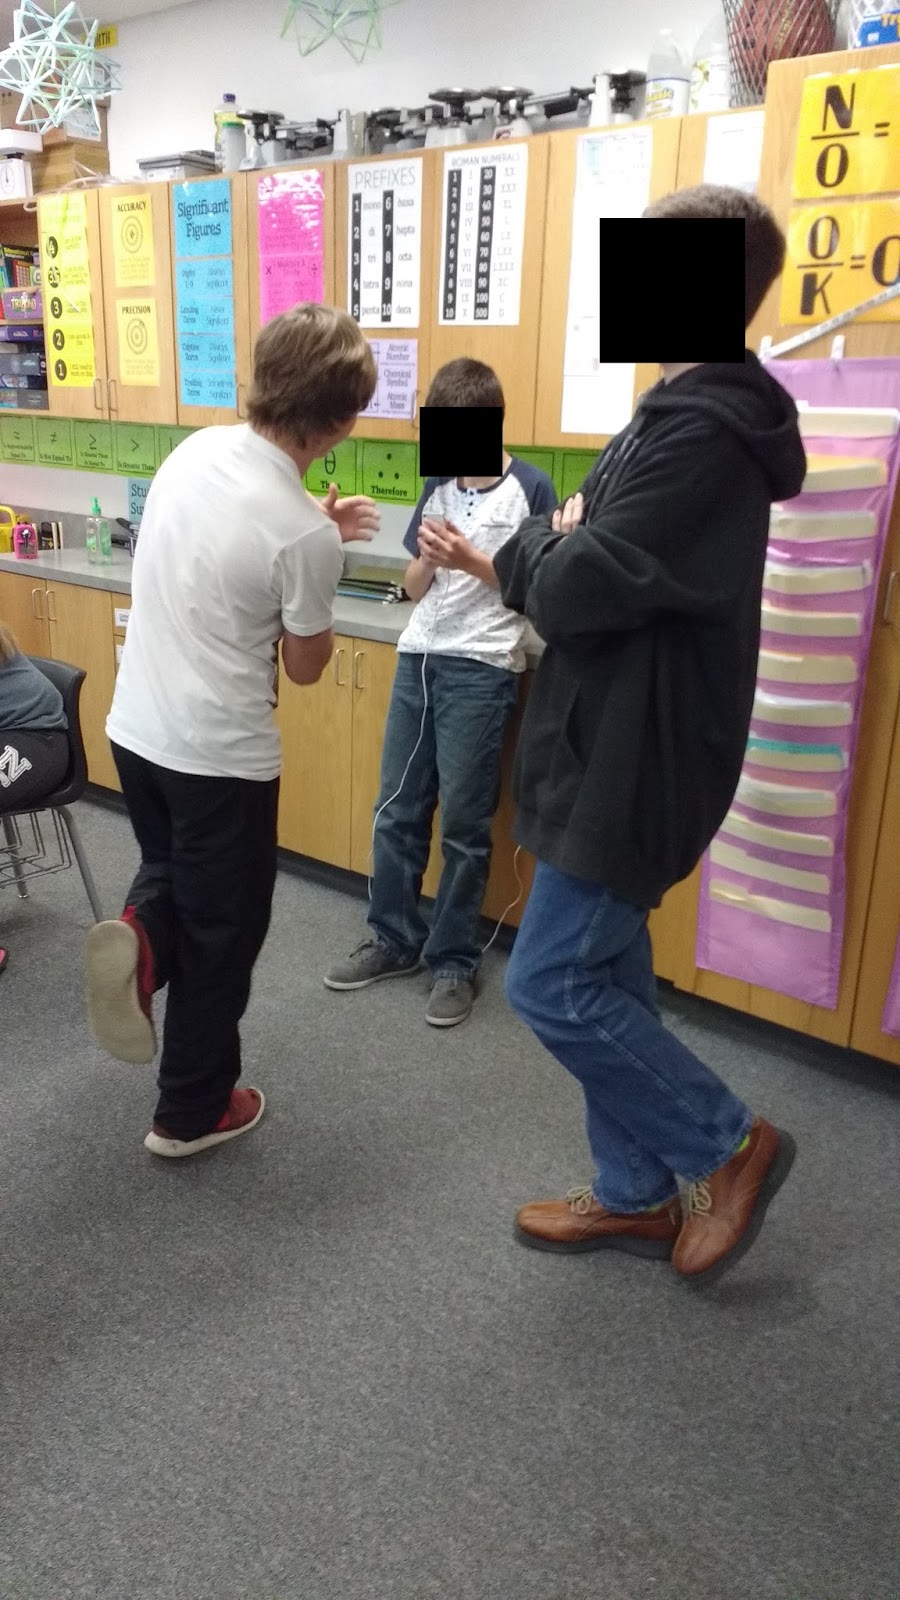
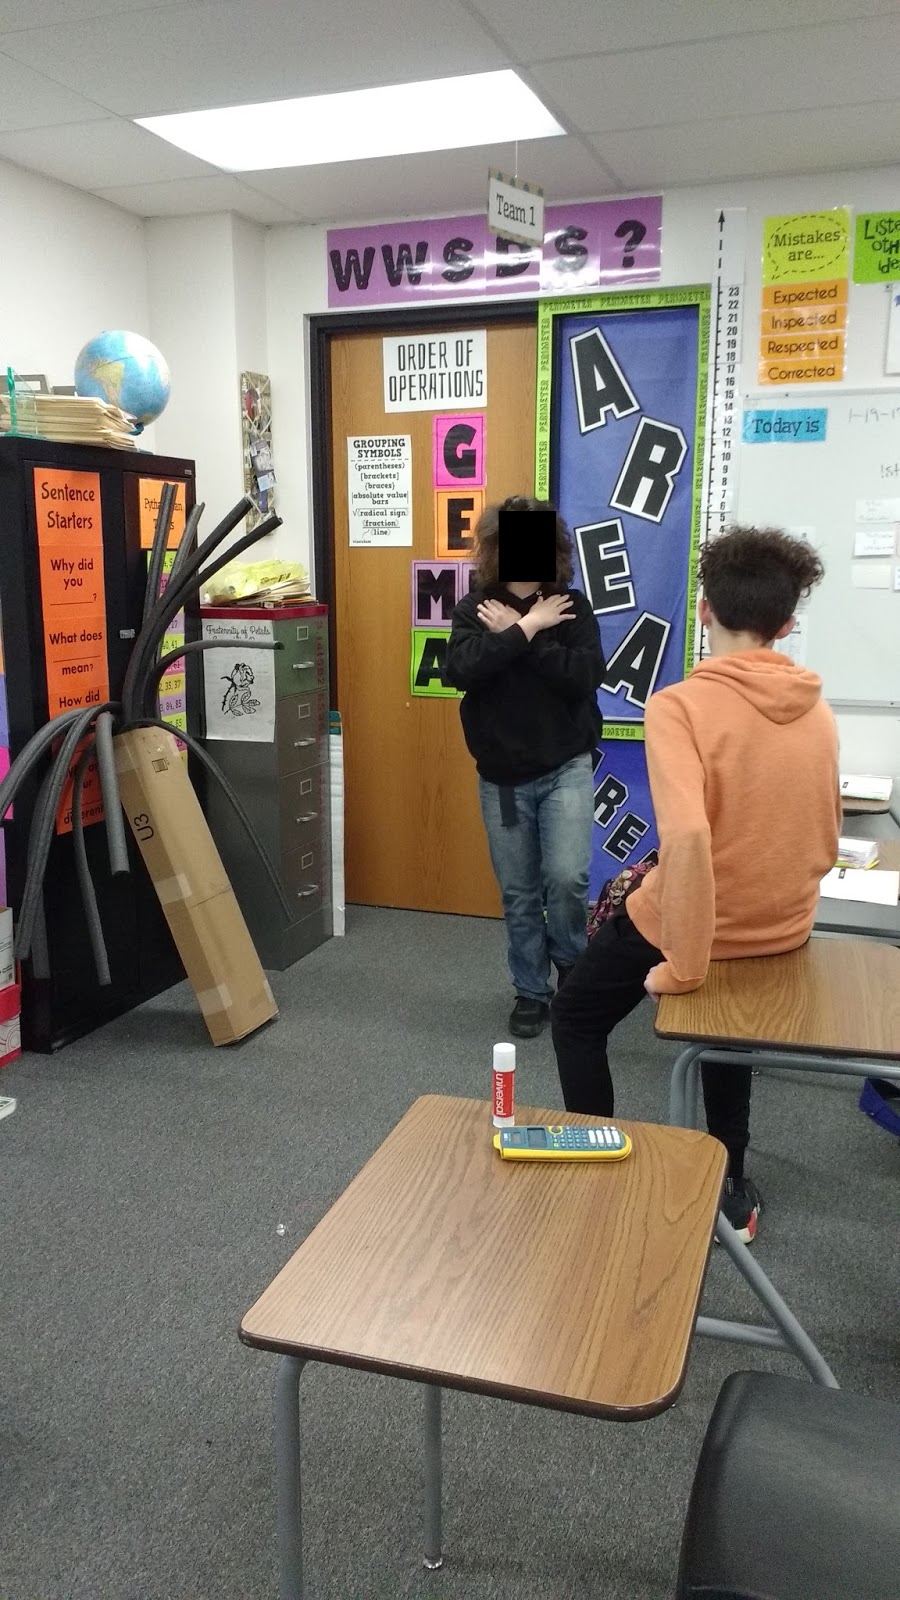
Another switch I made was to require students to stand with their arms folded against their chest. I did this with the hopes that it would make it trickier and they would be able to stand on one foot for a shorter amount of time.
I created a data sheet for my students to glue in their interactive notebooks. They recorded their data value and the data values of their classmates. Next year, I’ll change “Your Time” to “My Time.”
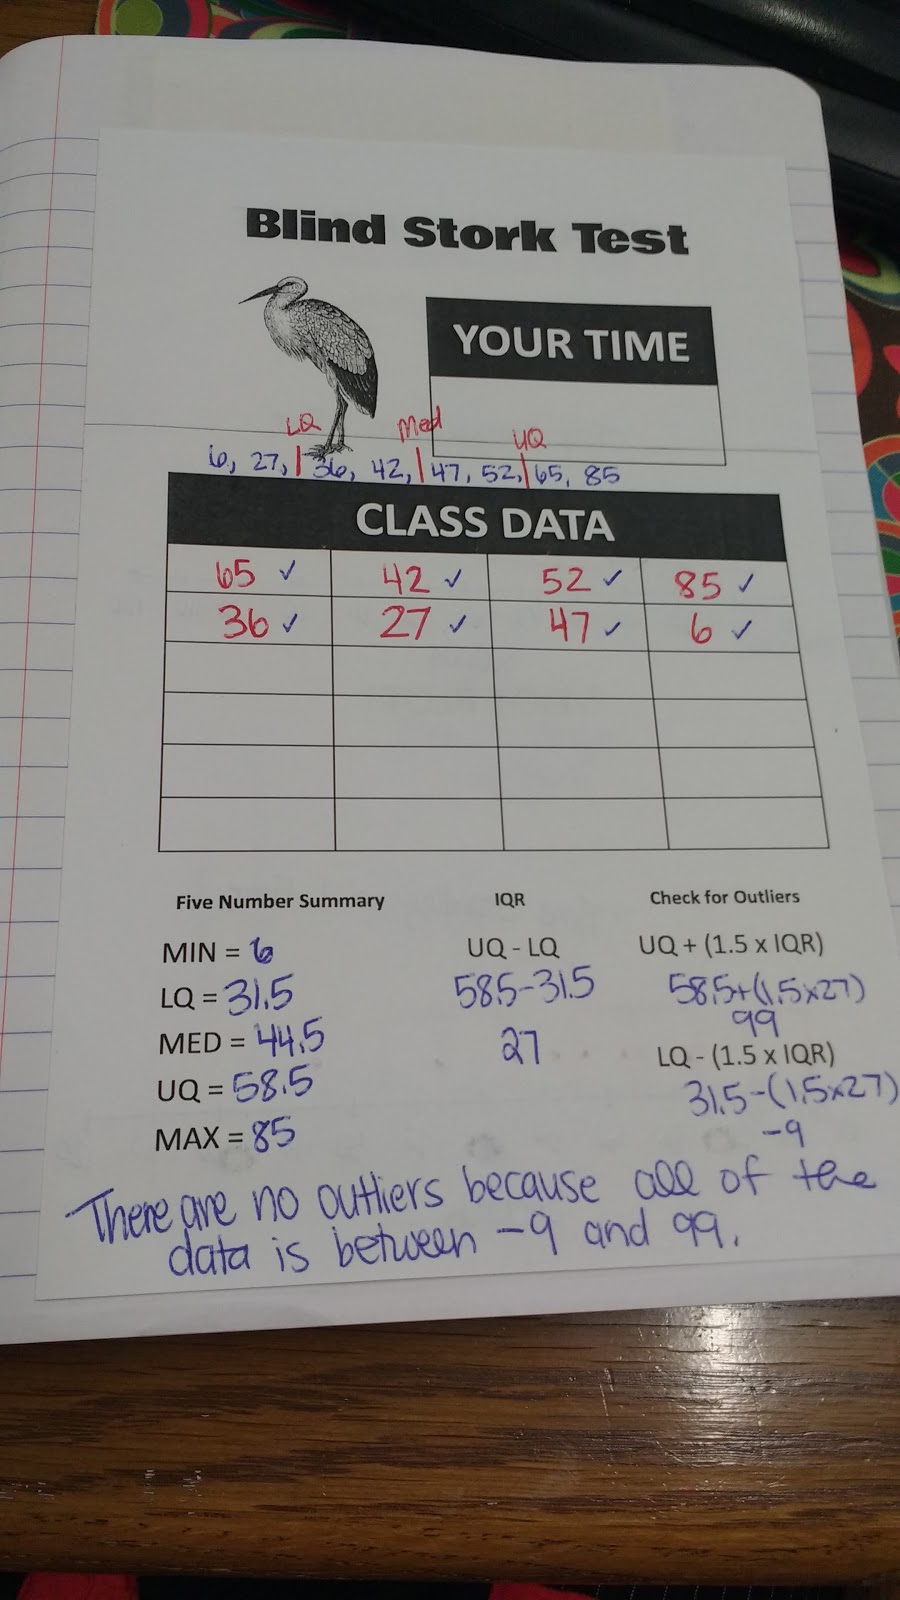
I also want to revise this to give students a place to write their data values in order. I had to squeeze it in here, and it just doesn’t look as neat and nice as I’d hoped.
After writing down the data for the class, I had my students find the five number summary. We then used the five number summary to solve for the IQR and check for outliers.
In the future, I would definitely designate a certain place on the notes for students to explain the presence/absence of outliers.
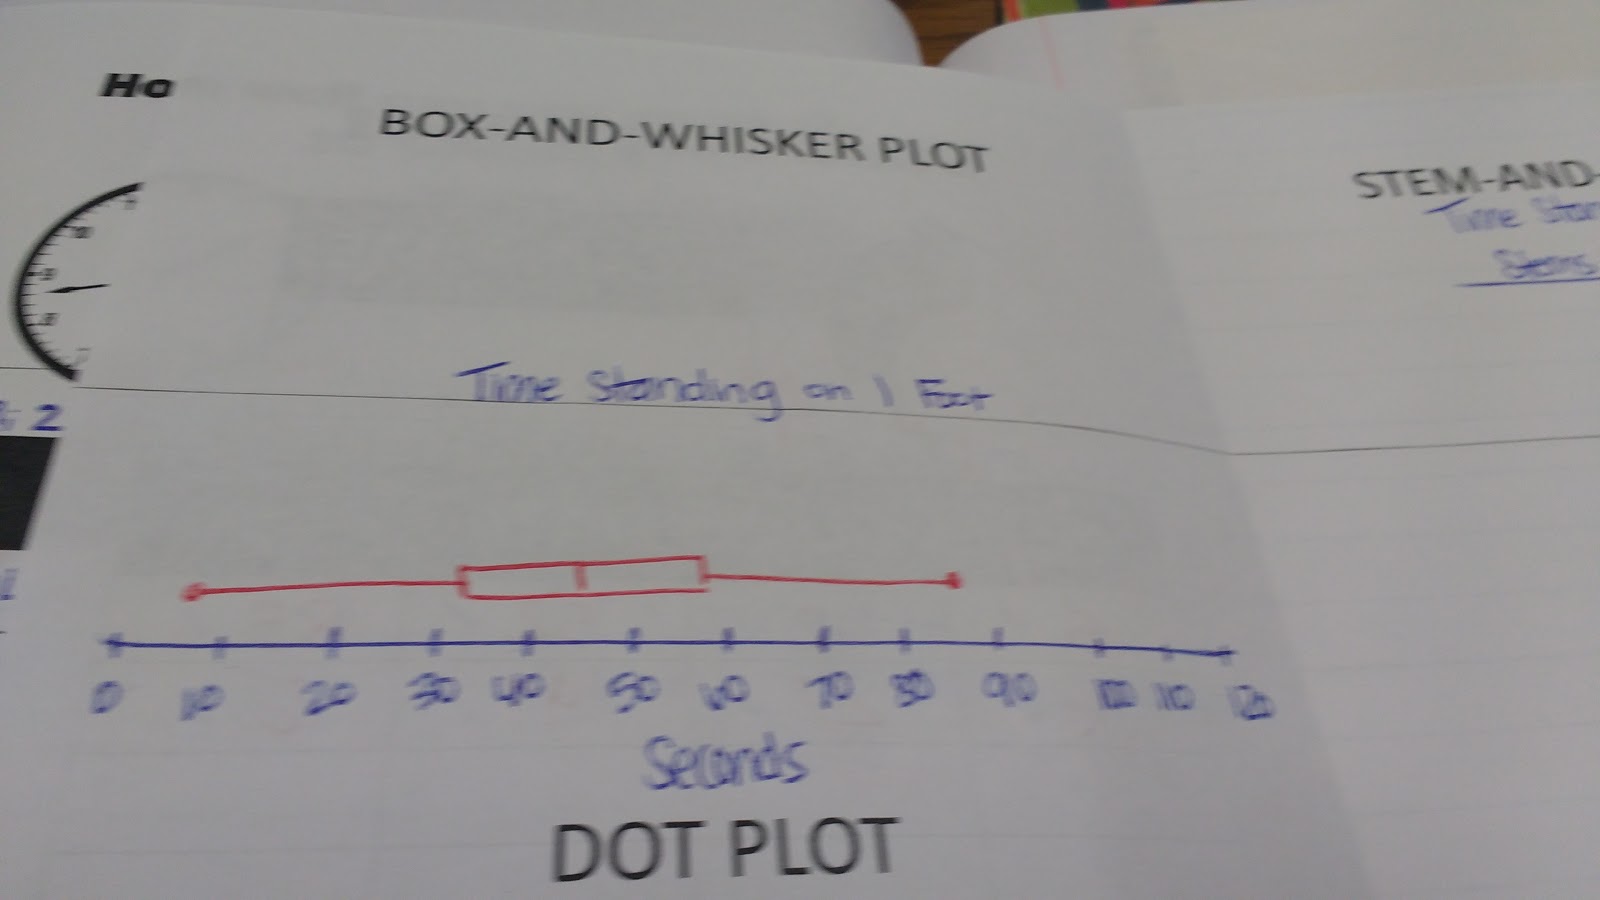
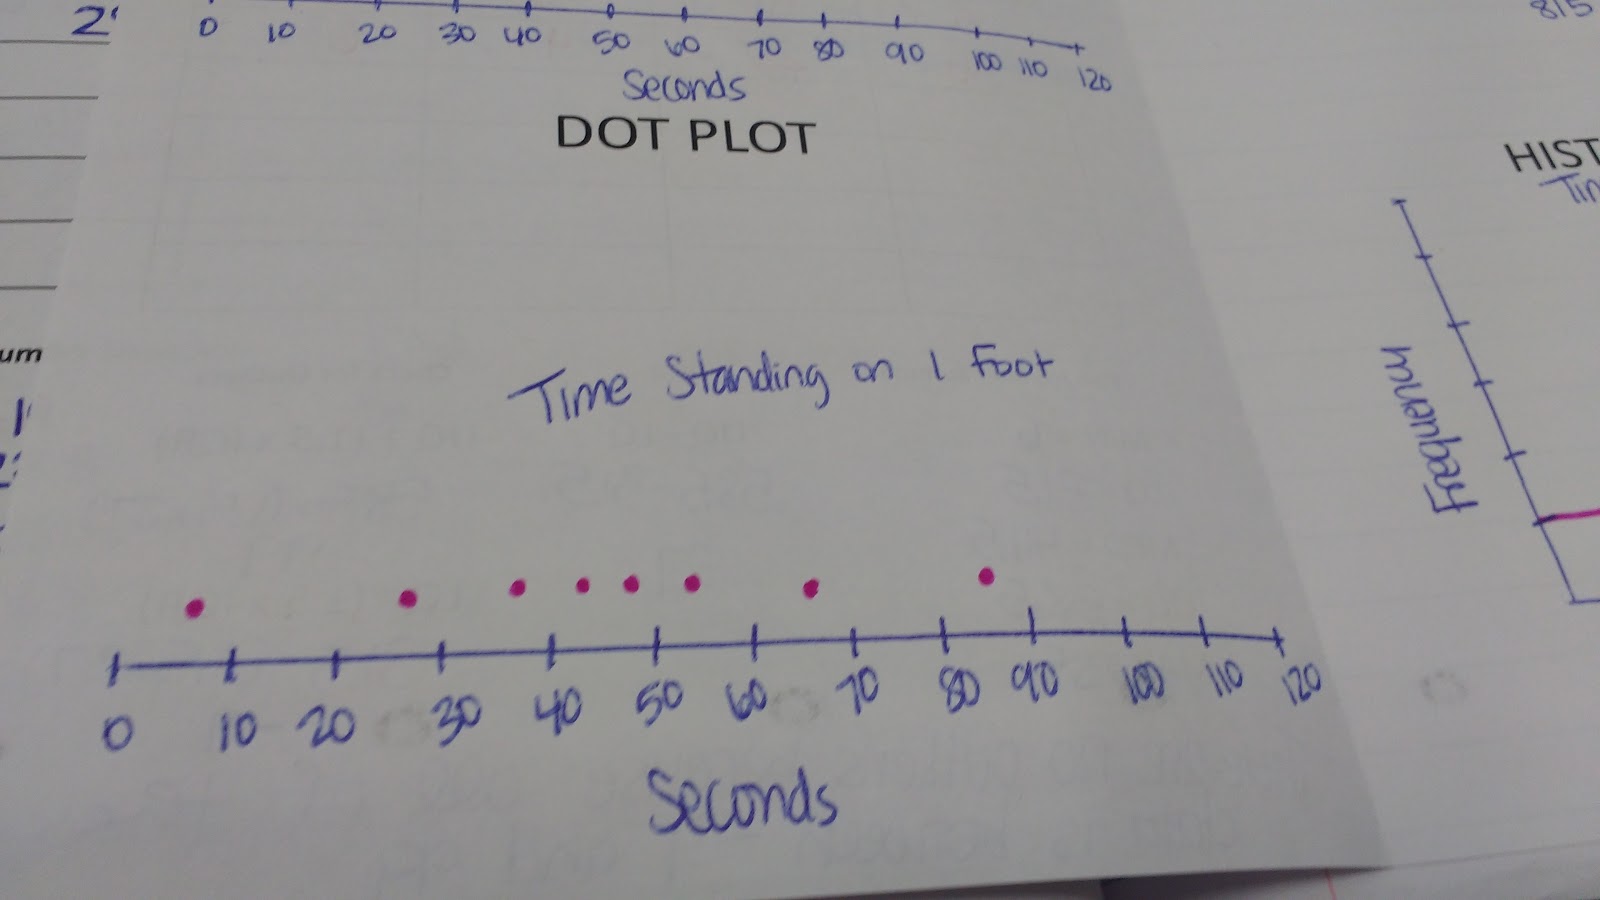
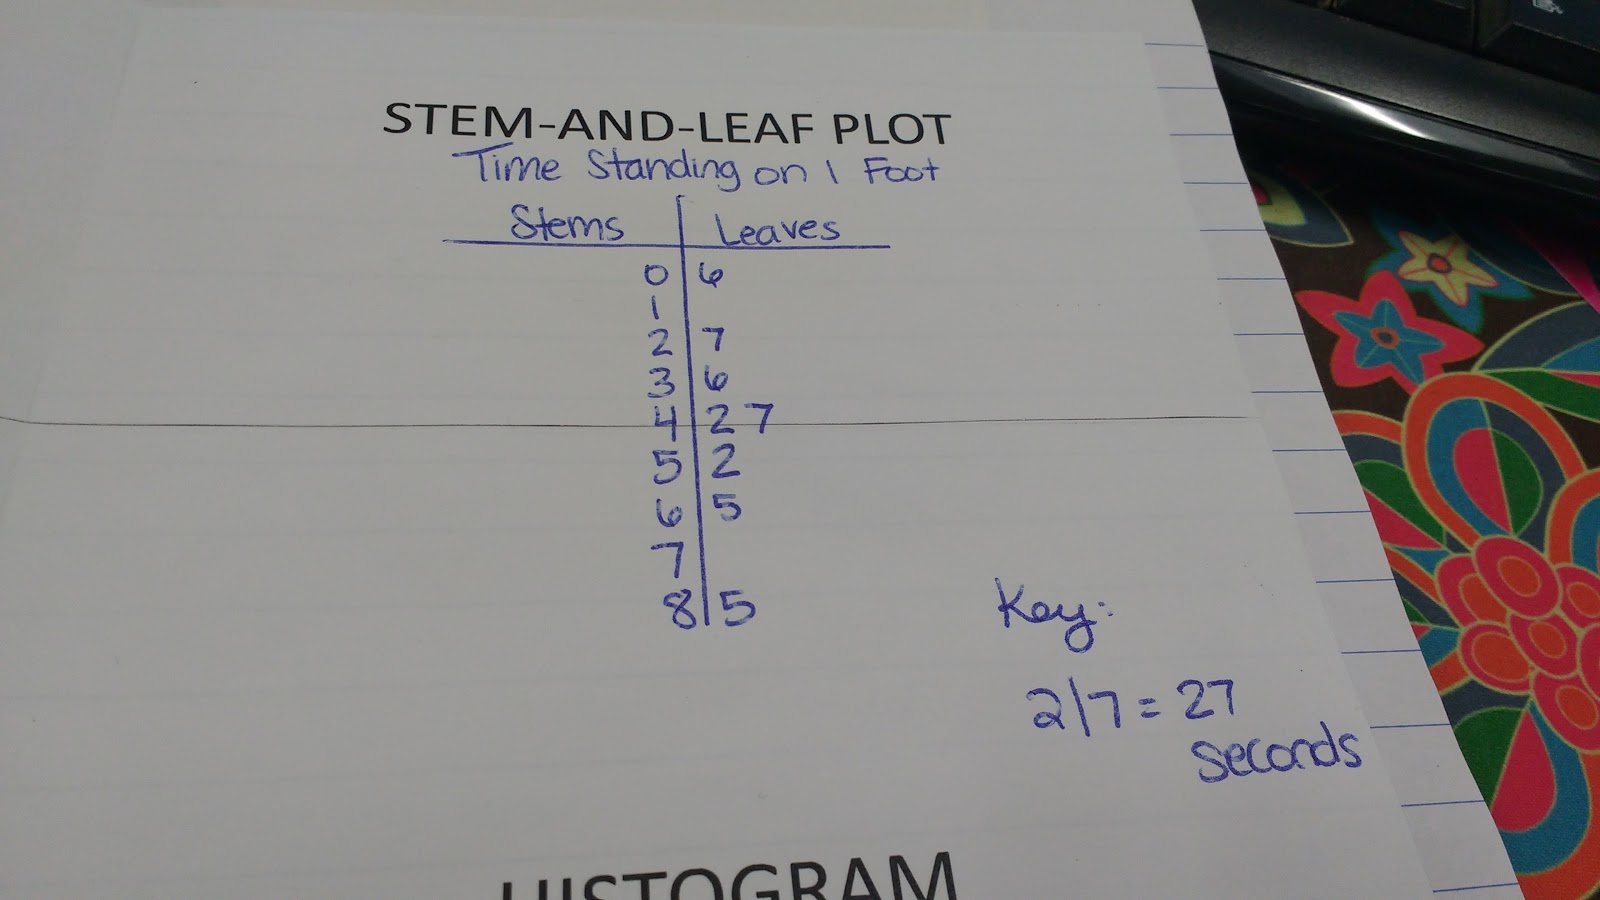
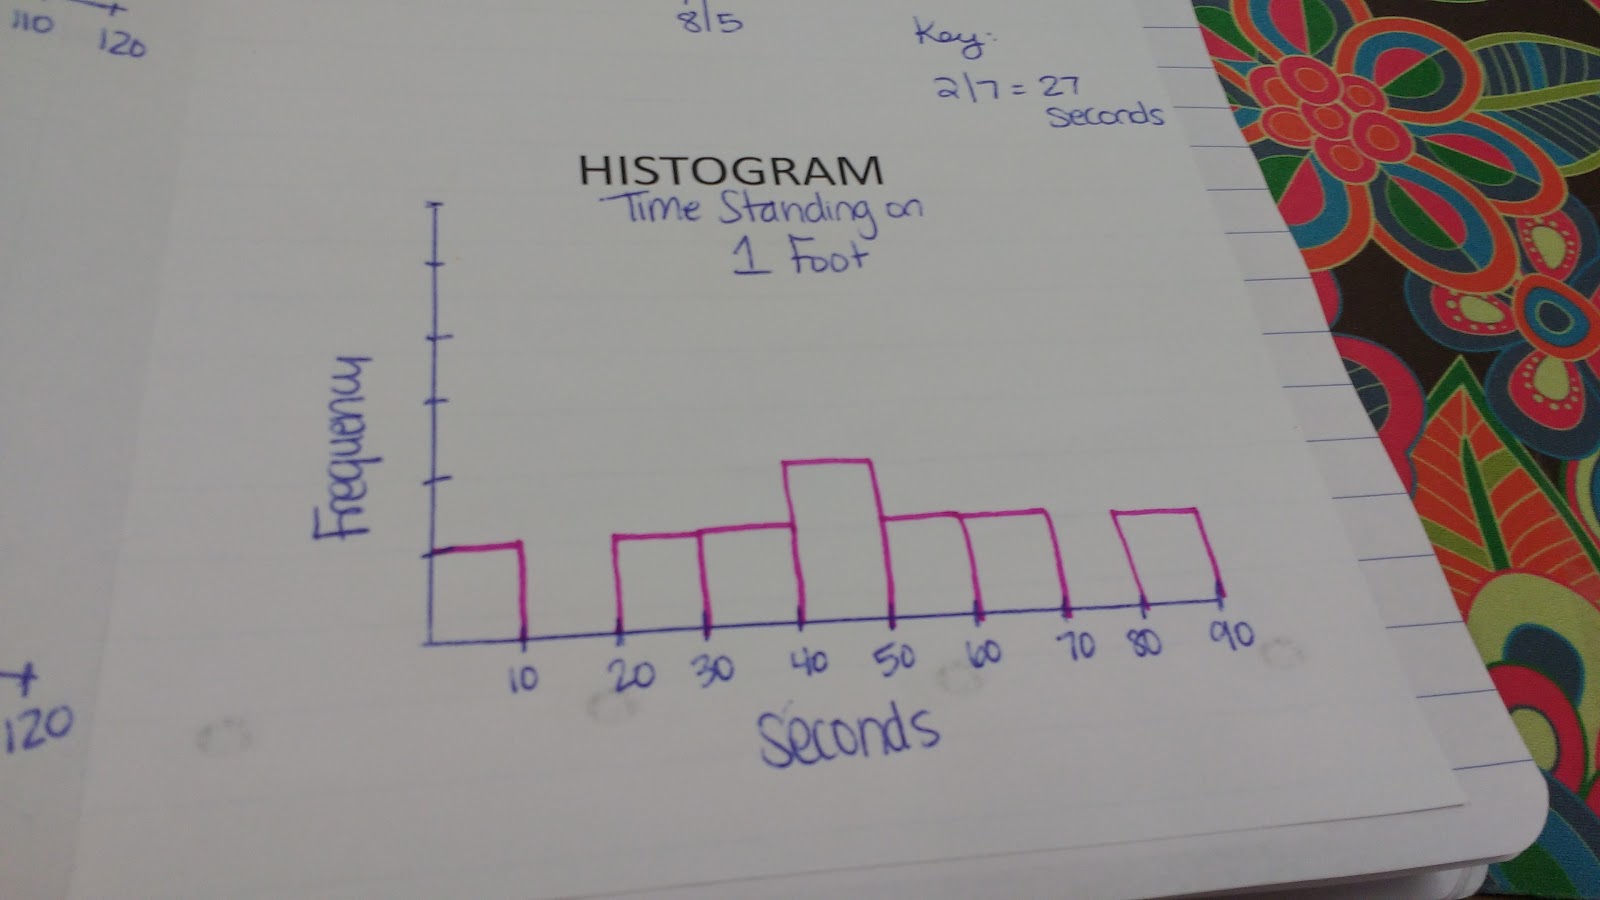
On the inside of our notes, I had students create a box-and-whisker plot, dot plot, stem-and-leaf plot, and histogram.
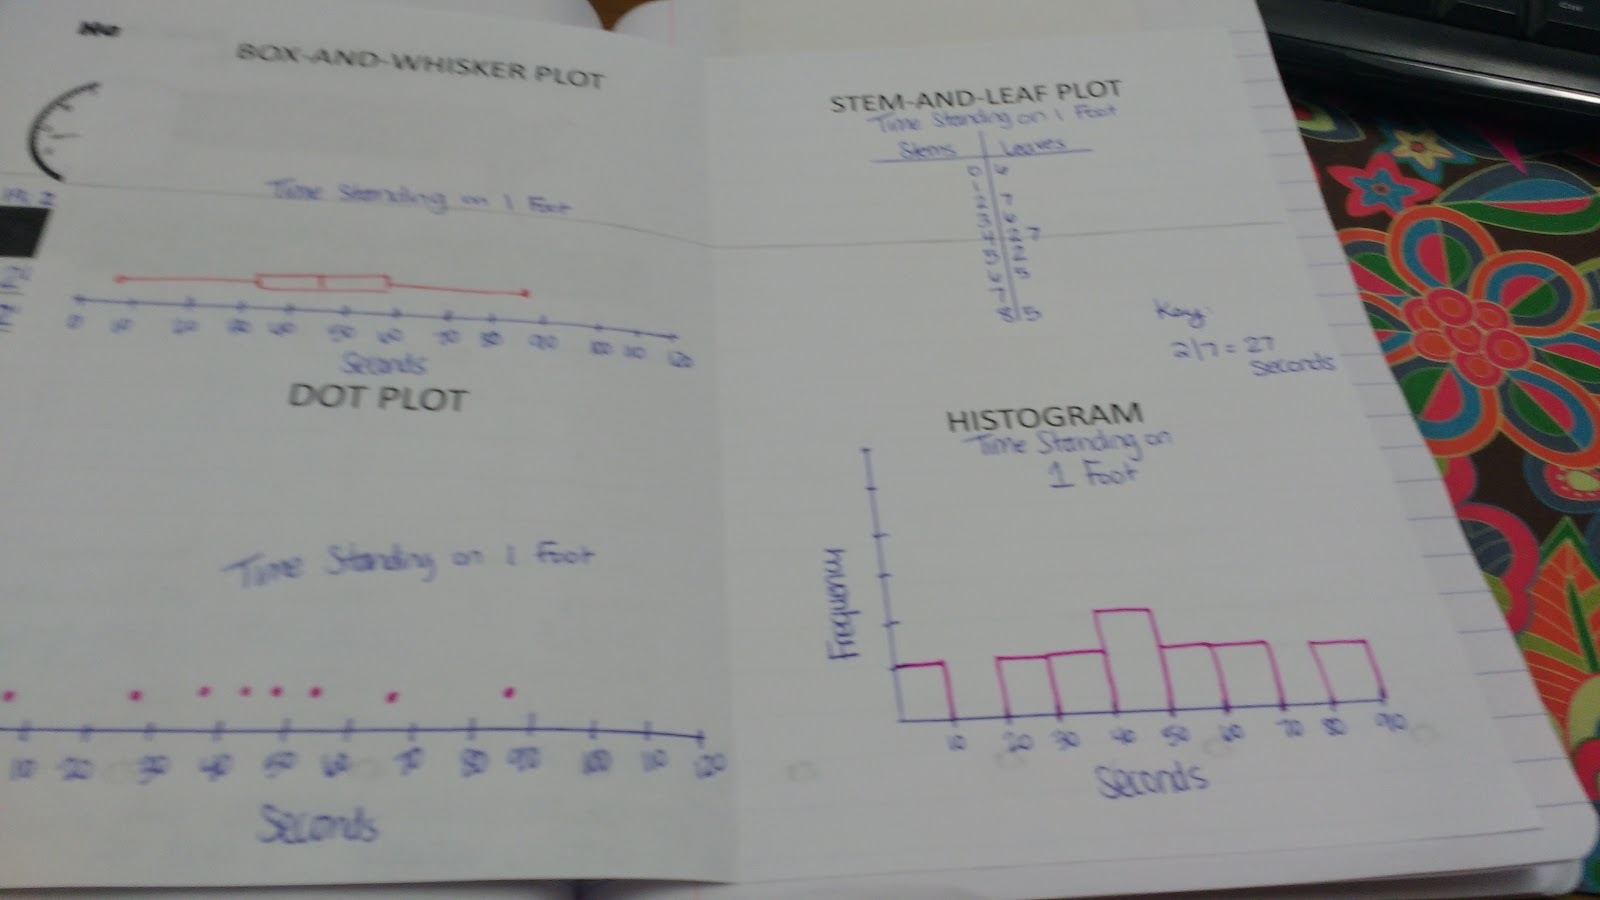
I definitely need to give my students a pre-made (but not pre-numbered) number line for their box-and-whisker plot and dot plot next year. That should save lots of time!
I want to put graph paper in the background for the stem-and-leaf plot to help students align their data more evenly.
I also believe that graph paper would be super-useful for making histograms in the future, too.
Here are a few more photos of my students in action during the blind stork test.
This is amazing!!! Love your ideas. Keep them coming!! Can't wait to do statistics unit now with Math 1.