Skip to content
Facebook
X
Instagram
Threads
YouTube
Pinterest
Email
Trending Resource
:
40+ Ideas for the First Week of School
About
Expand
About Me
Puzzles
Expand
All Printable Puzzles
Math Puzzles
Logic Puzzles
Seasonal and Holiday Puzzles
Word Puzzles
Hands-On Puzzles
Mazes
Puzzle Solutions
Answer Key Database
Resources
Expand
Sort by Season or Holiday
Sort by Theme
Sort by Grade Level
Expand
Lower Elementary K-2
Upper Elementary 3-5
Middle School 6-8
High School 9-12
Sort by Math Topic
Expand
Number & Operations
Algebra & Functions
Geometry & Measurement
Statistics & Probability
Trigonometry
Calculus
SEARCH
Search
Facebook
X
Instagram
YouTube
Toggle Menu
SEARCH
Search
Home
»
Statistics
Statistics
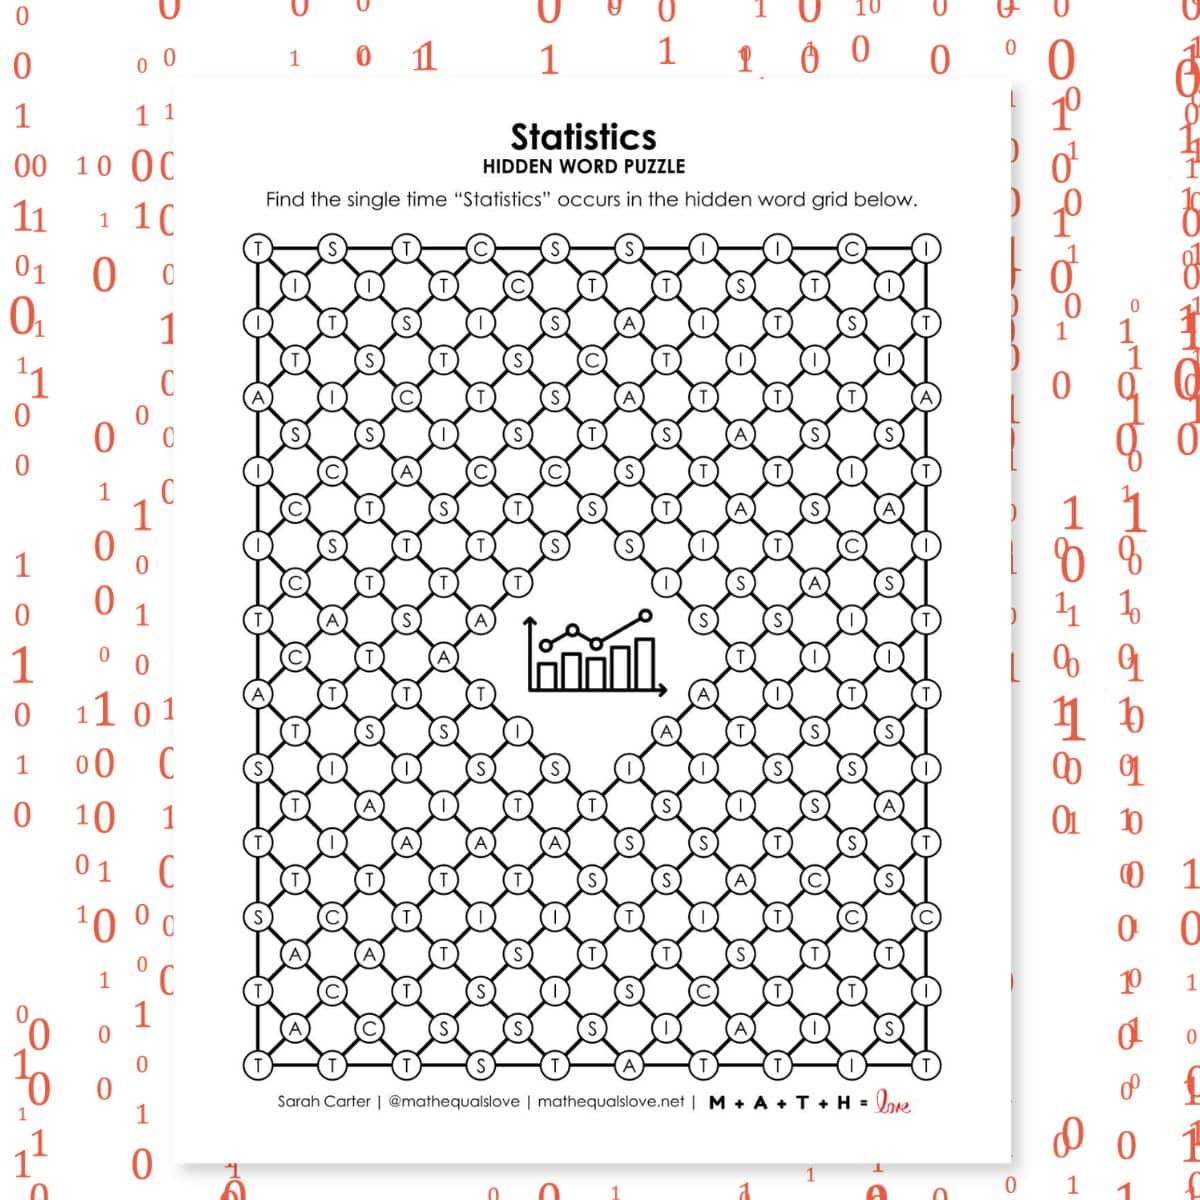
Statistics Hidden Word Puzzle
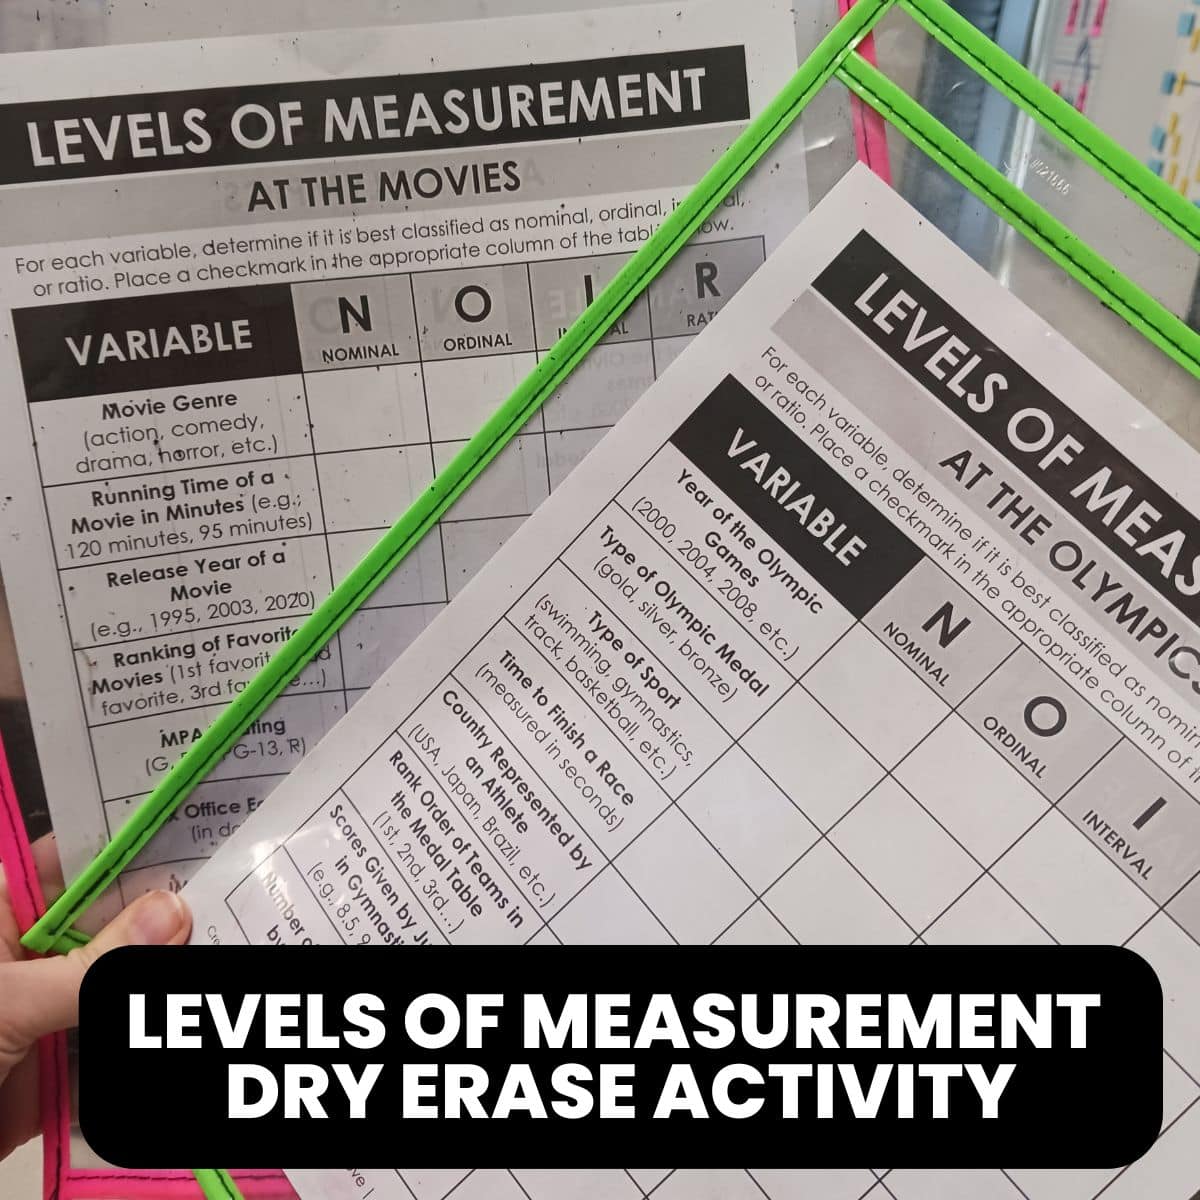
Levels of Measurement Dry Erase Activities
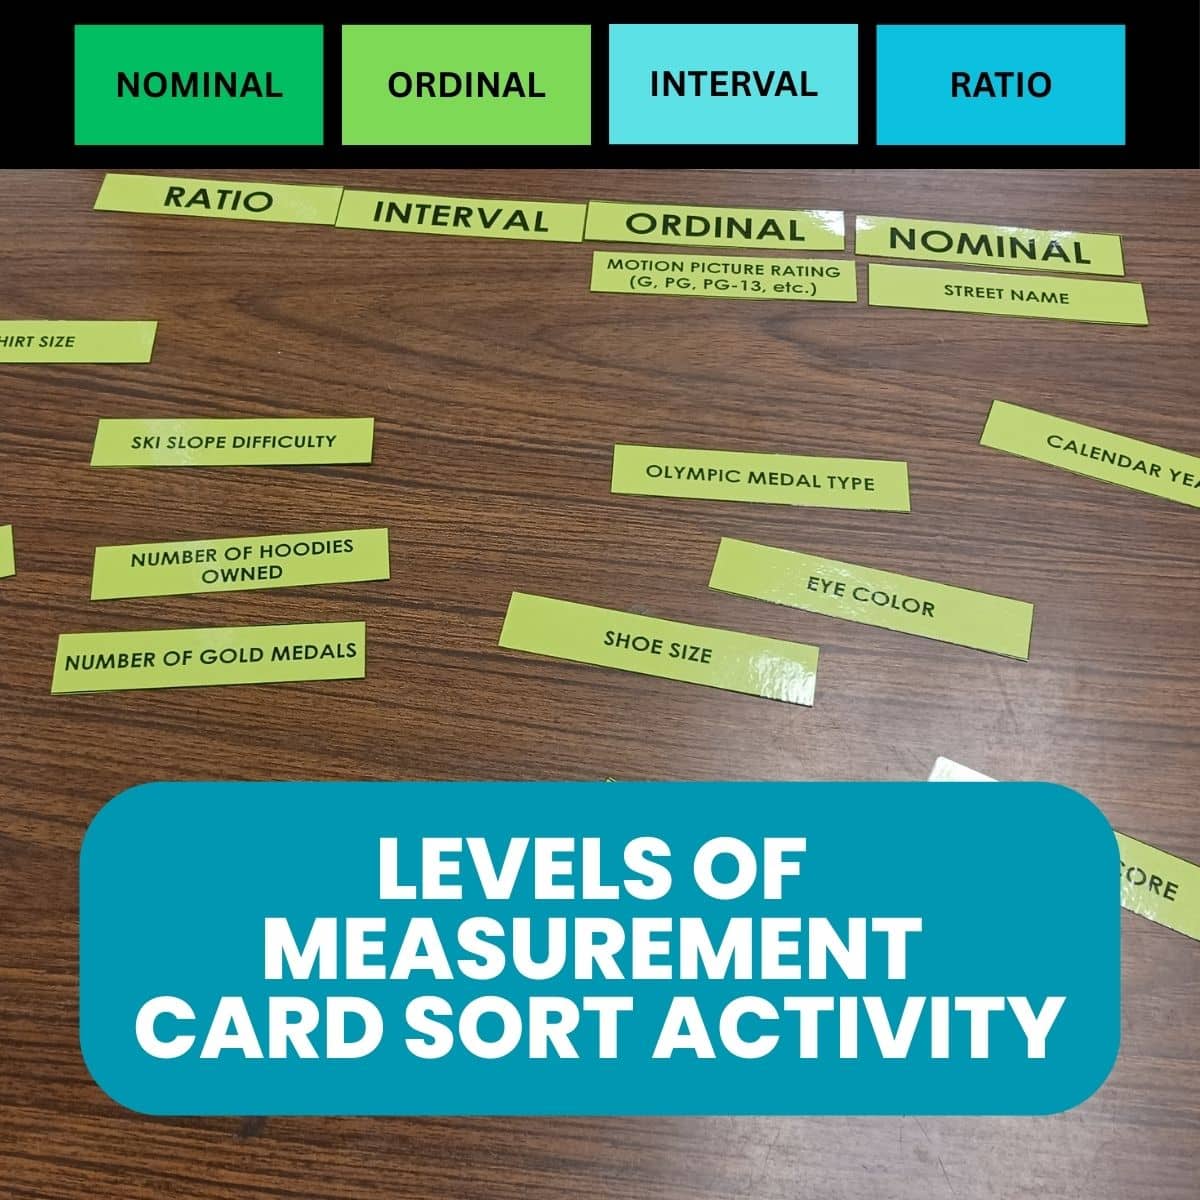
Levels of Measurement Card Sort Activity
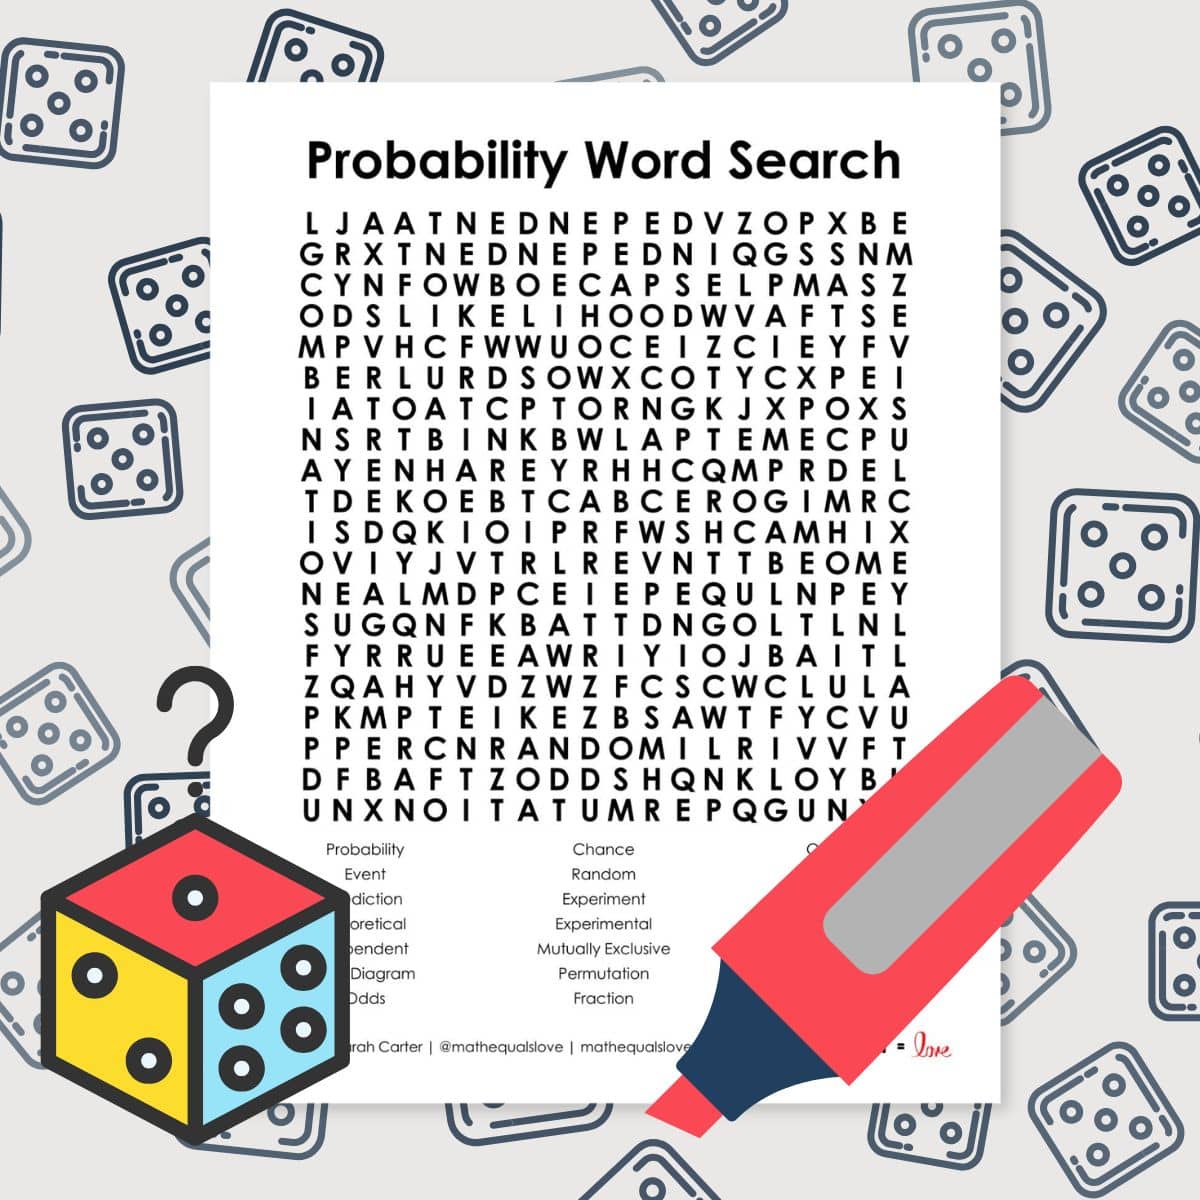
Probability Word Search Puzzle
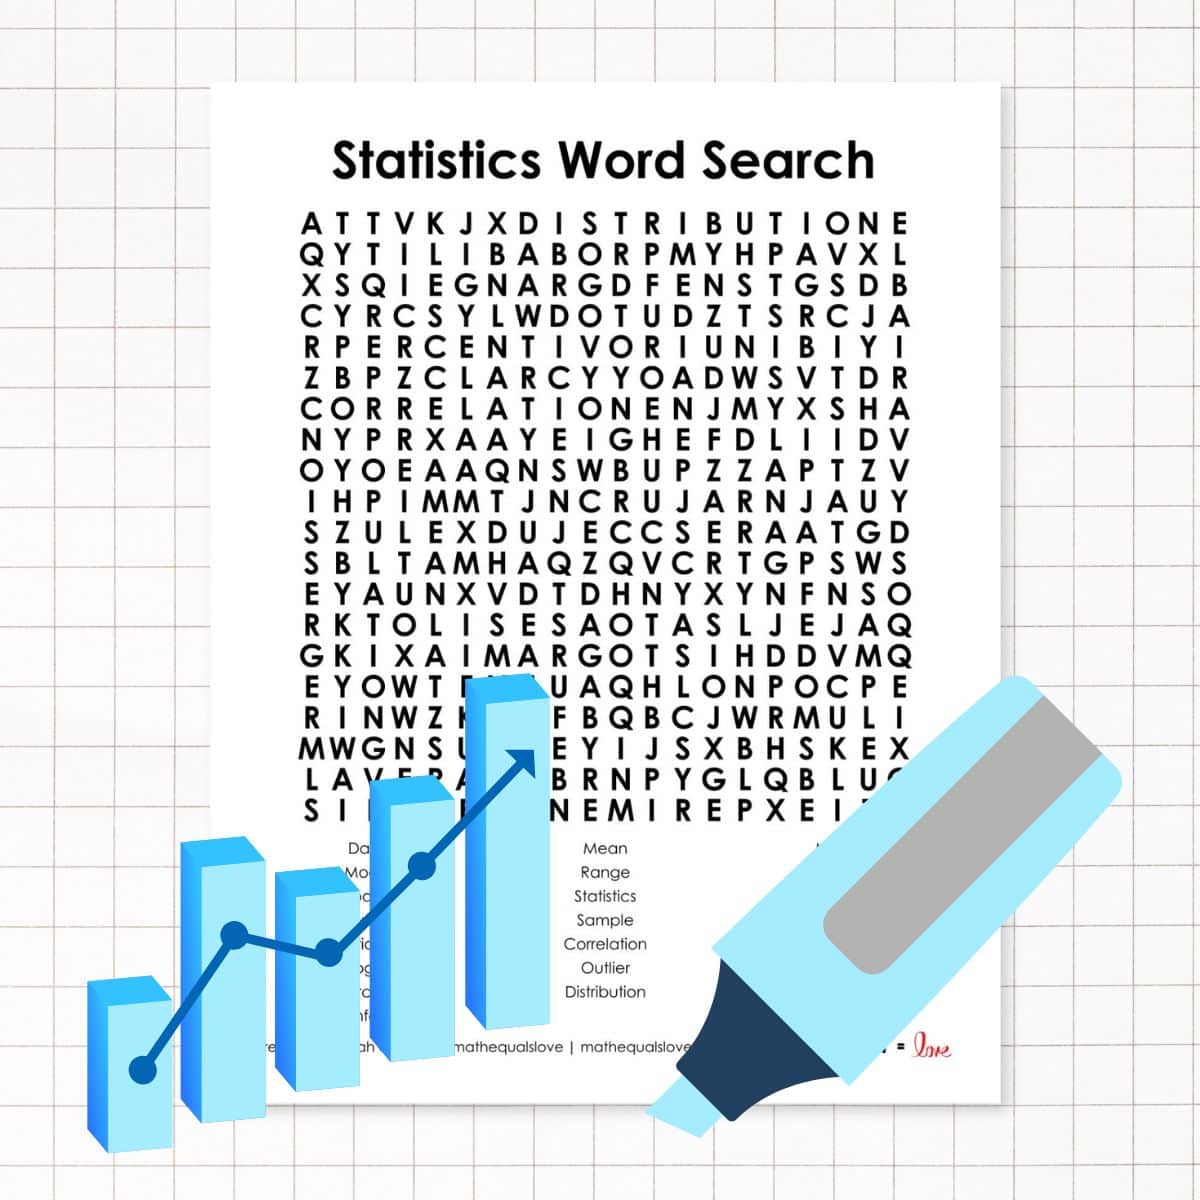
Statistics Word Search Puzzle
Statistics Jokes and Puns
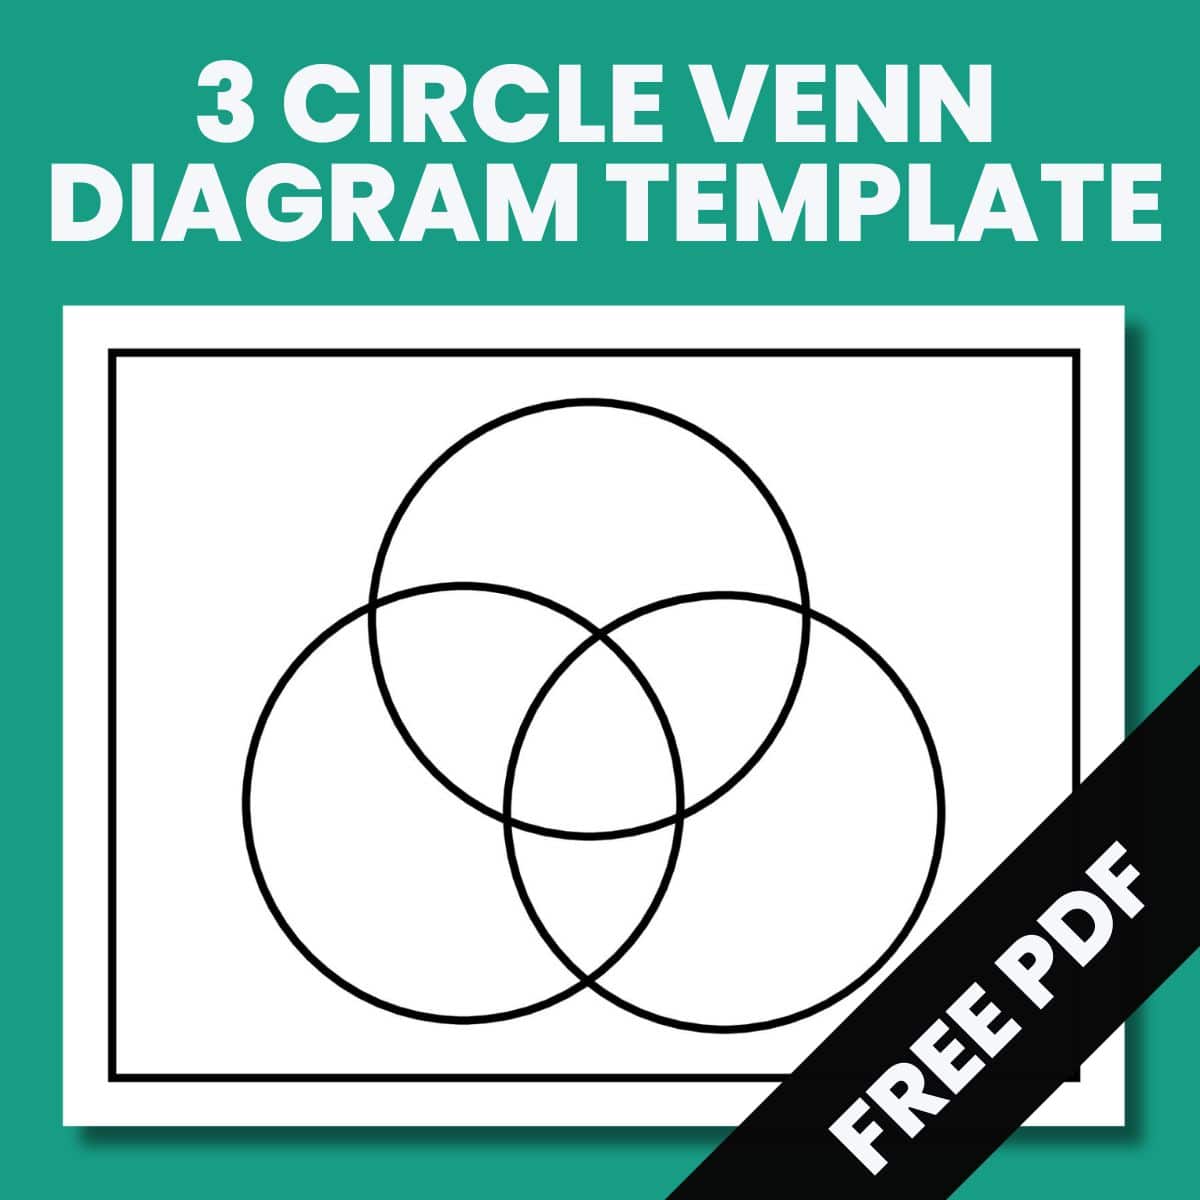
3 Circle Venn Diagram Template
Statistics Activities
Engaging Probability Games and Activities
Scatter Plot Activities
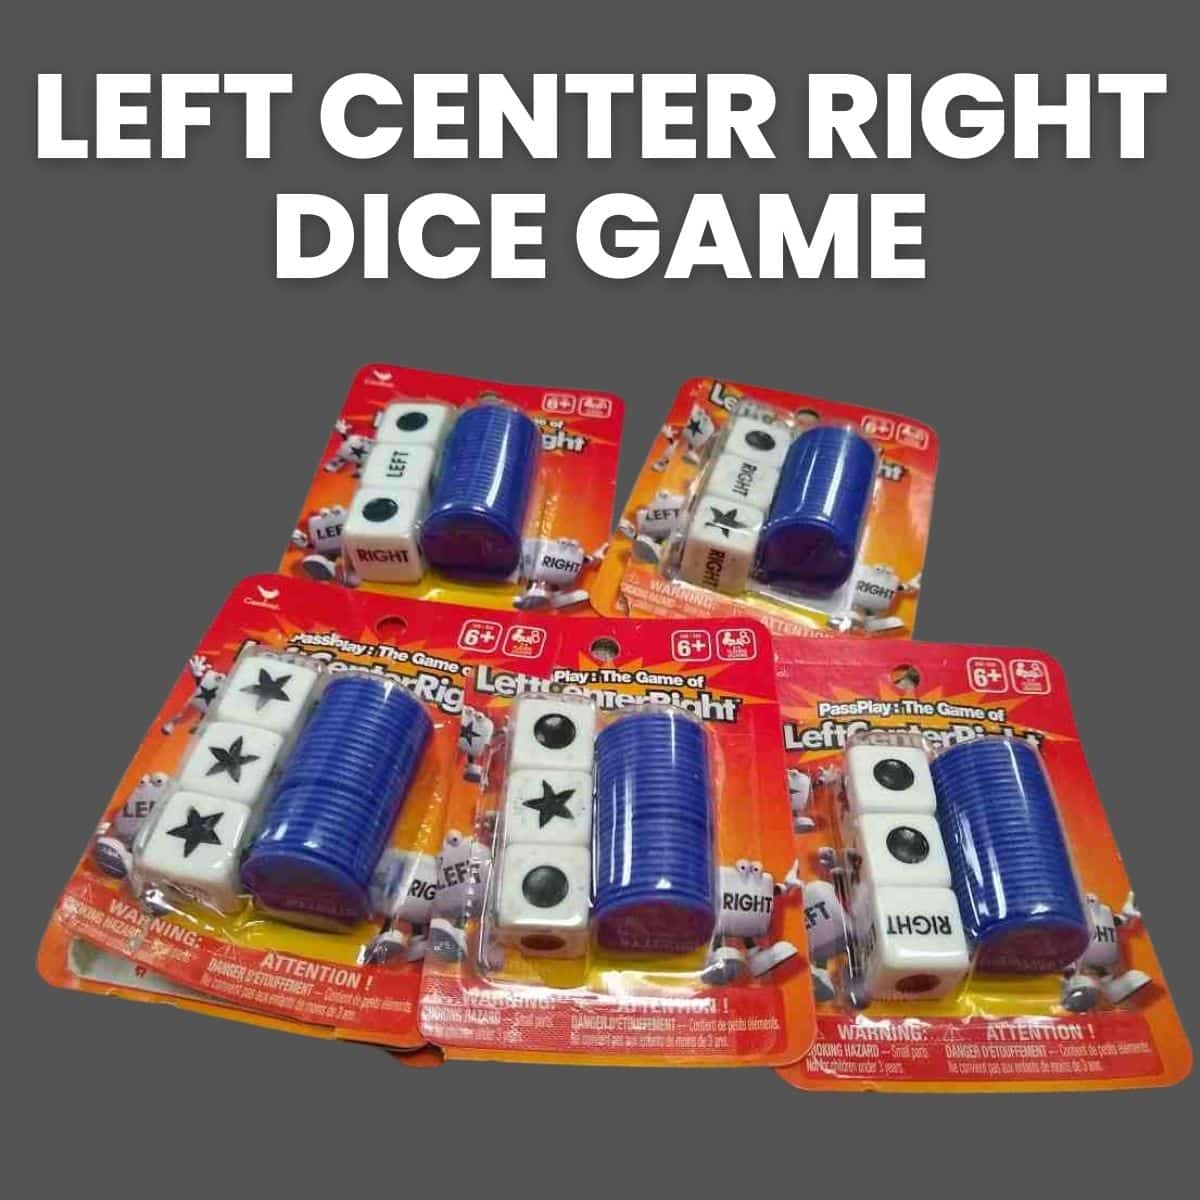
Left Center Right Dice Game
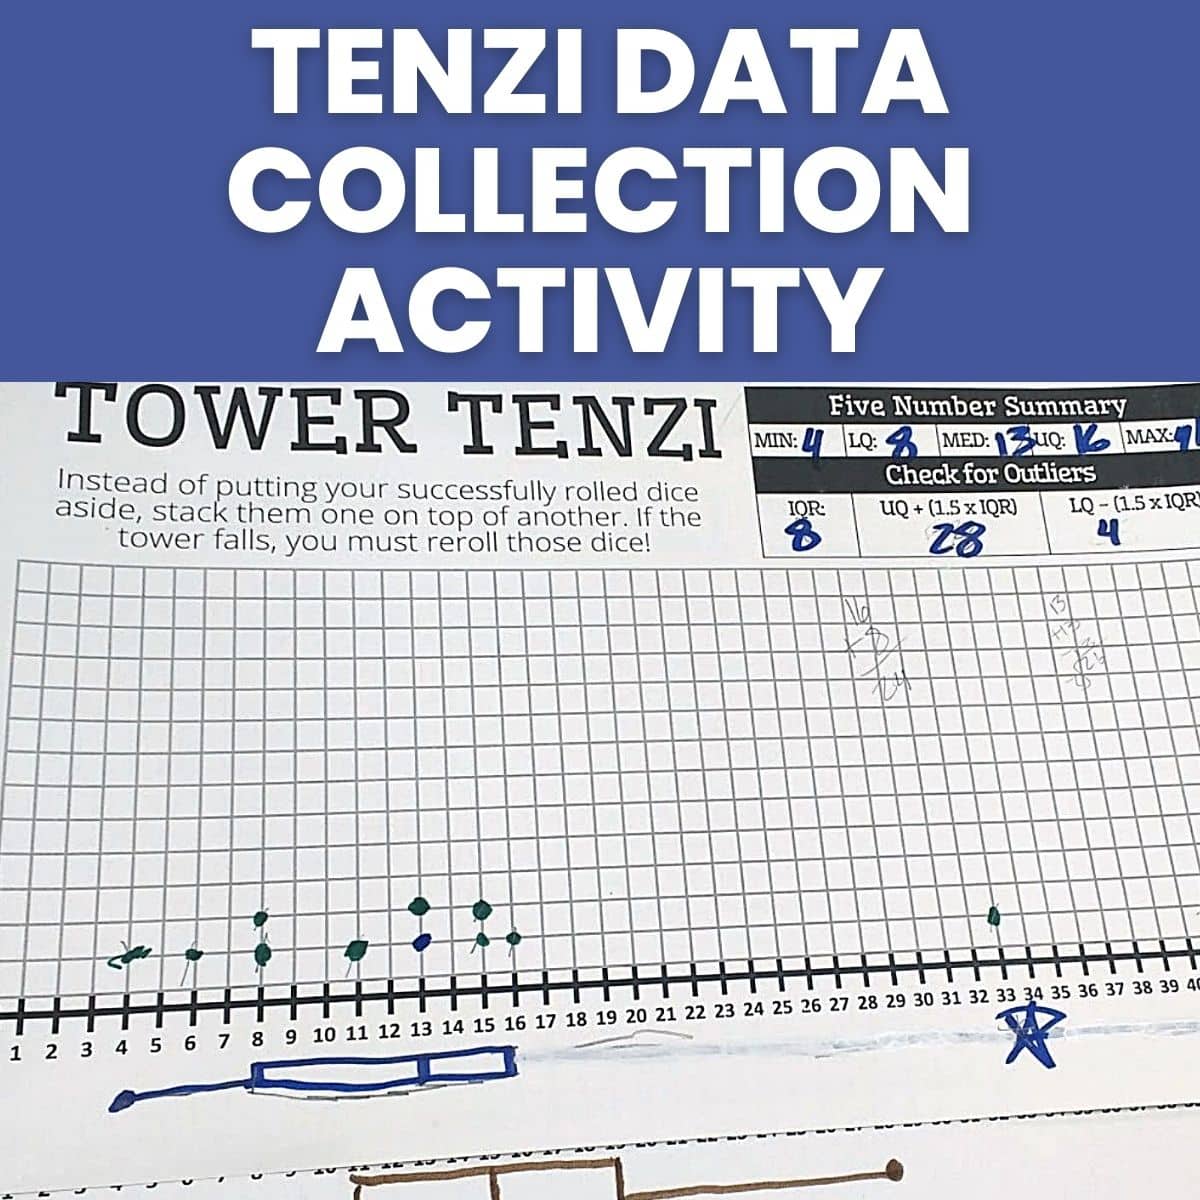
Tenzi Data Collection Activity for Comparing Data Sets
Mean Median Mode & Range Challenge Activity
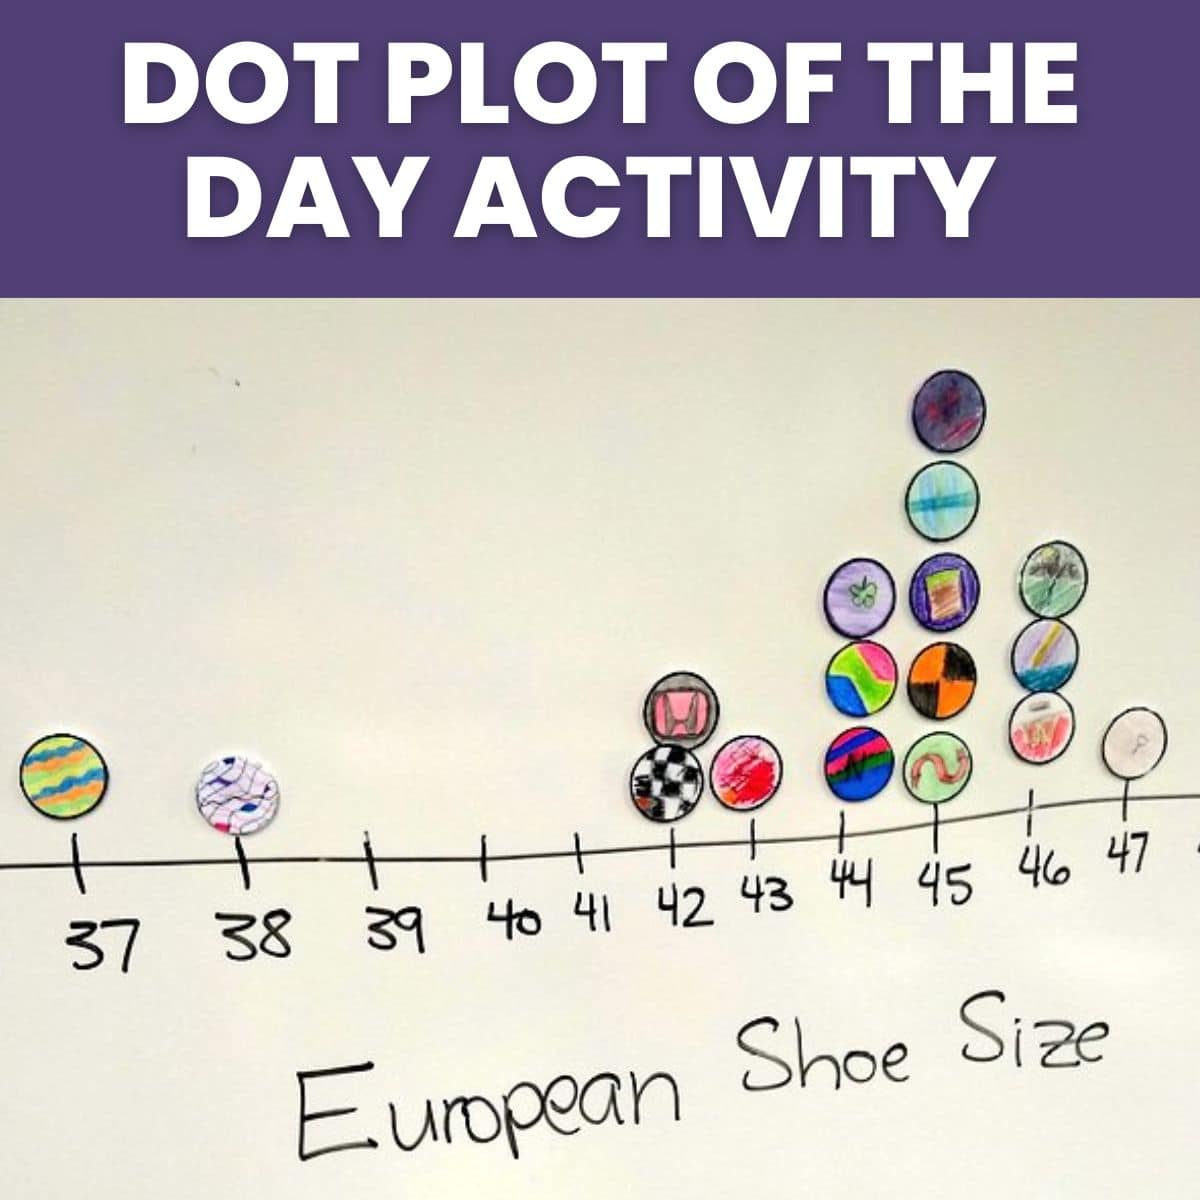
Dot Plot of the Day Activity
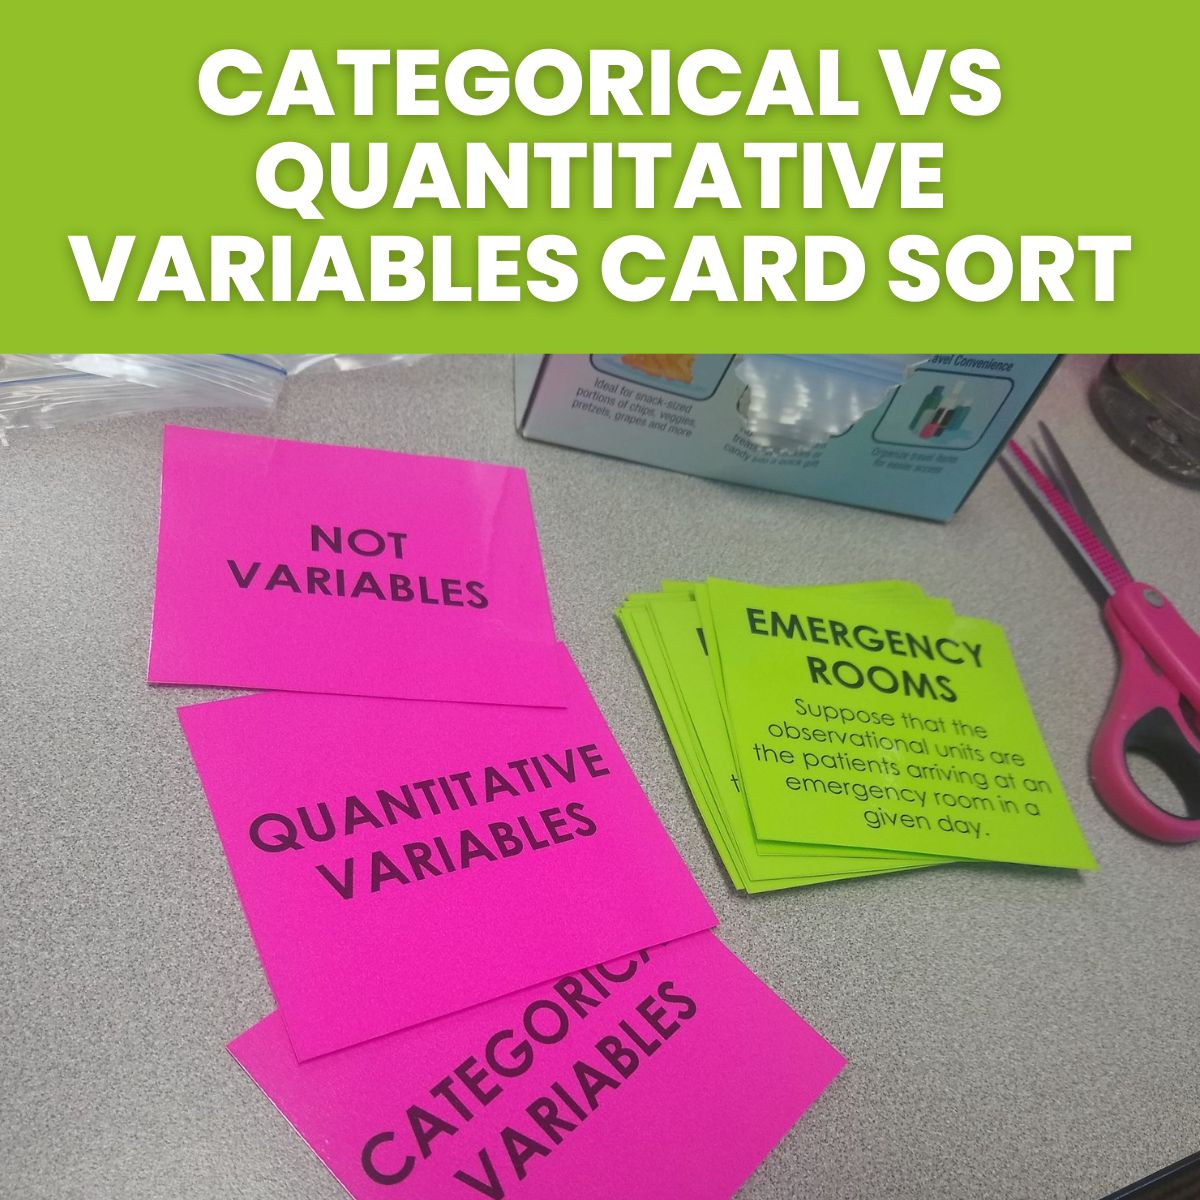
Emergency Rooms Card Sort Activity for Categorical and Quantitative Variables
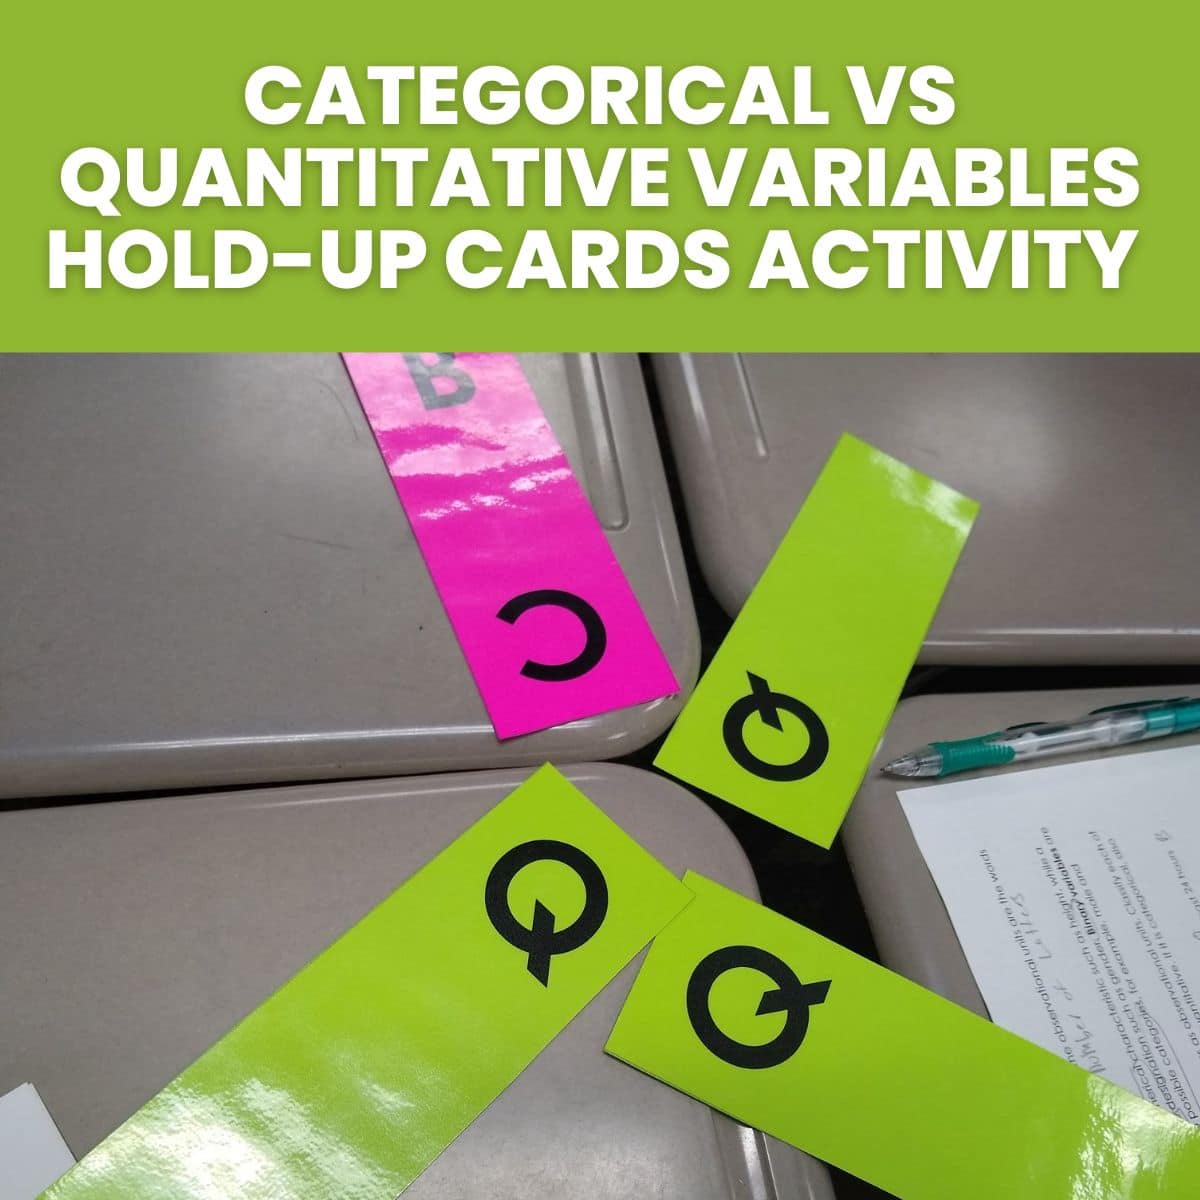
Categorical vs Quantitative Variables Hold-Up Cards Activity
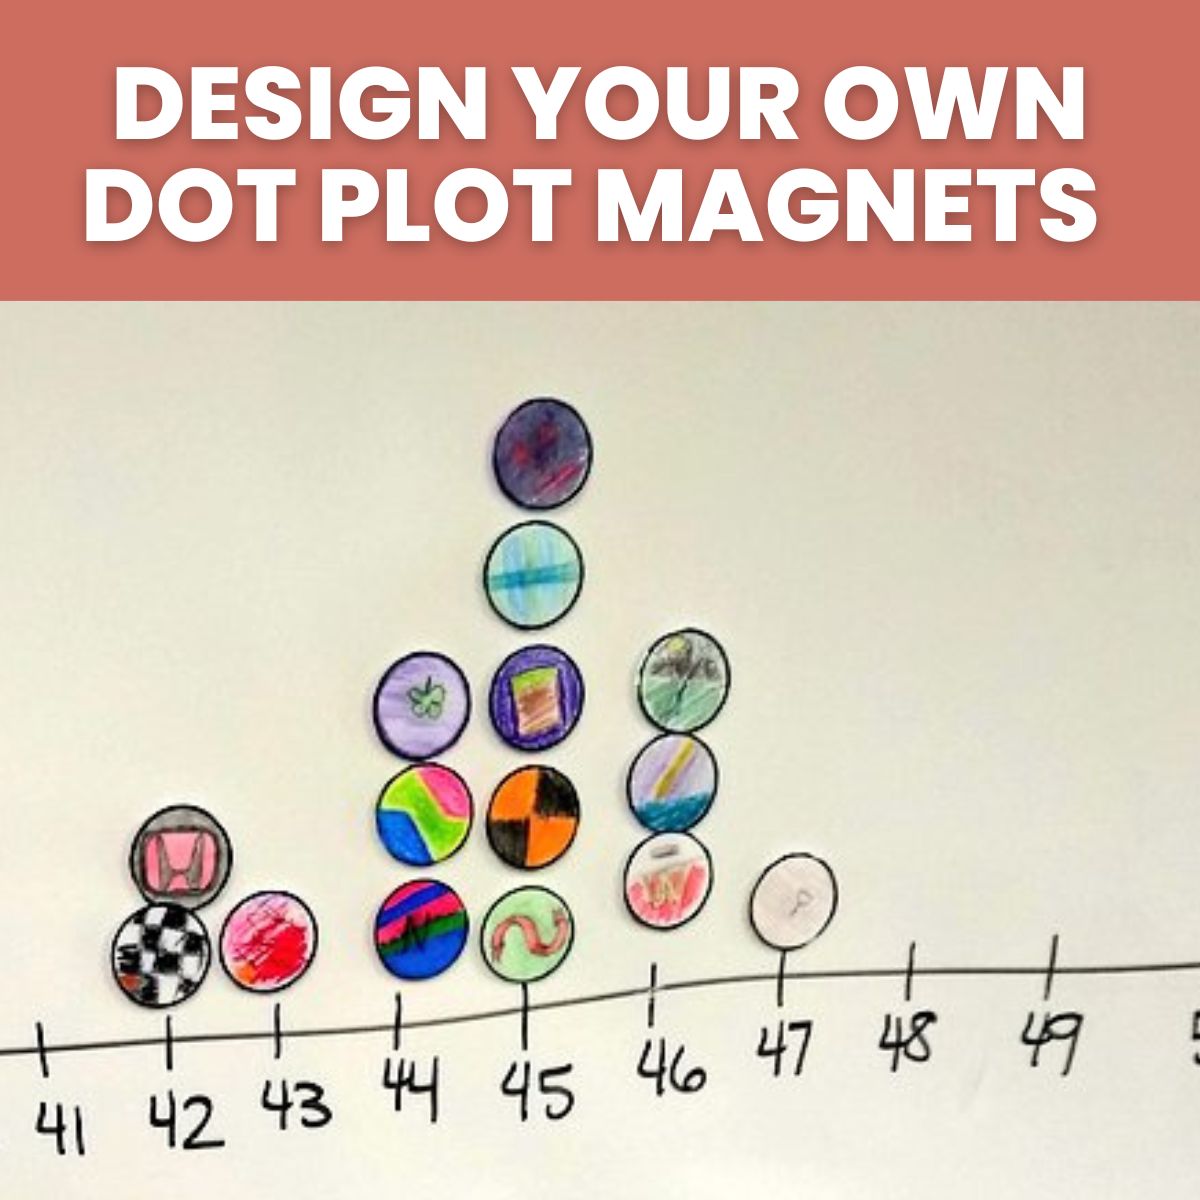
Design Your Own Dot Plot Magnets Activity
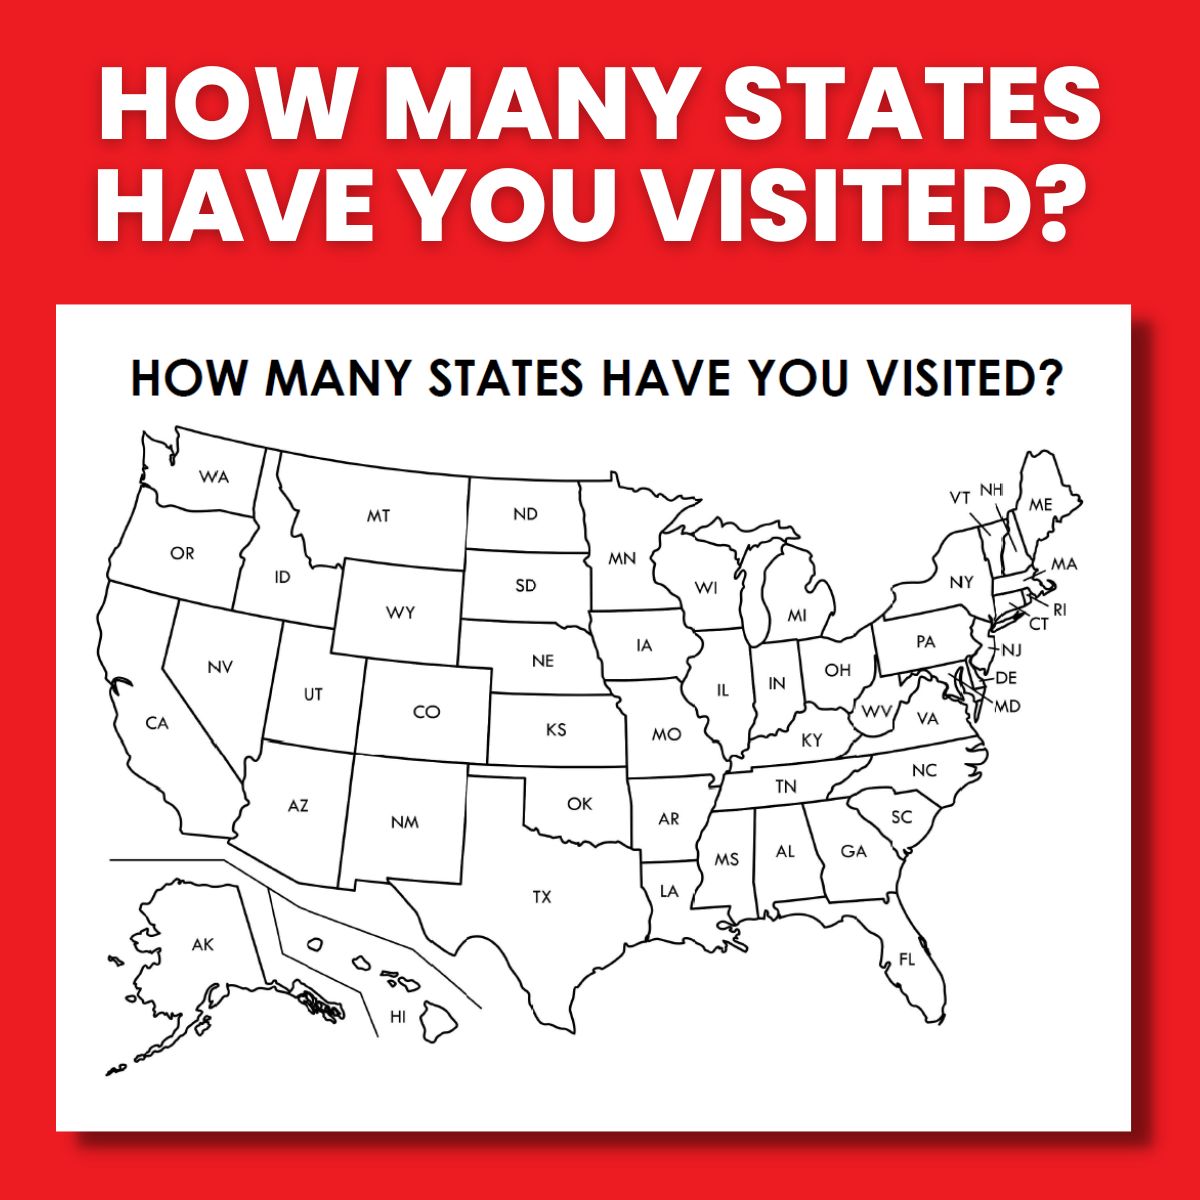
How Many States Have You Visited Map
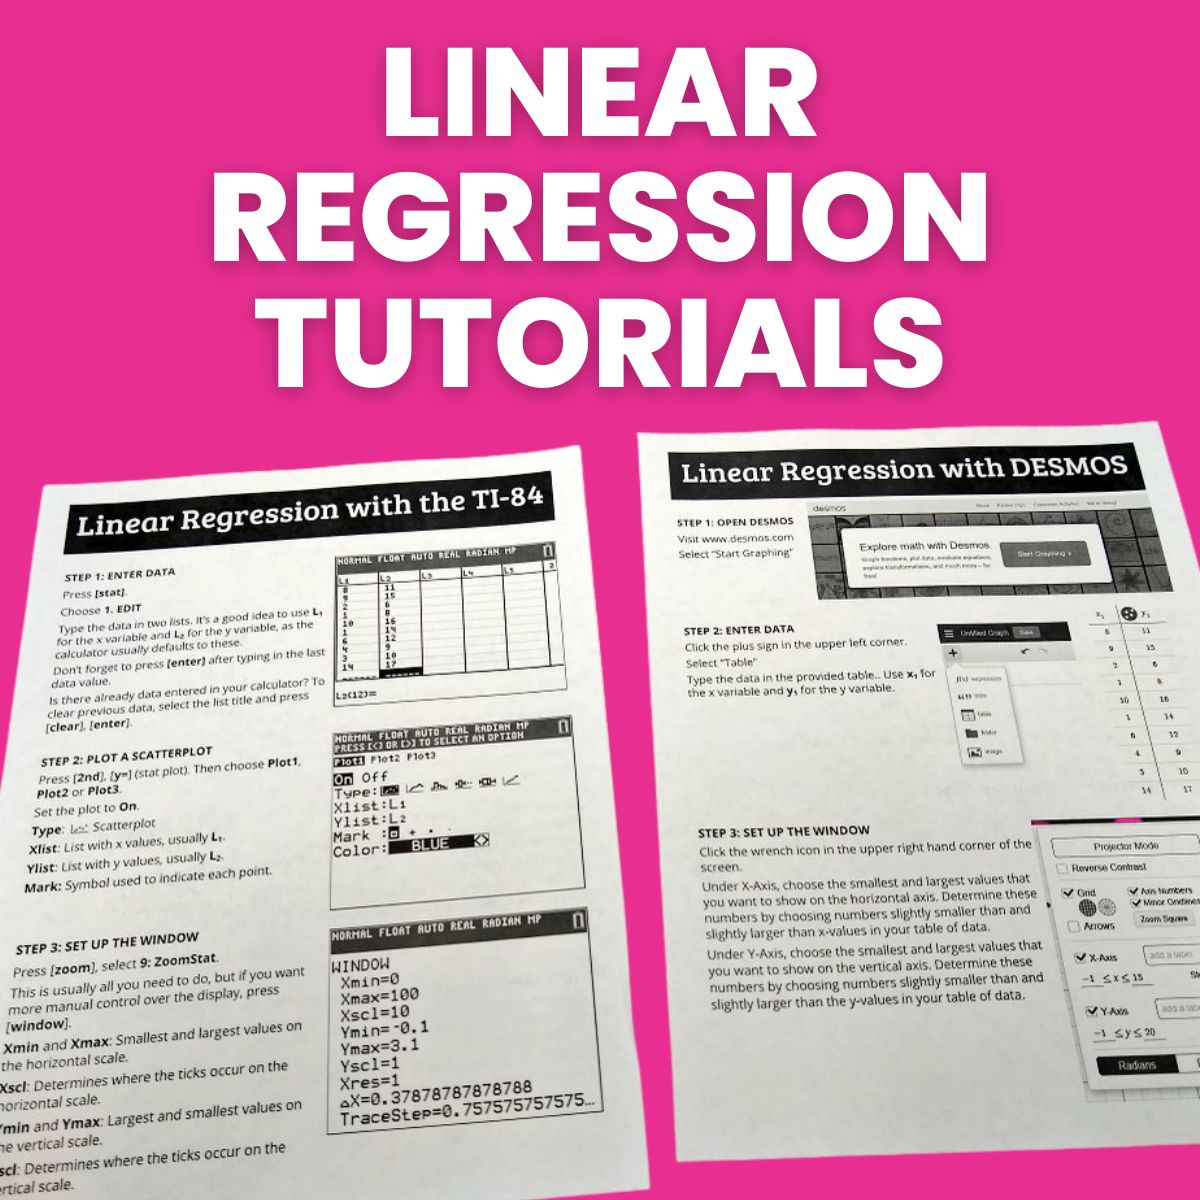
Linear Regression Tutorials
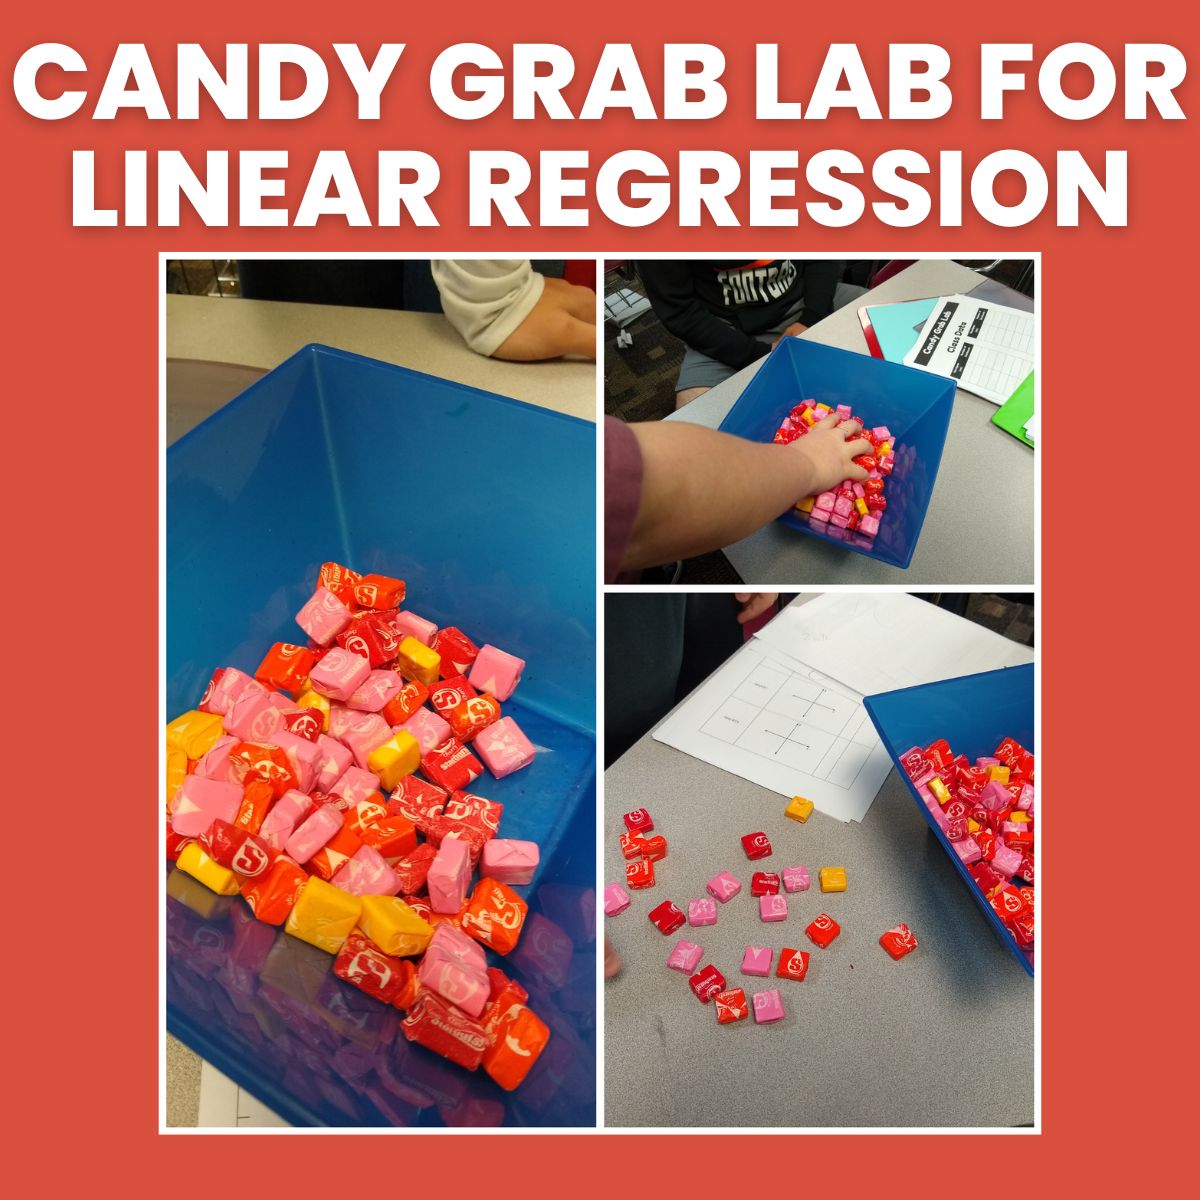
Candy Grab Lab for Linear Regression
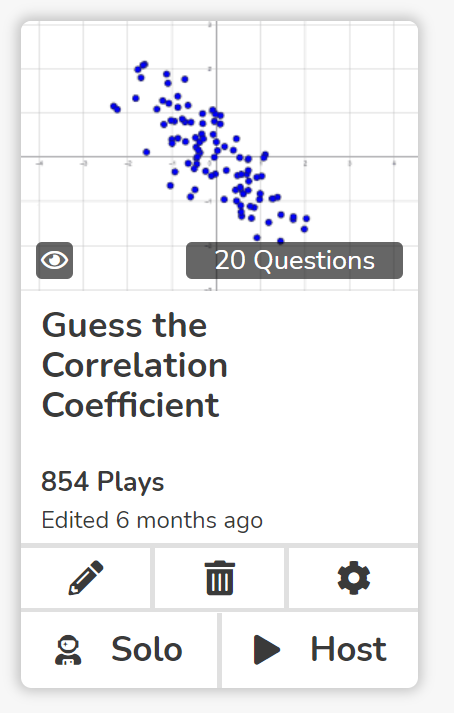
Guess the Correlation Coefficient Blooket Game
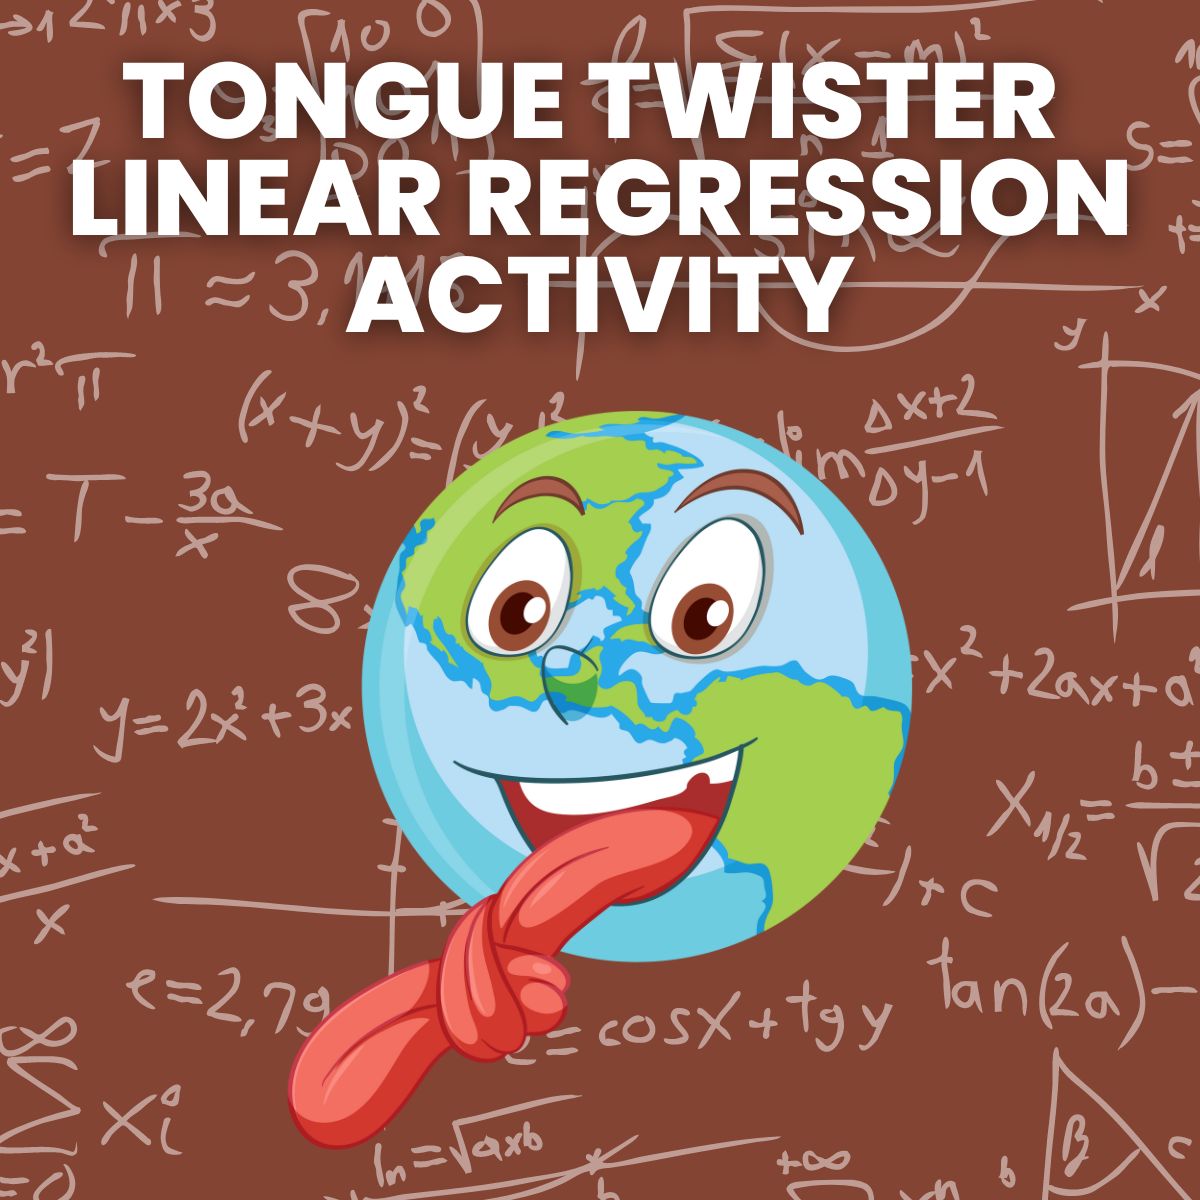
Tongue Twister Linear Regression Activity
Speedy Squares Activity for Quadratic Regression
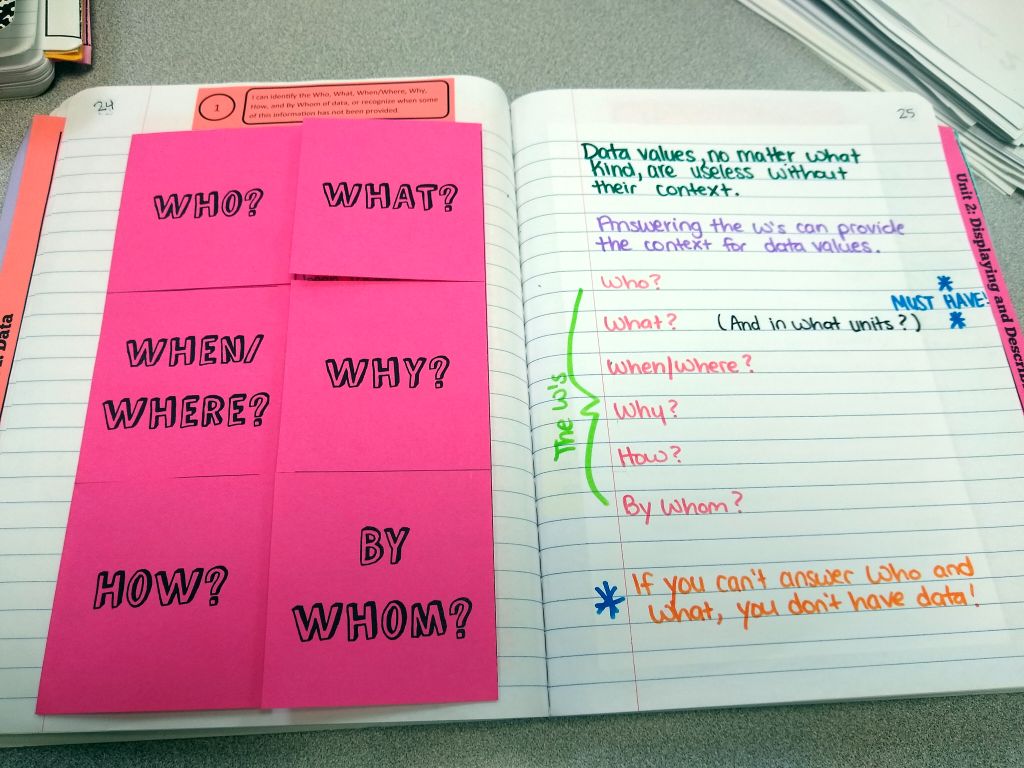
5 W’s and H Foldable for Statistics
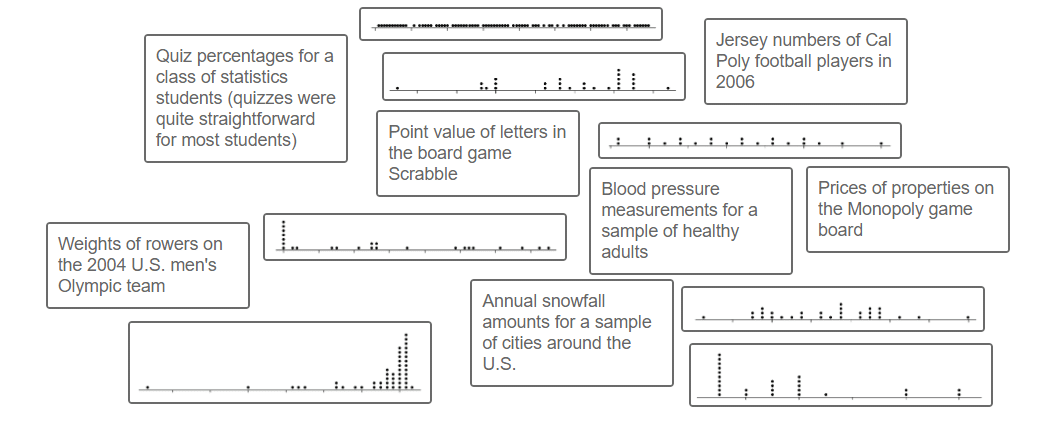
Dotplot Matching – A Desmos Card Sort Activity for Statistics
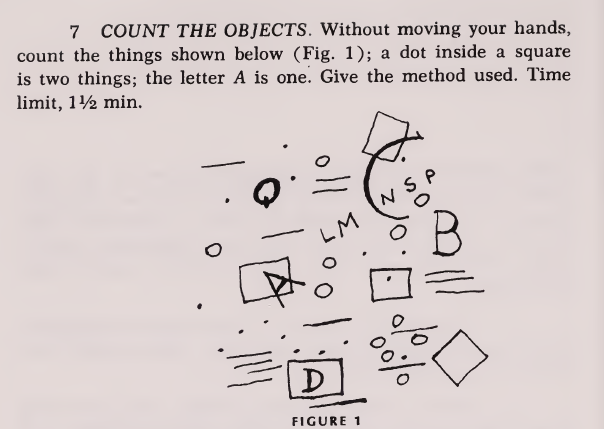
Count the Objects Task for Data Collection
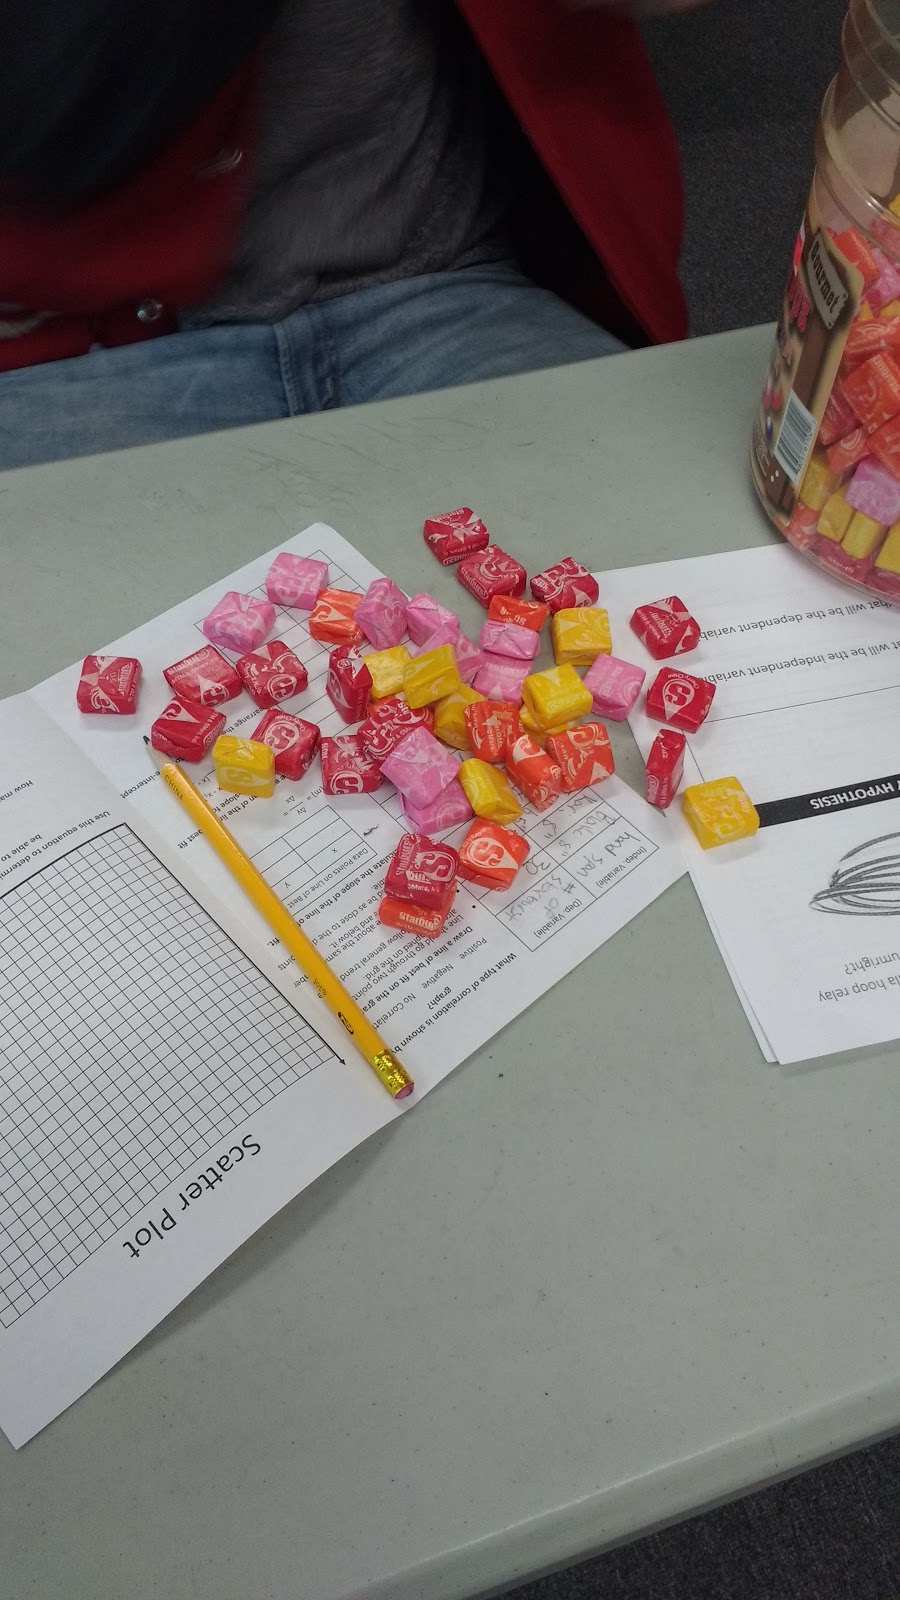
Starburst Scatterplot Activity
Page navigation
1
2
3
Next Page
Next
Scroll to top
Scroll to top
About
Toggle child menu
Expand
About Me
Puzzles
Toggle child menu
Expand
All Printable Puzzles
Math Puzzles
Logic Puzzles
Seasonal and Holiday Puzzles
Word Puzzles
Hands-On Puzzles
Mazes
Puzzle Solutions
Answer Key Database
Resources
Toggle child menu
Expand
Sort by Season or Holiday
Sort by Theme
Sort by Grade Level
Toggle child menu
Expand
Lower Elementary K-2
Upper Elementary 3-5
Middle School 6-8
High School 9-12
Sort by Math Topic
Toggle child menu
Expand
Number & Operations
Algebra & Functions
Geometry & Measurement
Statistics & Probability
Trigonometry
Calculus
Toggle Menu Close
Search for:
Search