Skip to content
Facebook
X
Instagram
Threads
YouTube
Pinterest
Email
Trending Resource
:
40+ Ideas for the First Week of School
About
Expand
About Me
Puzzles
Expand
All Printable Puzzles
Math Puzzles
Logic Puzzles
Seasonal and Holiday Puzzles
Word Puzzles
Hands-On Puzzles
Mazes
Puzzle Solutions
Answer Key Database
Resources
Expand
Sort by Season or Holiday
Sort by Theme
Sort by Grade Level
Expand
Lower Elementary K-2
Upper Elementary 3-5
Middle School 6-8
High School 9-12
Sort by Math Topic
Expand
Number & Operations
Algebra & Functions
Geometry & Measurement
Statistics & Probability
Trigonometry
Calculus
SEARCH
Search
Facebook
X
Instagram
YouTube
Toggle Menu
SEARCH
Search
Home
»
Statistics
»
Page 3
Statistics
Graphs In The News Statistics Foldable
Boxplot and Histogram Card Sort Activity
Kentucky Derby Winning Times
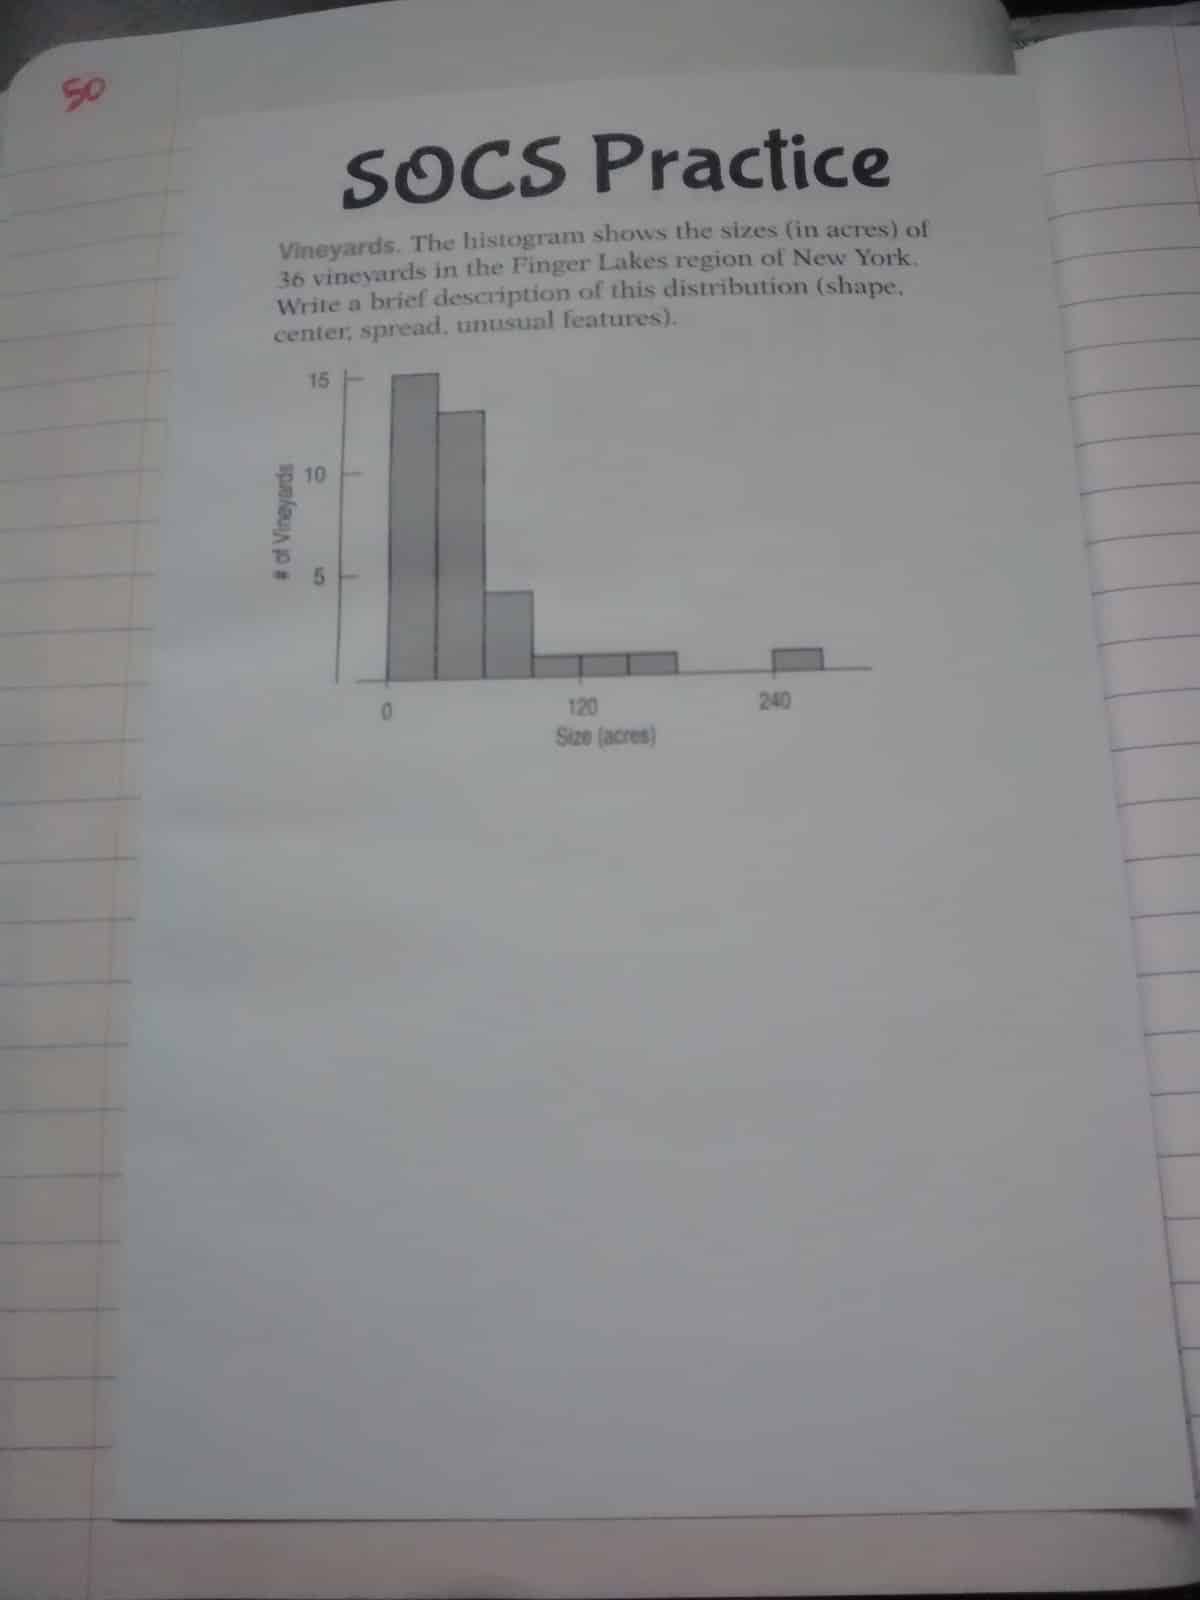
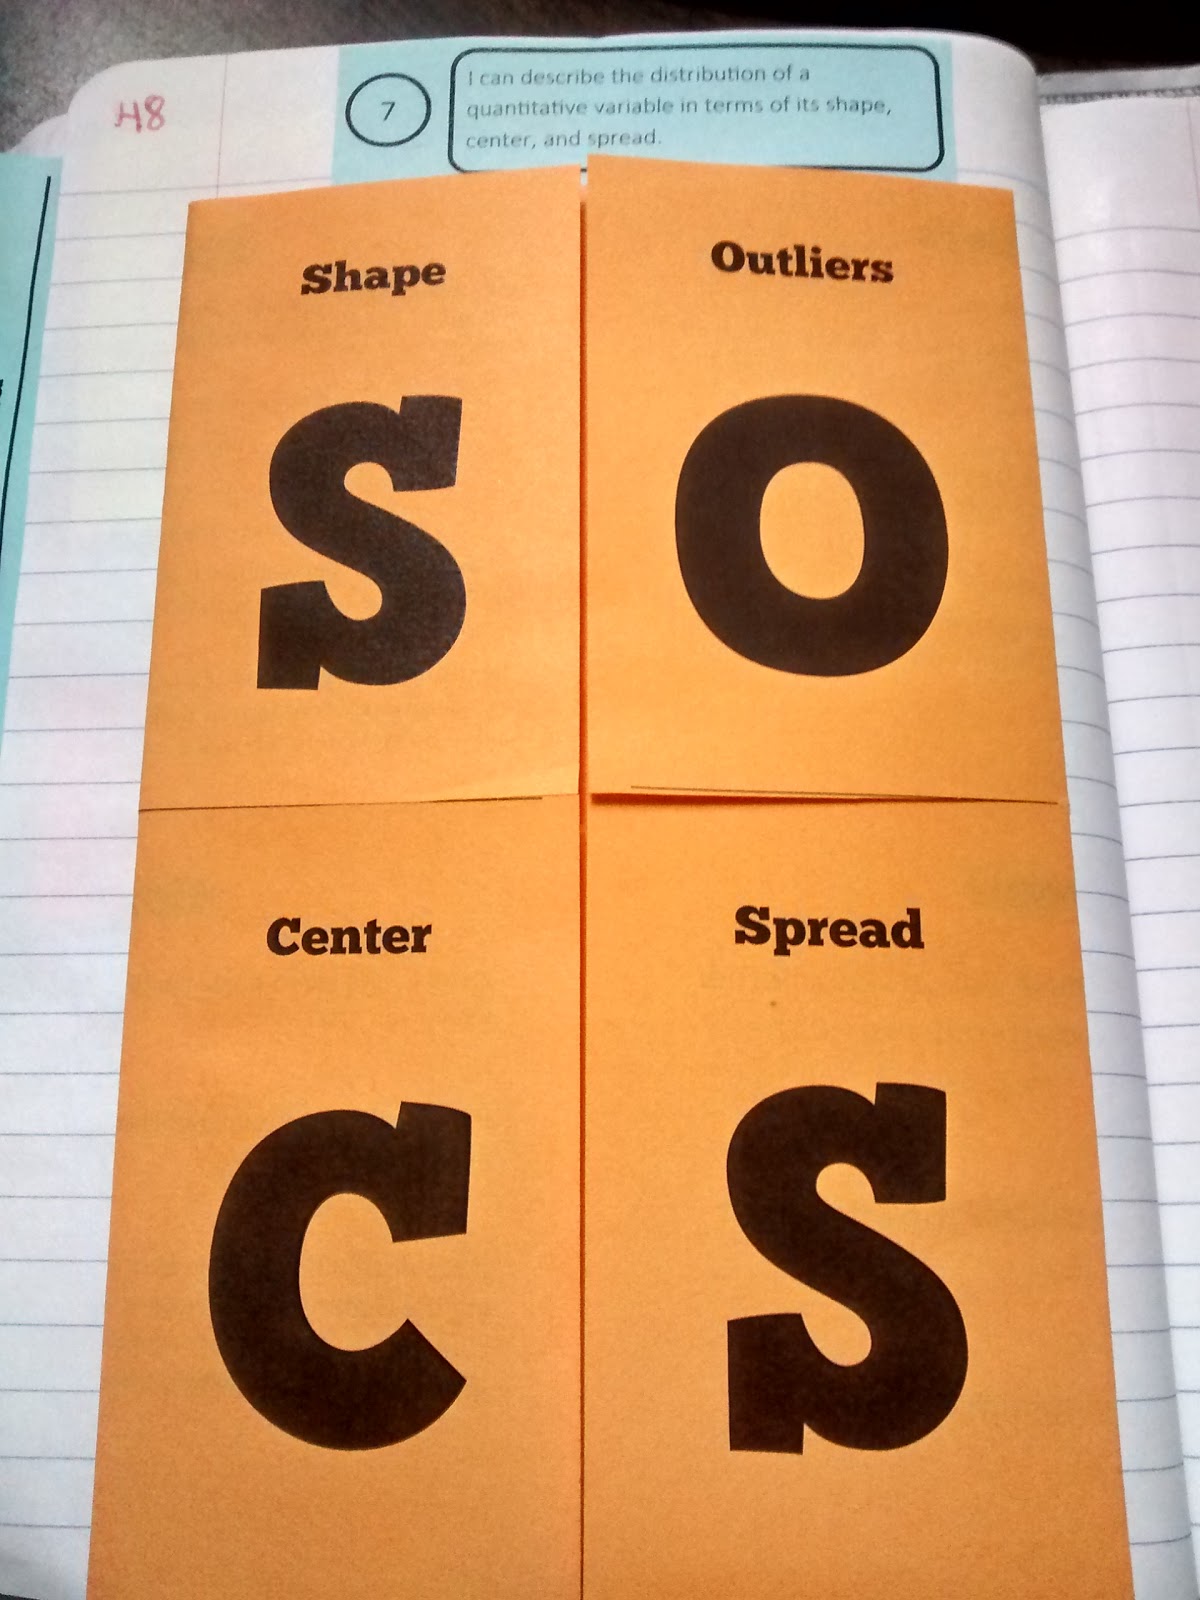
SOCS Practice Foldable
SOCS Foldable for Statistics
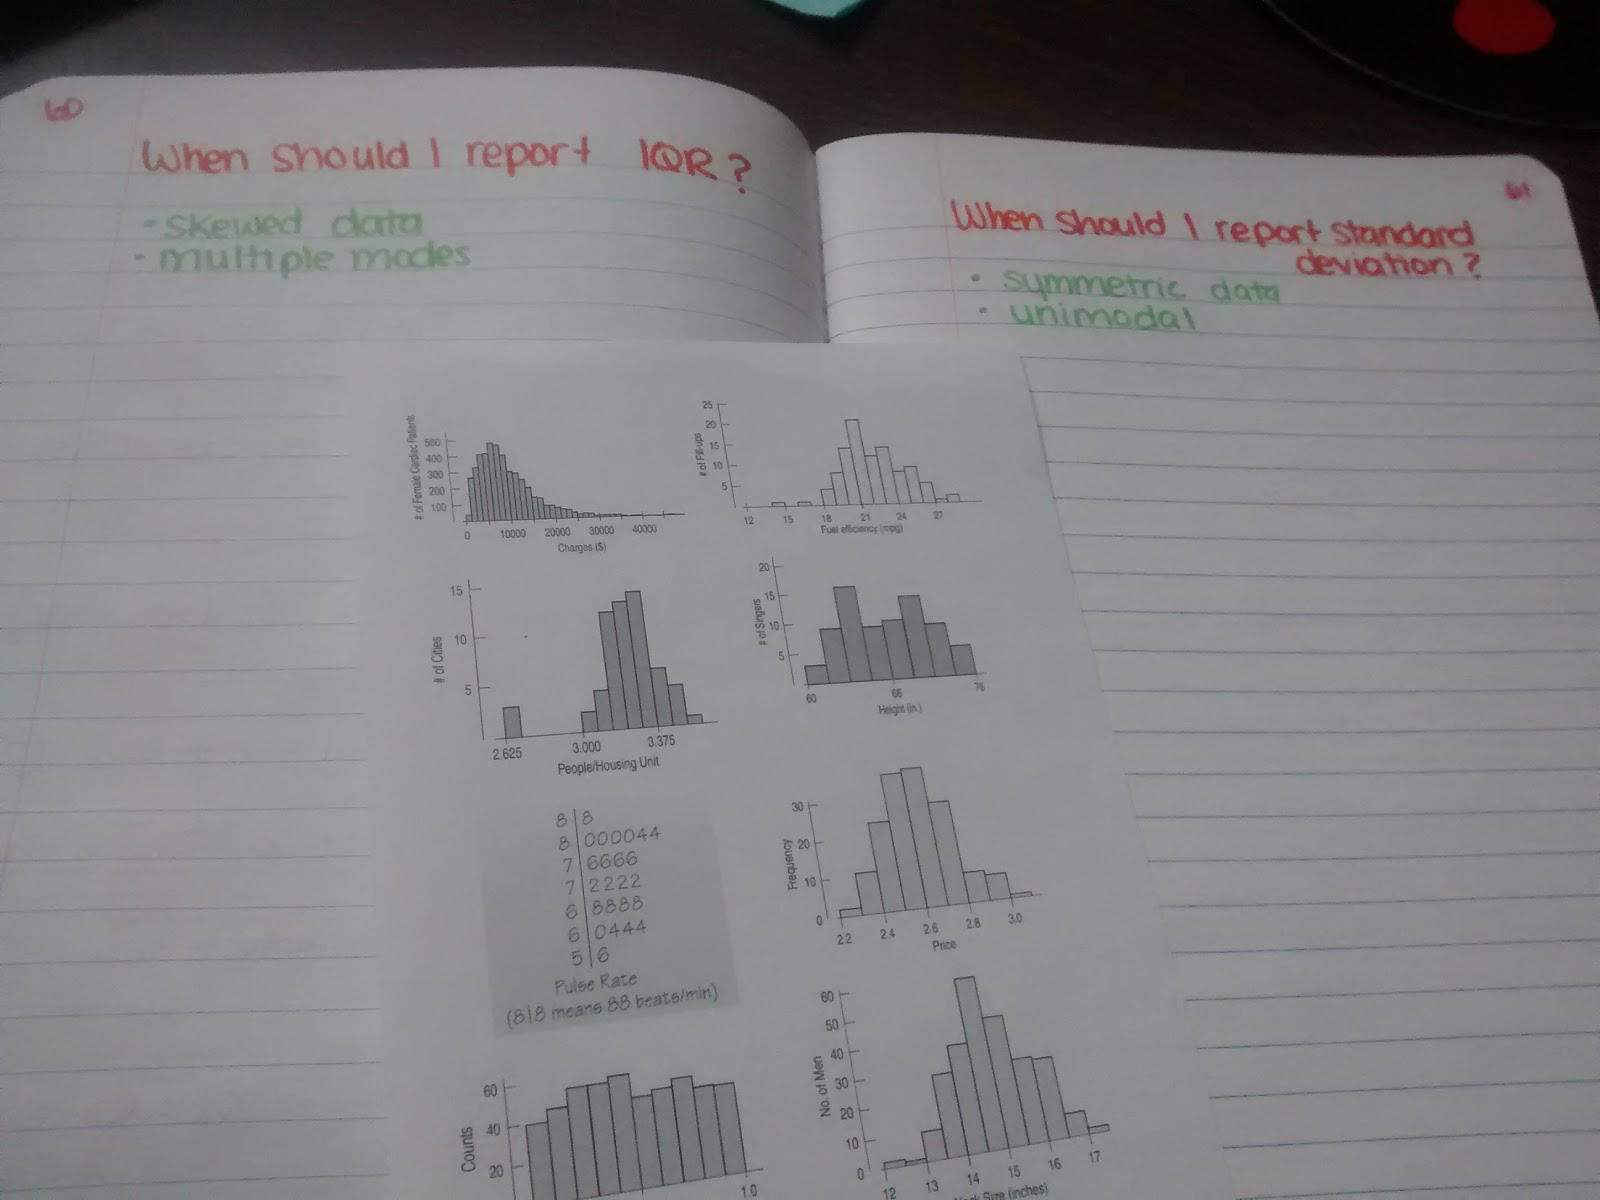
IQR vs Standard Deviation Card Sort Activity
5 Number Summary 5 Finger Summary
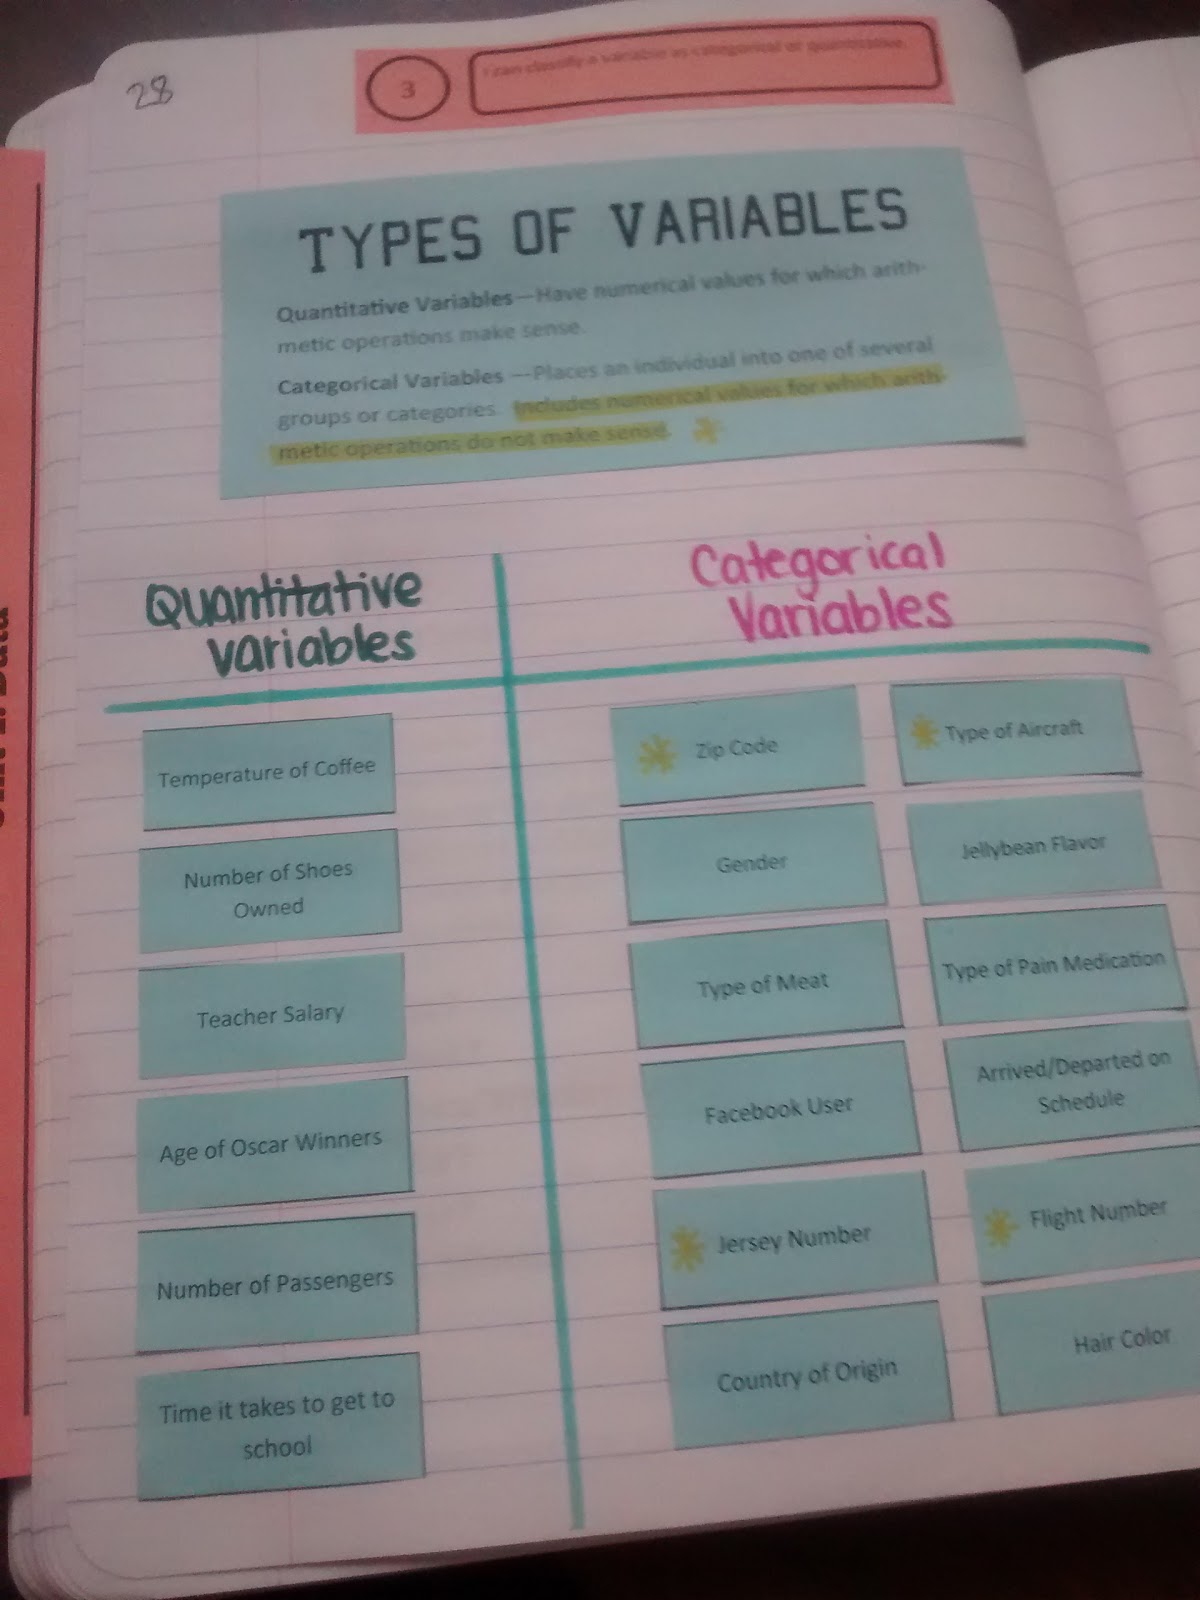
Categorical vs Quantitative Variables Card Sort Activity
The Paragraph Function – An Activity for Modeling Rational Functions
The Constant Chair Regression Activity
Normal Distribution Question Stack Activity
Statistics: Confidence Interval Projects
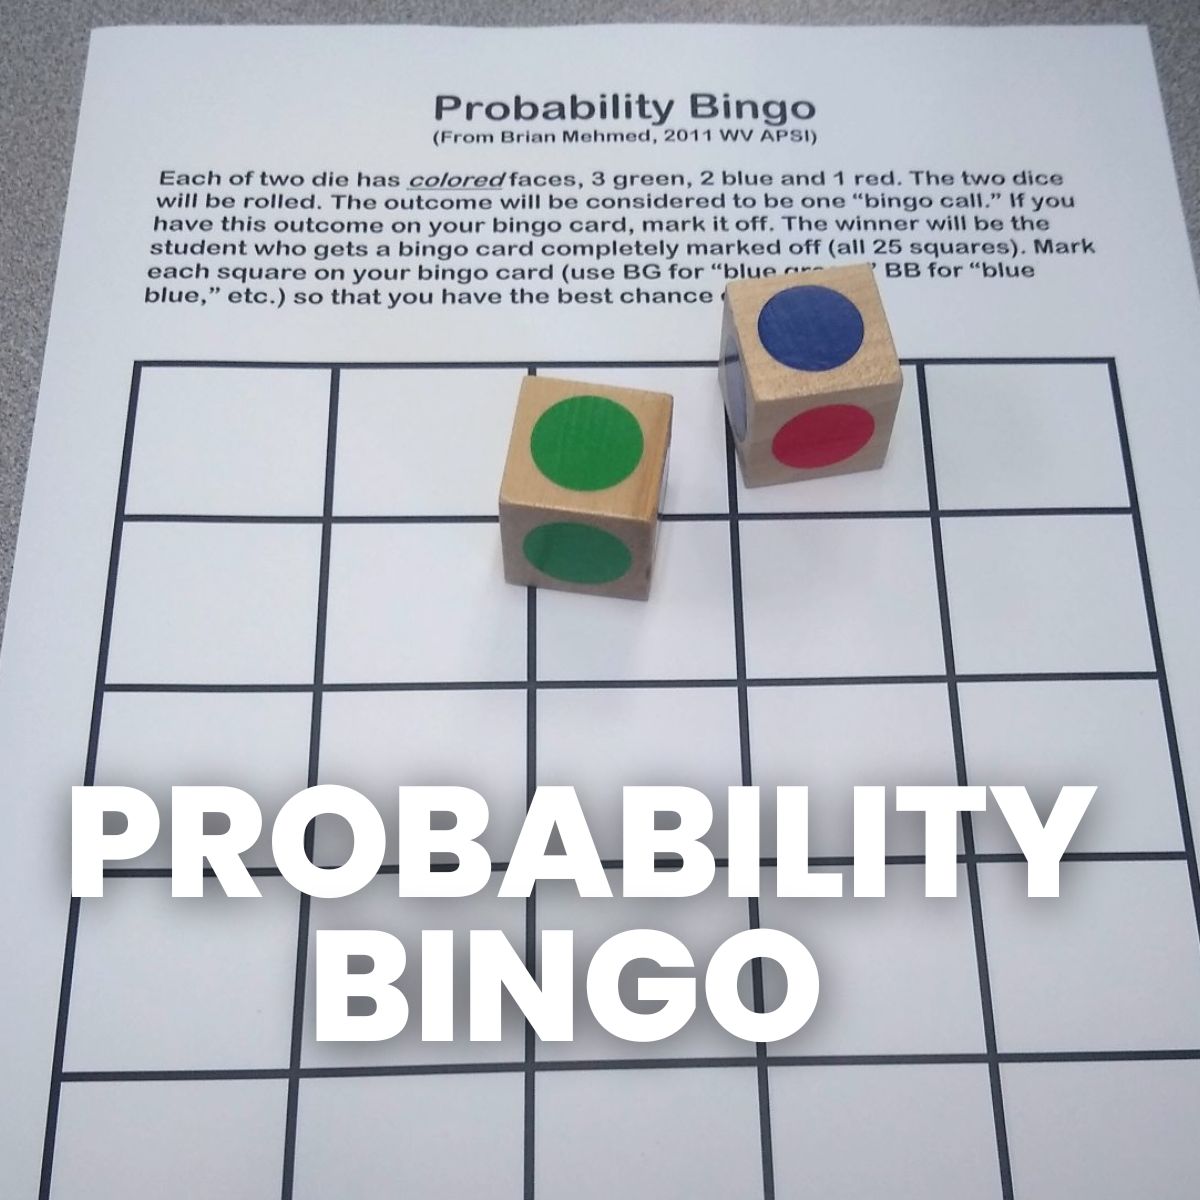
Probability Bingo Game
Stats Response Bias Project
Russian Fable for Marriage Probability Activity
Probability Activity with Cuboctahedrons
Gummy Bear Catapults
Paper Airplane Lab
Twizzlers Linear Regression Lab Activity
Bouncing Tennis Balls Linear Regression Lab
Linear Regression Activity with the True Colors Personality Test
Fun and Hands-On Linear Regression Activities
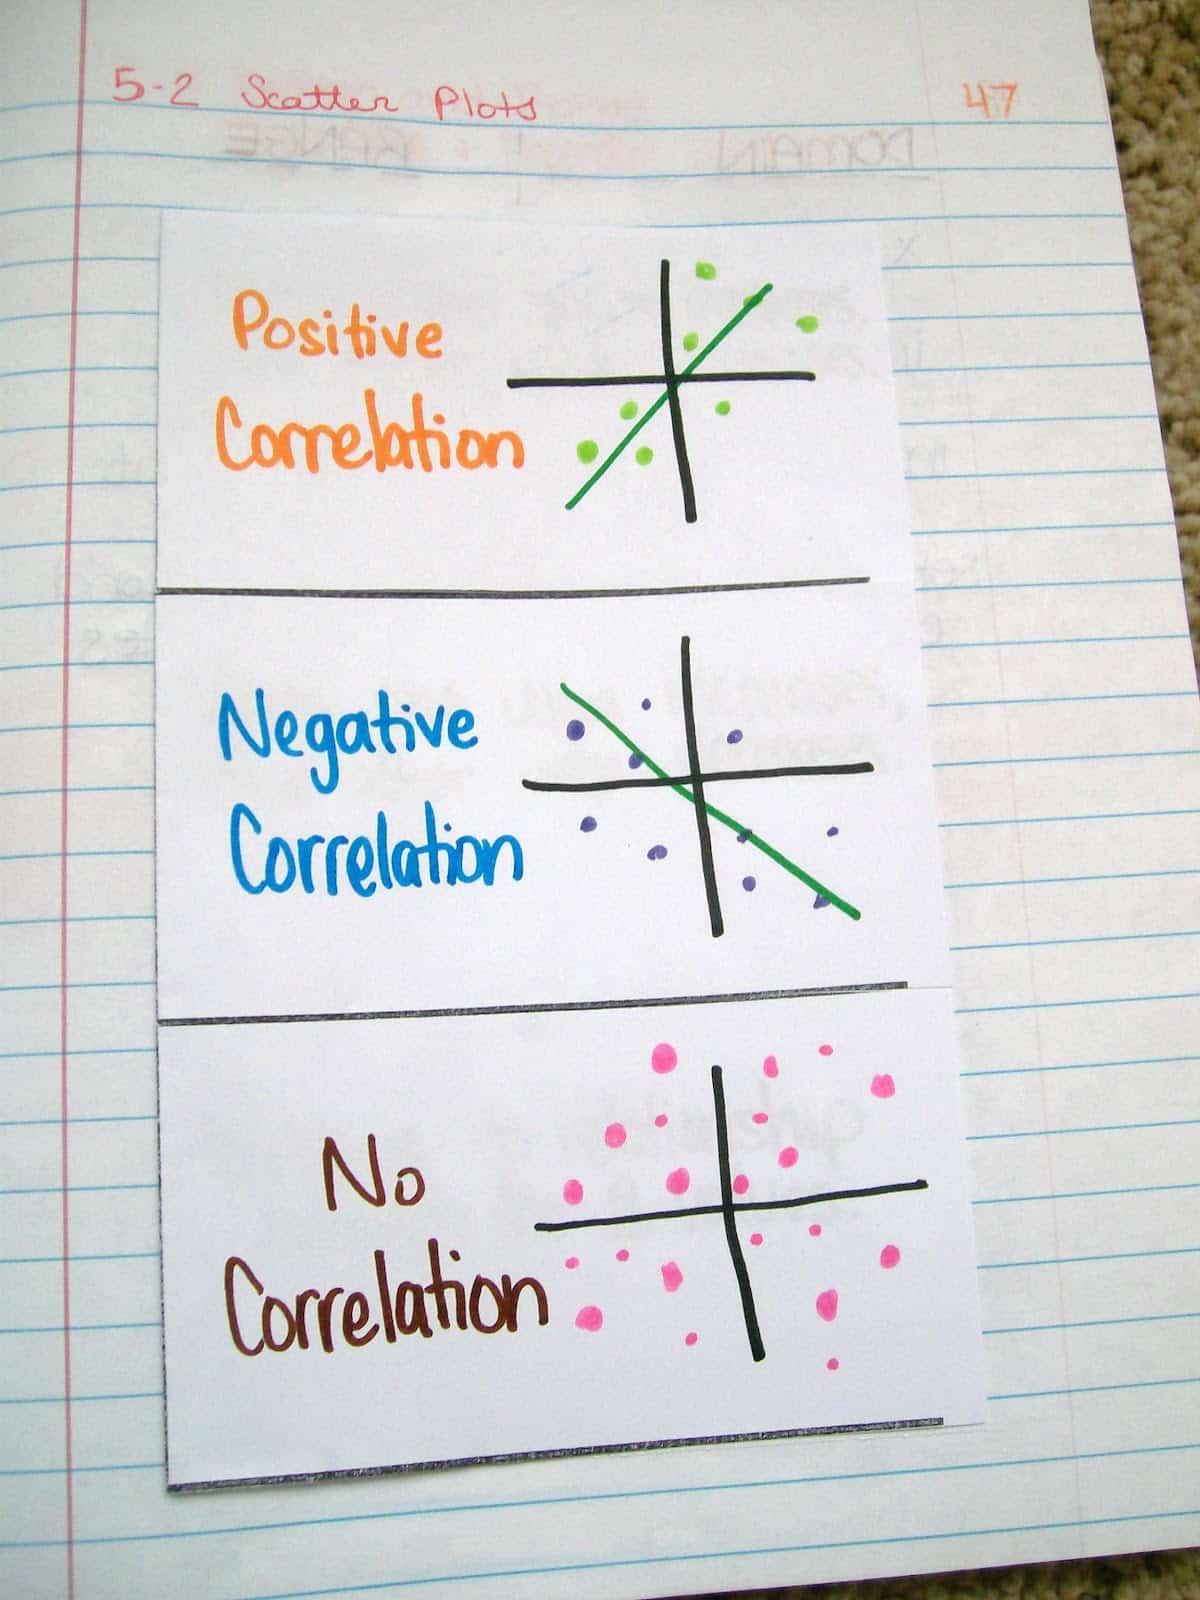
Types of Correlation Foldable
Teaching Probability with Deal or No Deal
Greedy Pig Dice Game for Practicing Probability
Probability Game
M&M’s Scatter Plots Activity
Page navigation
Previous Page
Previous
1
2
3
Scroll to top
Scroll to top
About
Toggle child menu
Expand
About Me
Puzzles
Toggle child menu
Expand
All Printable Puzzles
Math Puzzles
Logic Puzzles
Seasonal and Holiday Puzzles
Word Puzzles
Hands-On Puzzles
Mazes
Puzzle Solutions
Answer Key Database
Resources
Toggle child menu
Expand
Sort by Season or Holiday
Sort by Theme
Sort by Grade Level
Toggle child menu
Expand
Lower Elementary K-2
Upper Elementary 3-5
Middle School 6-8
High School 9-12
Sort by Math Topic
Toggle child menu
Expand
Number & Operations
Algebra & Functions
Geometry & Measurement
Statistics & Probability
Trigonometry
Calculus
Toggle Menu Close
Search for:
Search