M&M’s Scatter Plots Activity
Last week in Algebra 1, we completed a scatter plots activity with m&m’s.
Goals for this scatter plots activity:
- Be able to define what a scatter plot is
- Be able to find a line of best fit
- Be able to recognize positive correlation, negative correlation, and no correlation
- Review positive and negative slope
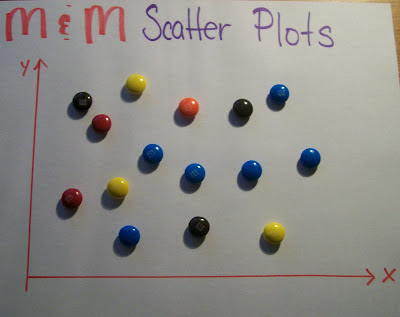
First the students were given a sheet of graph paper and a handful of M&M’s. After drawing an x- and y-axis, I had the students scatter their candy over the graph. Jumping straight into vocabulary, we talked about how the scatter plot had no correlation.
Using the Creative Pen on the Smart Board (set on smiley faces–it was the closest thing I could find to M&M’s), I created a sample scatter plot. Several students took turns coming up to the Smart Board and drawing a line of best fit. Building upon the students’ discussion about how we could draw lines going all different ways, I introduced the idea of no correlation.
Then, I modeled positive correlation on the Smart Board using the Creative Pen again. After a student came up and drew a line of best fit, we discussed that the line of best fit would have a positive slope. (Slope is one of the most-tested topics on the state testing in April. Thus, we are taking any and every opportunity to review slope!)
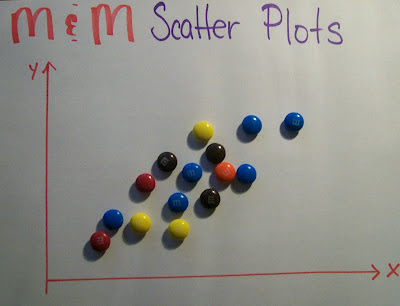
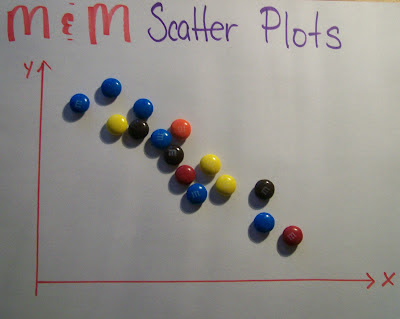
Students then worked with their M&M’s to construct scatter plots with positive and negative correlations. To check their understanding at the end of the lesson, each student chose one of the three possible types of correlation and rearranged their M&M’s to reflect that correlation. Then, as a class, we looked at the scatter plots of several students to see if we could figure out what correlation they had created.
After having each student write what they had learned about positive, negative, and no correlation as an exit ticket, the students finally got to eat their M&M’s.
Hi,
Great Lesson. A friend of mine, also a practicing teacher, did a similar lesson to this with his Grade 7 math class for a supervised lesson. He was worried the class was going to descend into chaos, but it ended up working out well for him.
I love this idea!! Thank you so much for sharing this! I pinned it so I remember it for next year.
☼Kate
To The Square Inch
I am planning on doing this lesson today with my 6th graders.
Thanks for sharing.
Jamie
I passed out the M&M's and 6 out of 8 of my Algebra I students immediately started sorting them by color! I thought it was so funny, and they were so disappointed when I told them that color had nothing to do with today's lesson. They also had a hard time scattering the M&M's. They kept wanting to line them up. I think my whole Algebra I class is just a little bit OCD. haha!
I love this lesson. I used it today in my 8th grade Algebra class. I created a Power Point presentation that incorporated some of your points but opened with a slide of a scatter plot that showed how the number of followers on Twitter of some athletes/celebrities was positively correlated to the amount of money they received to endorse a product with a tweet. The students were engaged from the beginning. Thanks for sharing!
Brilliant idea!