SOCS Foldable for Statistics
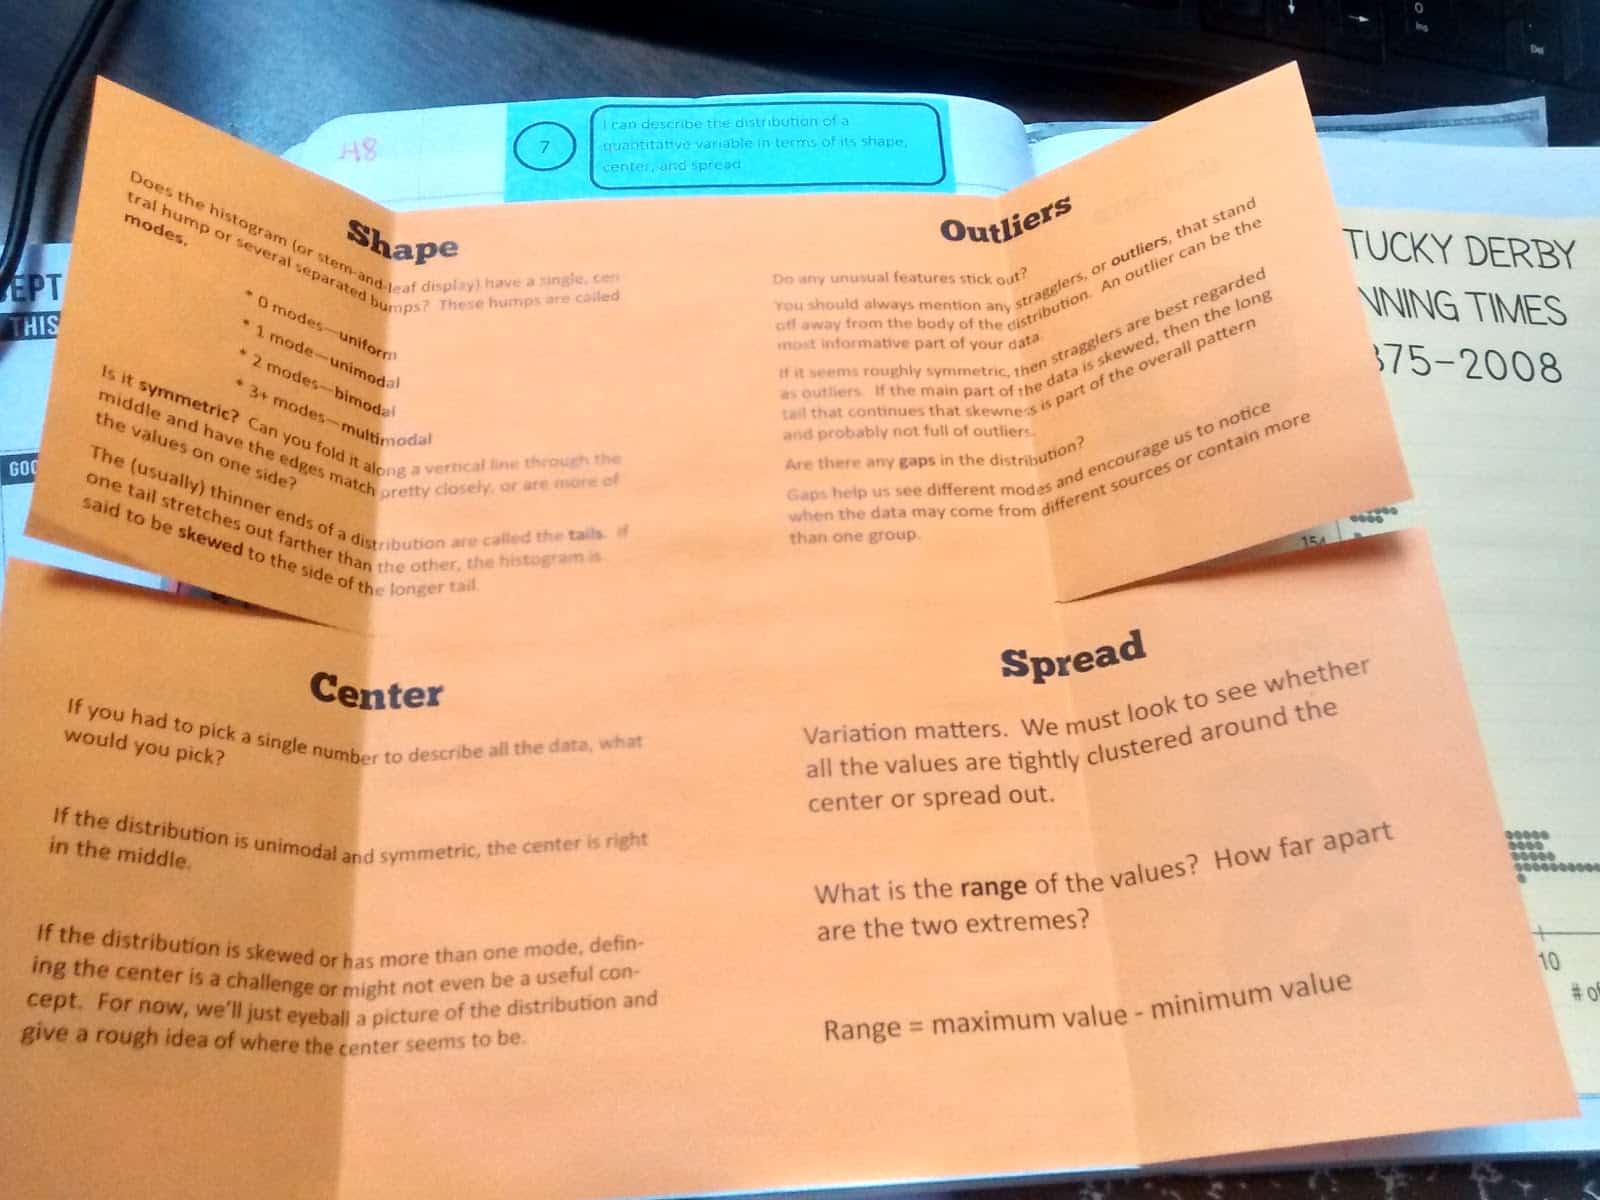
I’m pretty happy with how this SOCS foldable turned out that I created for my stats class. We’re practicing identifying the shape, outliers, center, and spread of a quantitative variable.
I stole the SOCS mnemonic from @druinok. Actually, I steal most of my stats ideas from her. She’s been an absolute lifesaver this year!
I typed up a quick socs foldable to give my students to keep in their interactive notebooks. My stats students are the slowest writers in the world. I learned this the hard way. So, I’ve been typing everything I can for them.
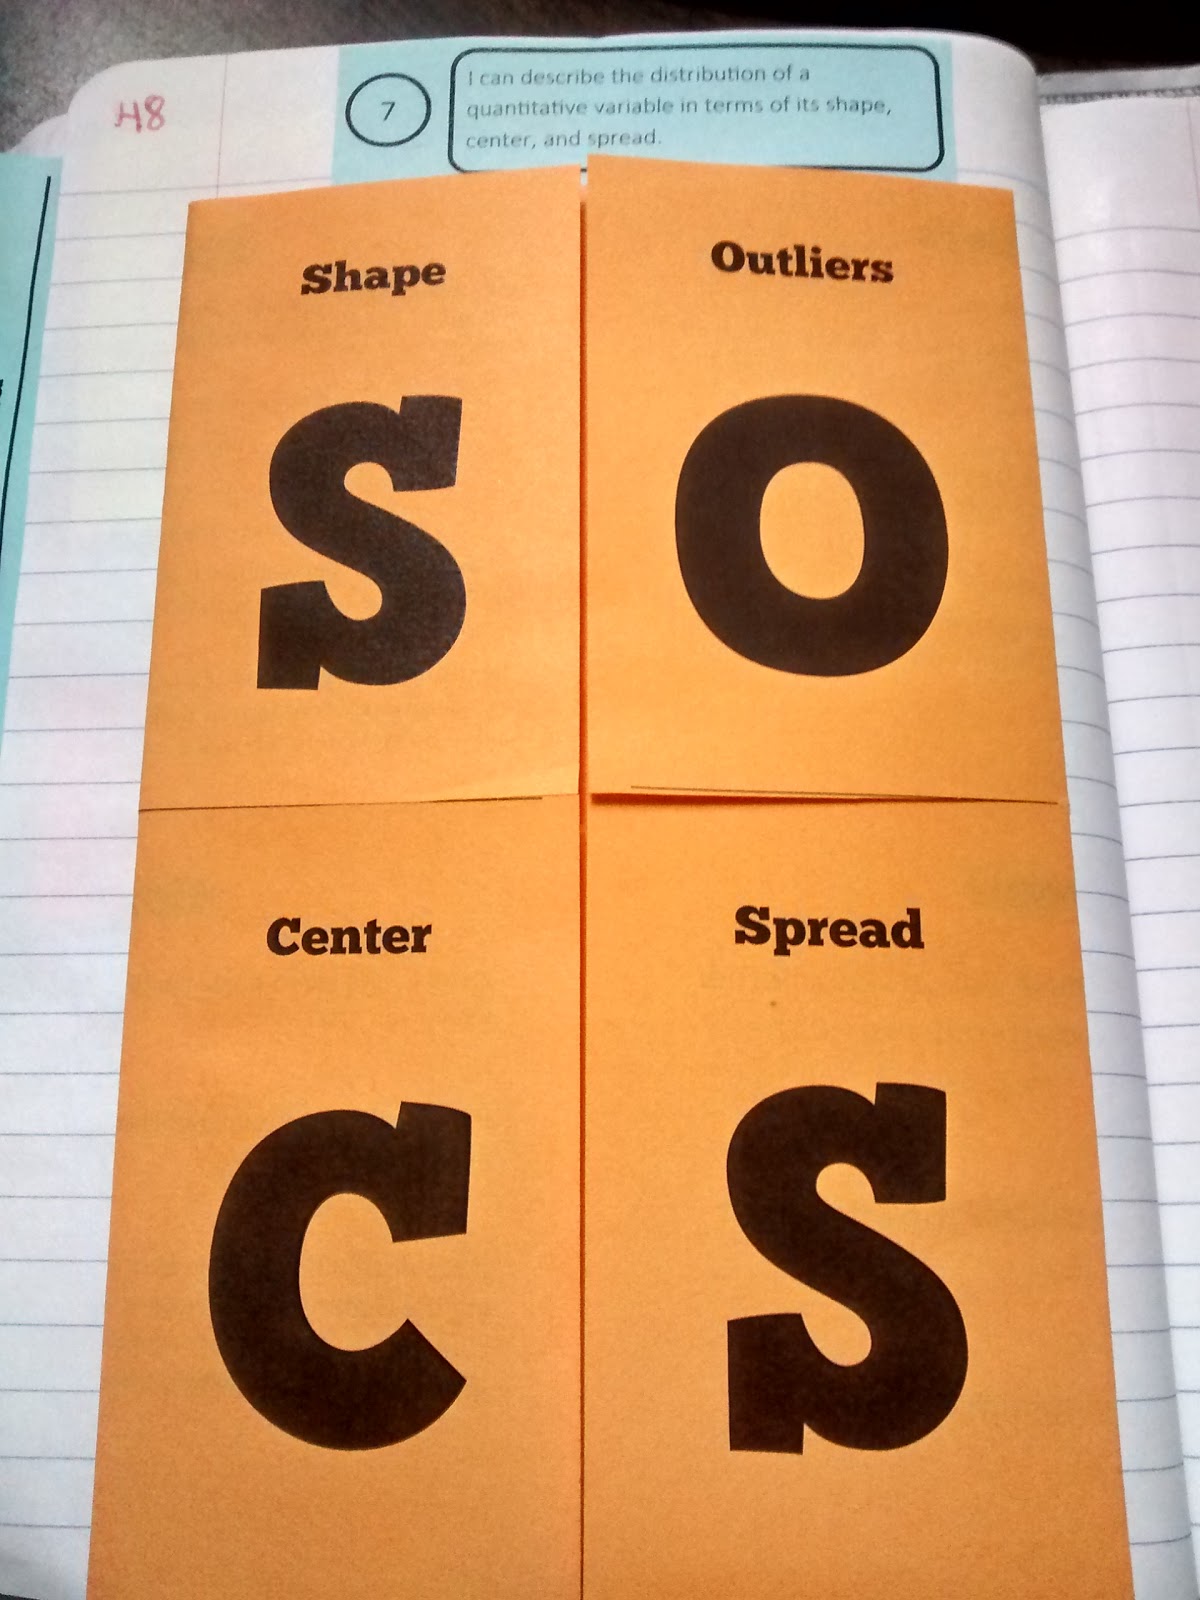
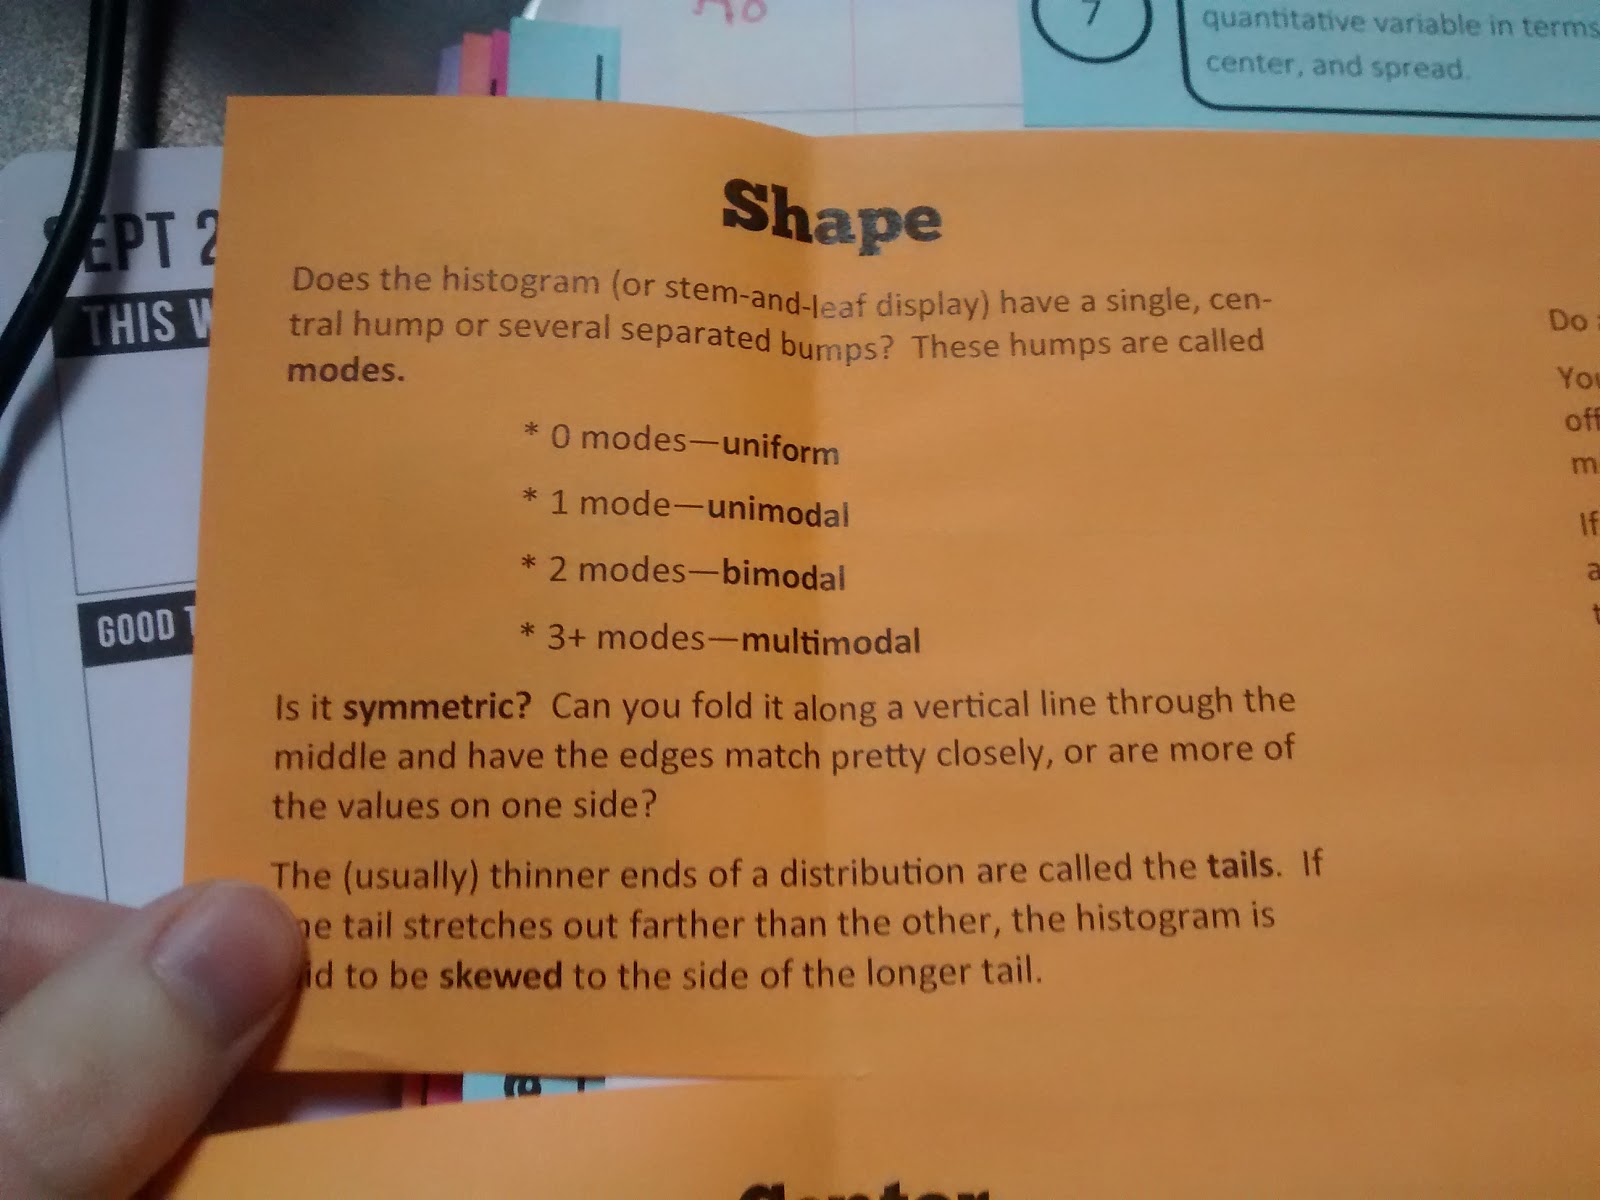
Shape
Does the histogram (or stem-and-leaf display) have a single, central hum or several separated bumps? These bumps are called modes.
- 0 modes – uniform
- 1 mode – unimodal
- 2 modes – bimodal
- 3+ modes – multimodal
Is it symmetric? Can you fold it along a vertical line through the middle and have the edges match pretty closely, or are more of the values on one side?
The (usually) thinner ends of a distribution are called the tails. If one tail stretches out farther than the other, the histogram is said to be skewed to the side of the longer tail.
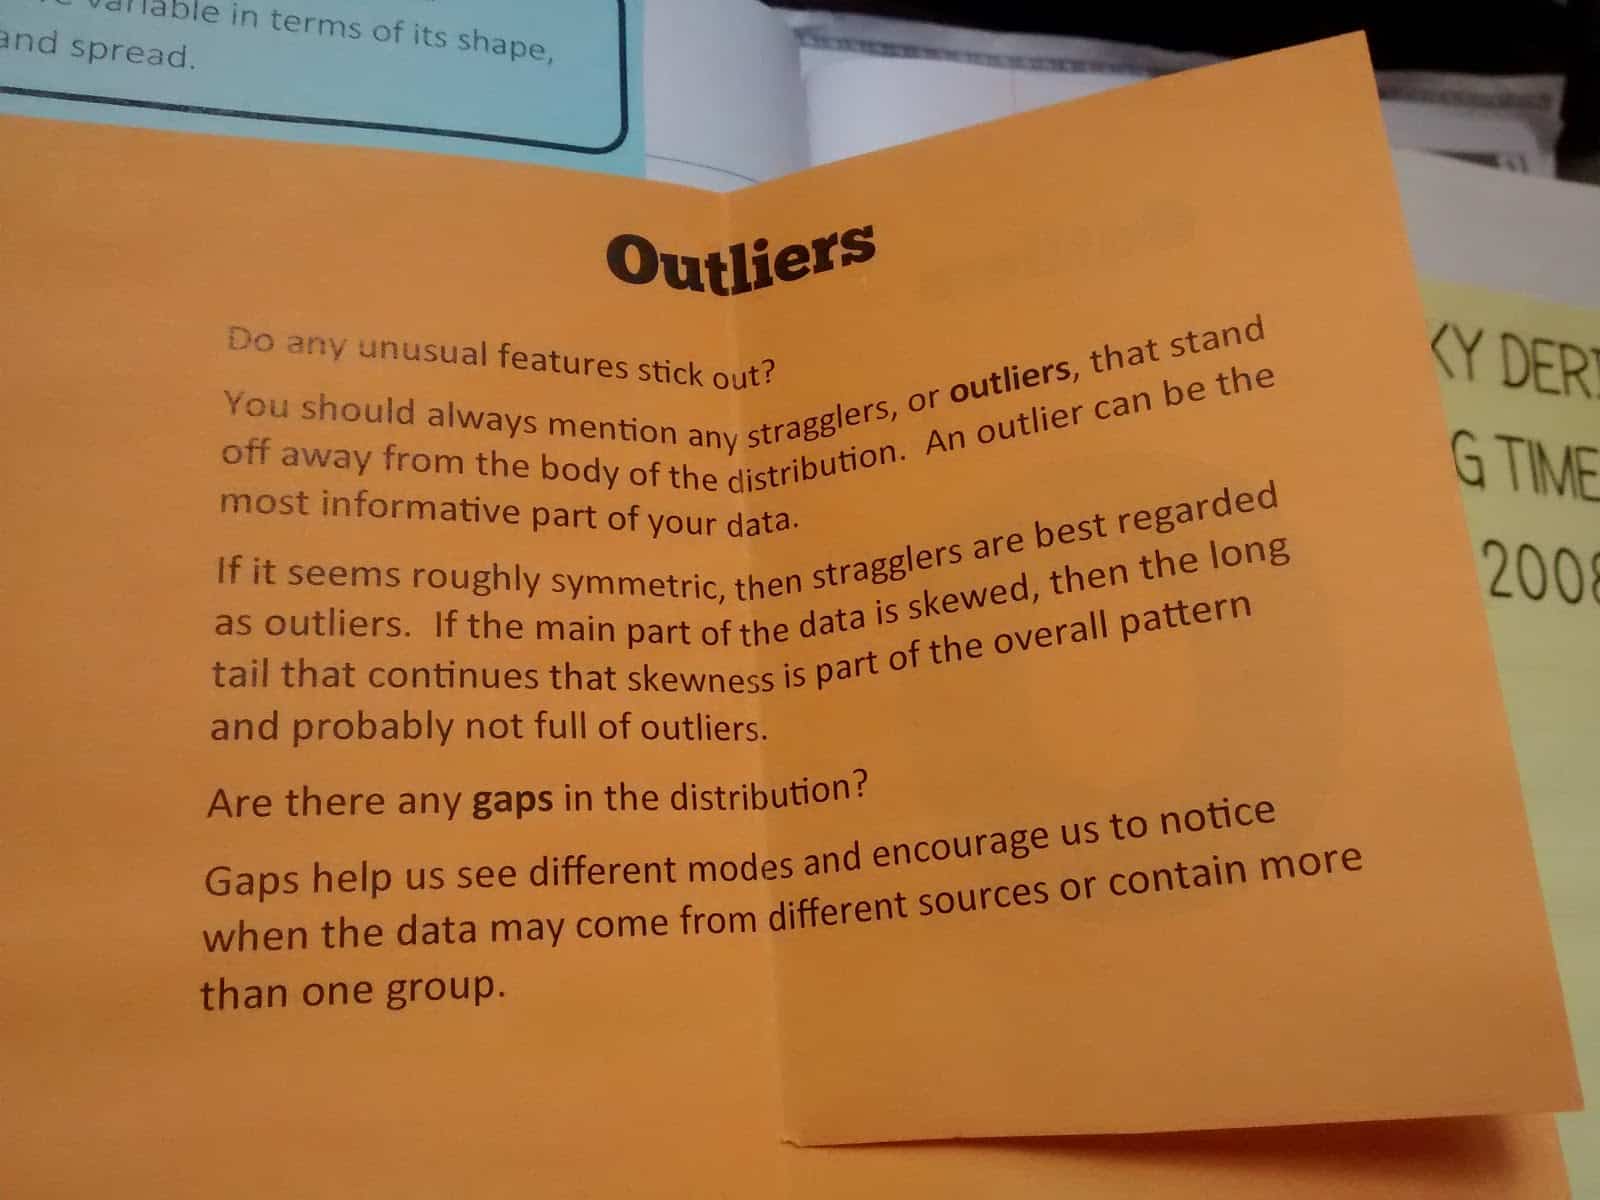
Outliers
Do any unusual features stick out?
You should always mention any stragglers, or outliers, that stand off away from the body of the distribution. An outlier can be the most informative part of your data.
If it seems roughly symmetric, then stragglers are best regarded as outliers. If the main part of the data is skewed, then the long tail that continues that skewness is part of the overall pattern and probably not full of outliers.
Are there any gaps in the distribution?
Gaps help us see different modes and encourage us to notice when the data may come from different sources or contain more than one group.
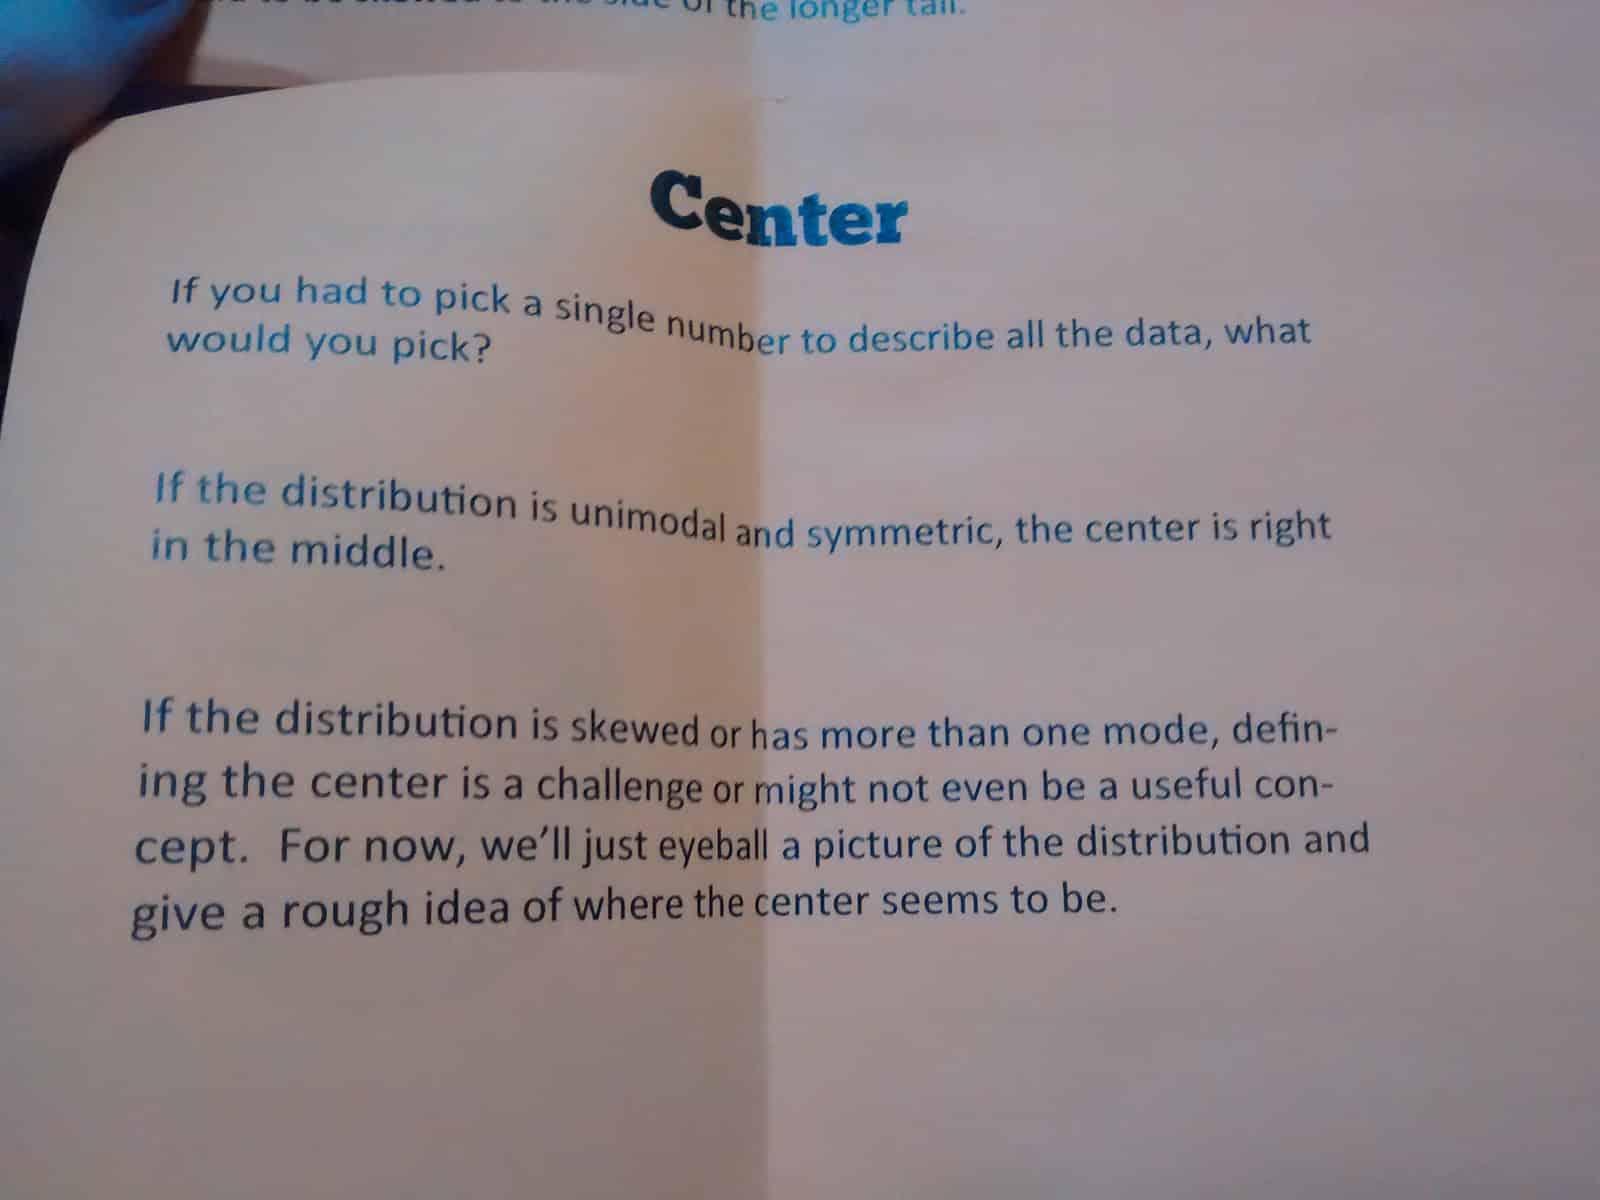
Center
If you had to pick a single number to describe all the data, what would you pick?
If the distribution is unimodal and symmetric, the center is right in the middle.
If the distribution is skewed or has more than one mode, defining the center is a challenge or might not even be a useful concept. For now, we’ll just eyeball a picture of the distribution and give a rough idea of where the center seems to be.
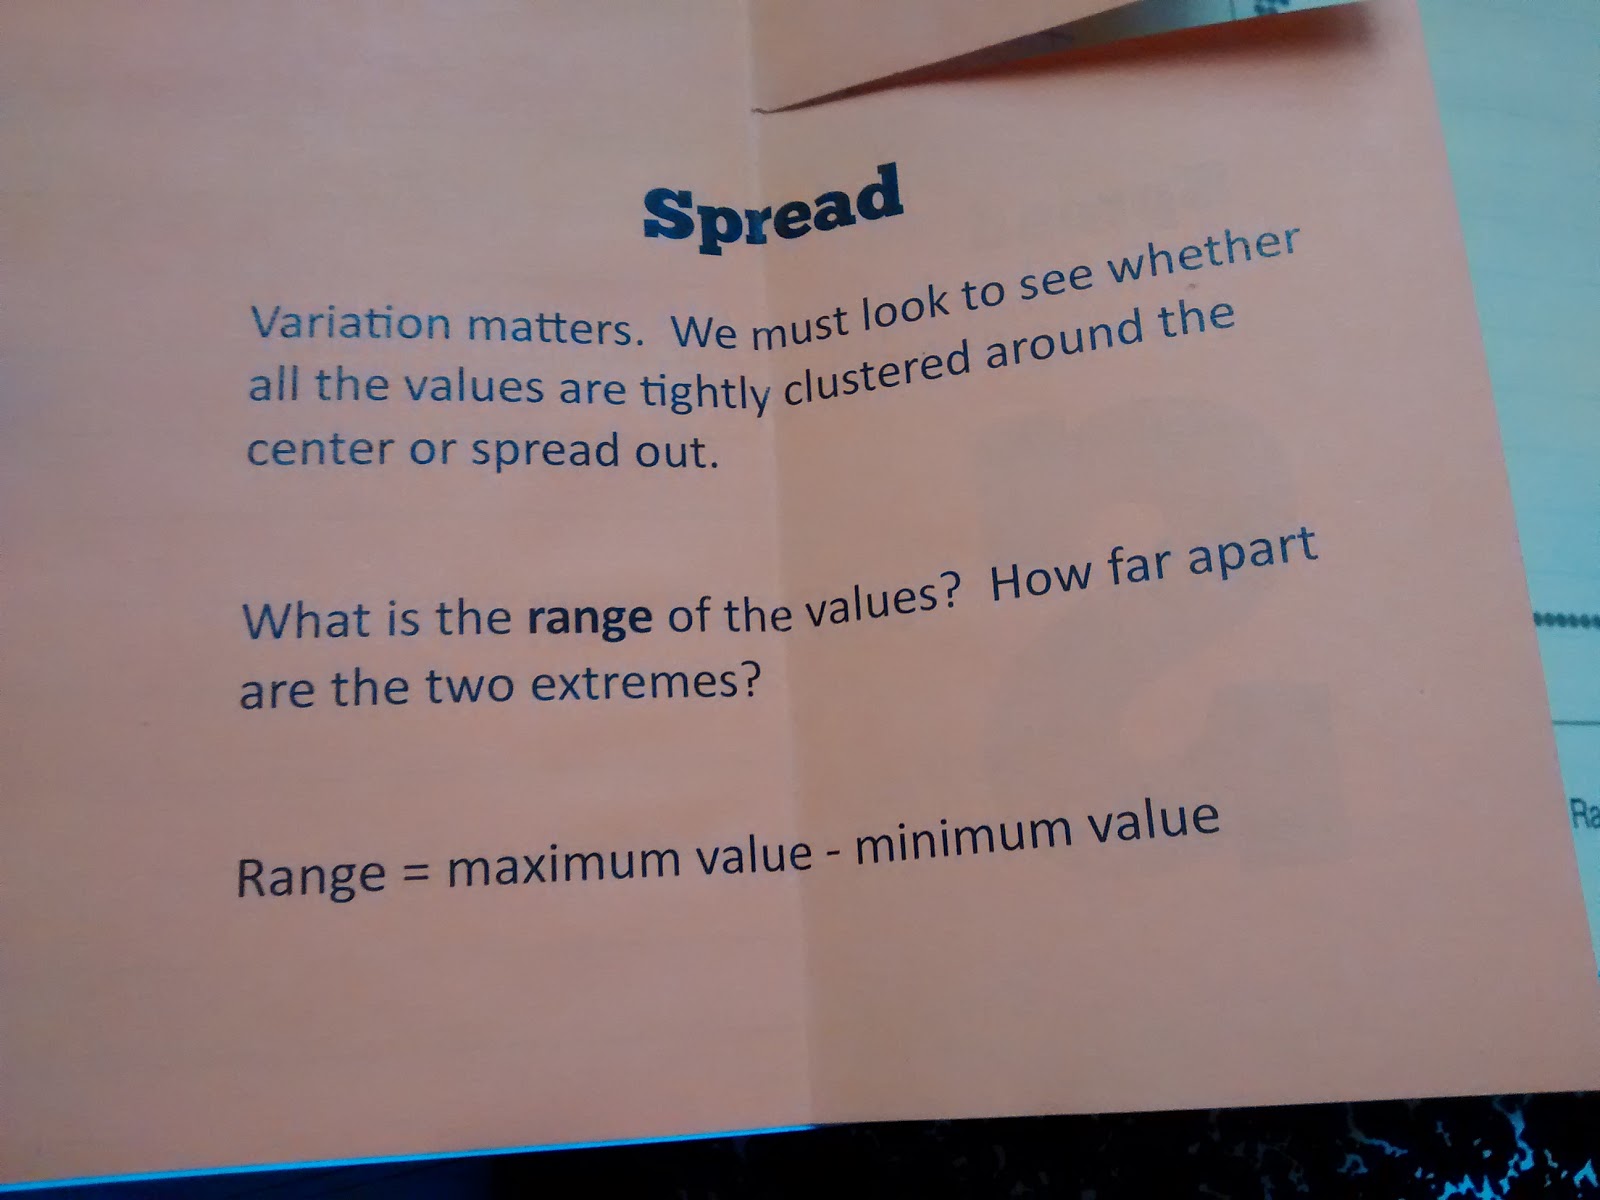
Spread
Variation matters. We must look to see whether all the values are tightly clustered around the center or spread out.
What is the range of the values? How far apart are the two extremes?
Range = maximum value – minimum value
All of the inside:
We put our newly-found SOCS knowledge to the test by examining this Kentucky Derby Winning Times Graphs and completing a SOCS Practice Foldable.
Saving this for next year. Since it was my first year of teaching Stats I decided to hold off on doing a notebook with them until I had a year under my belt. I've been doing guided notes that I got from one of my instructors at an AP Institute. It was a great training. The two Stats teachers are coauthors of the text that I use.
I did the same thing when I taught stats for the first time two years ago!