Kentucky Derby Winning Times
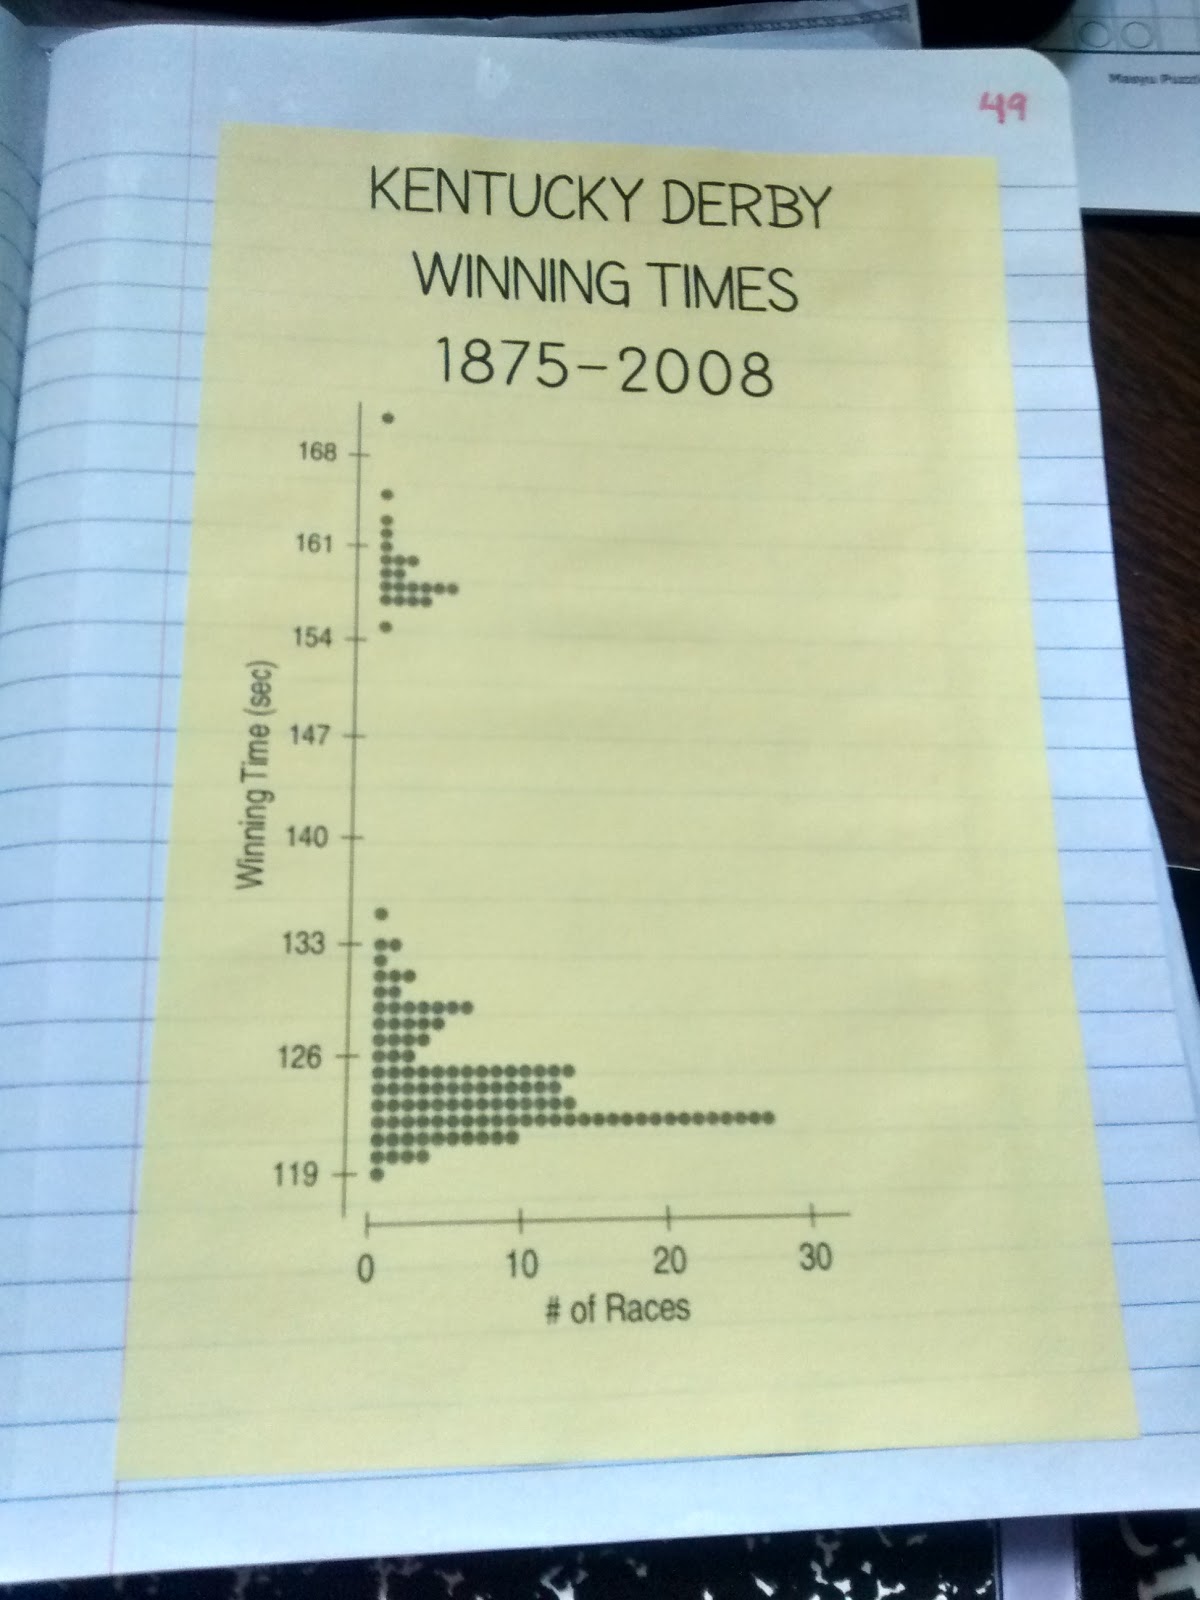
One of my favorite graphs to use to practice SOCS in statistics is this Kentucky Derby Winning Times graph that I found in Stats: Modeling the World.

To practice describing SOCS, I had my class look at this dotplot of the Kentucky Derby Winning Times between 1875 and 2008. We had quite the interesting discussion about why the data was shaped this way.
I used this activity after we completed our SOCS Foldable and before our SOCS Practice Foldable.