Looking for Outliers in the OKC Thunder
Today’s lesson is brought to you with special thanks to the OKC Thunder. I chose to use data for the OKC Thunder because they are Oklahoma’s only professional sports team. Oklahoma is just a little bit obsessed with them!


Looking for more sports-themed activities and puzzles for your classroom? Here’s a few examples of the other sports-related activities I have created.


UPDATE: I did this activity during the 2016-2017 school year, so my data is from that year. An updated 2022-2023 version is included at the bottom thanks to the kindness of a blog reader!
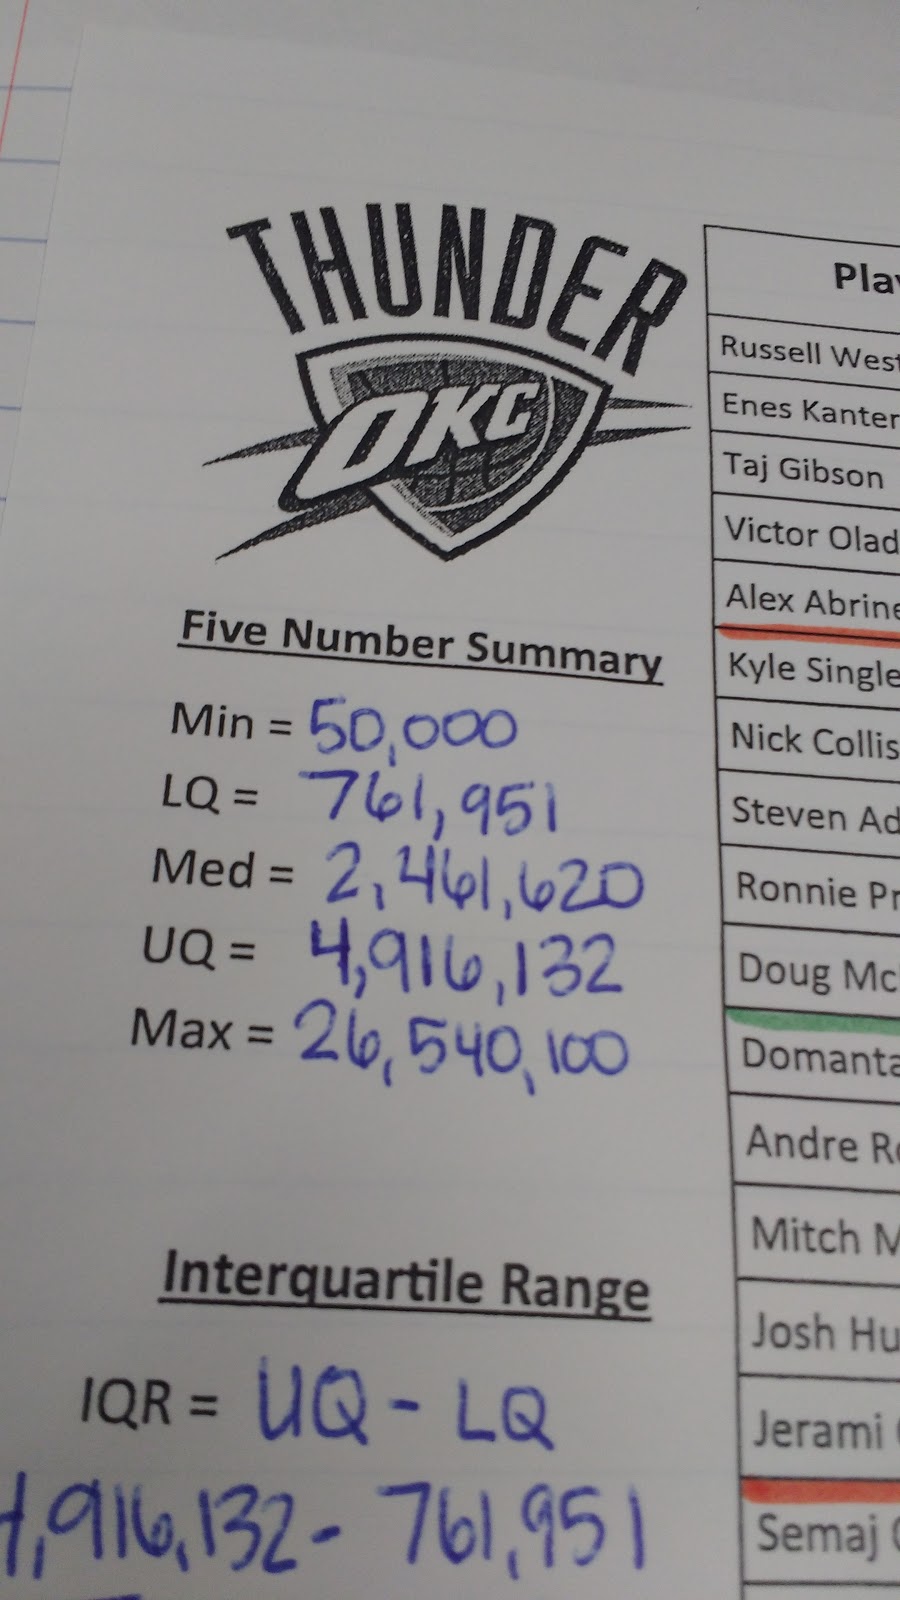
Here’s the handout I gave my students to glue into their interactive notebooks:
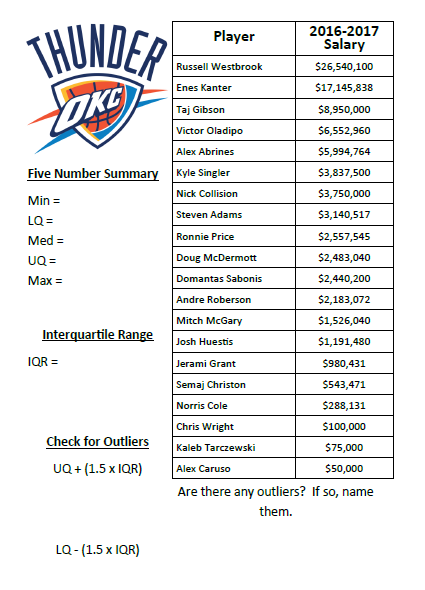
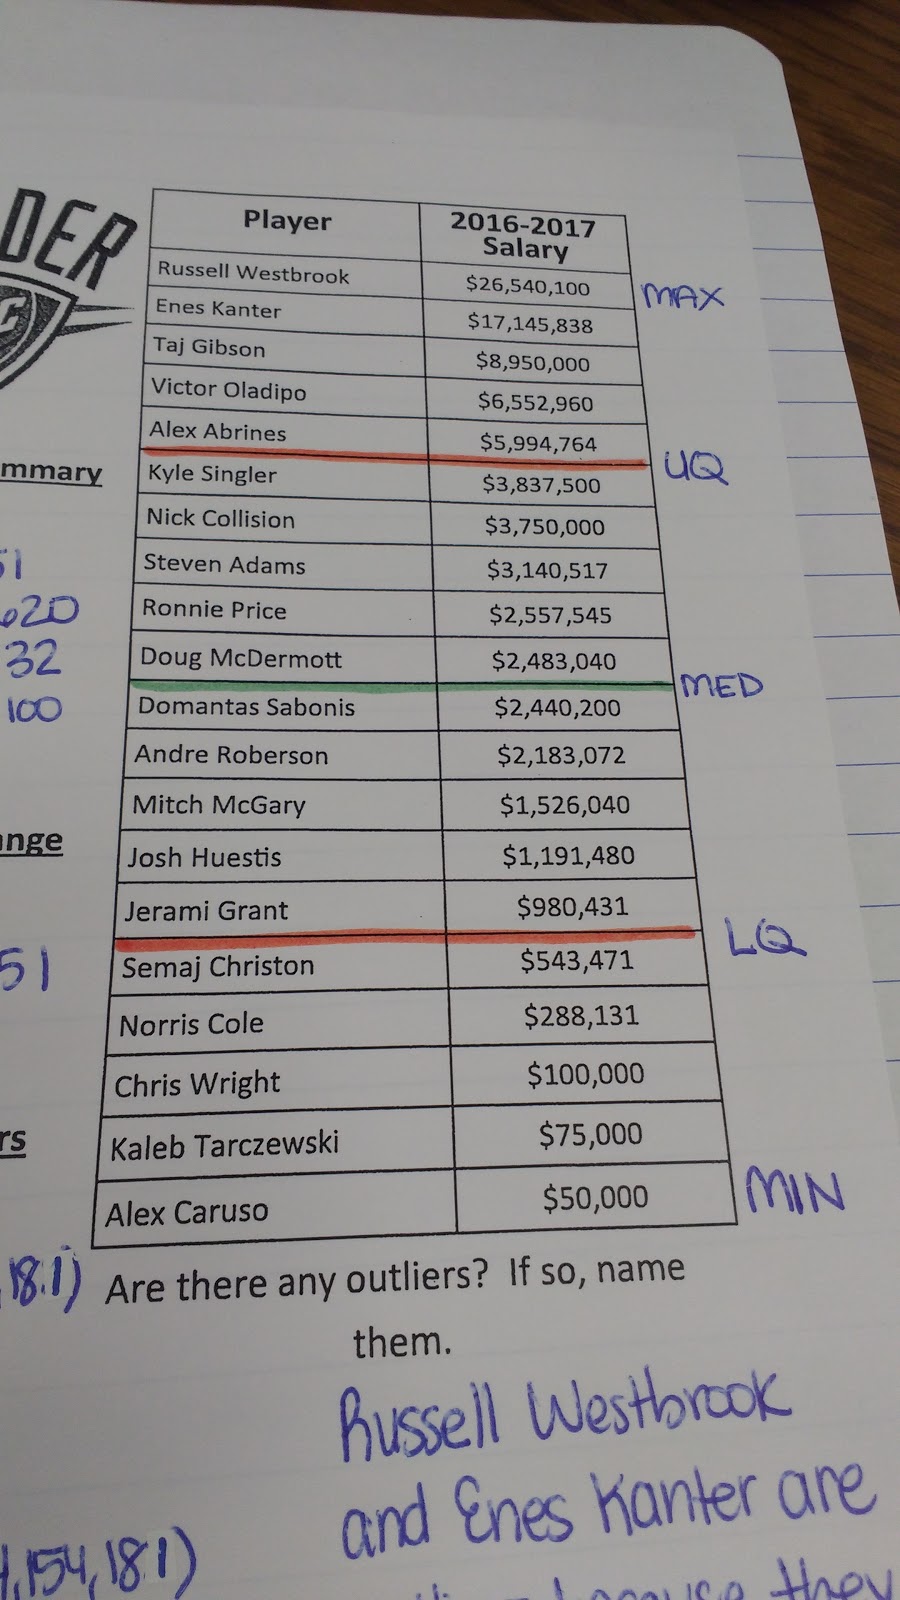
I got the salary data from Basketball Insiders. When my students started looking at the data, they were shocked that I had been able to find that data on the internet!
Up until this point in the course, the only way my students knew to identify outliers was to eyeball them. This was really frustrating my students, and they kept begging for a more definitive way to see if a data value was an outlier. I LOVE that my students were begging for a method for identifying outliers. I need to find more ways to make my students BEG for solutions in math class!
Before spilling the beans and telling them how we check for outliers, I asked the class to discuss who they thought must be an outlier. 100% of the class was absolutely sure that Russell Westbrook HAD to be an outlier. Some reasoned that Enes Kanter must also be an outlier since there is such a big gap between Taj Gibson’s salary and Enes Kanter’s salary. Others were not so sure.
Then, the conversation got super interesting when someone suggested that we might also have outliers on the lower end of the data. This was even more controversial than the conversation regarding Enes Kanter! I had to stop the debate and get my students started on finding the five number summary.
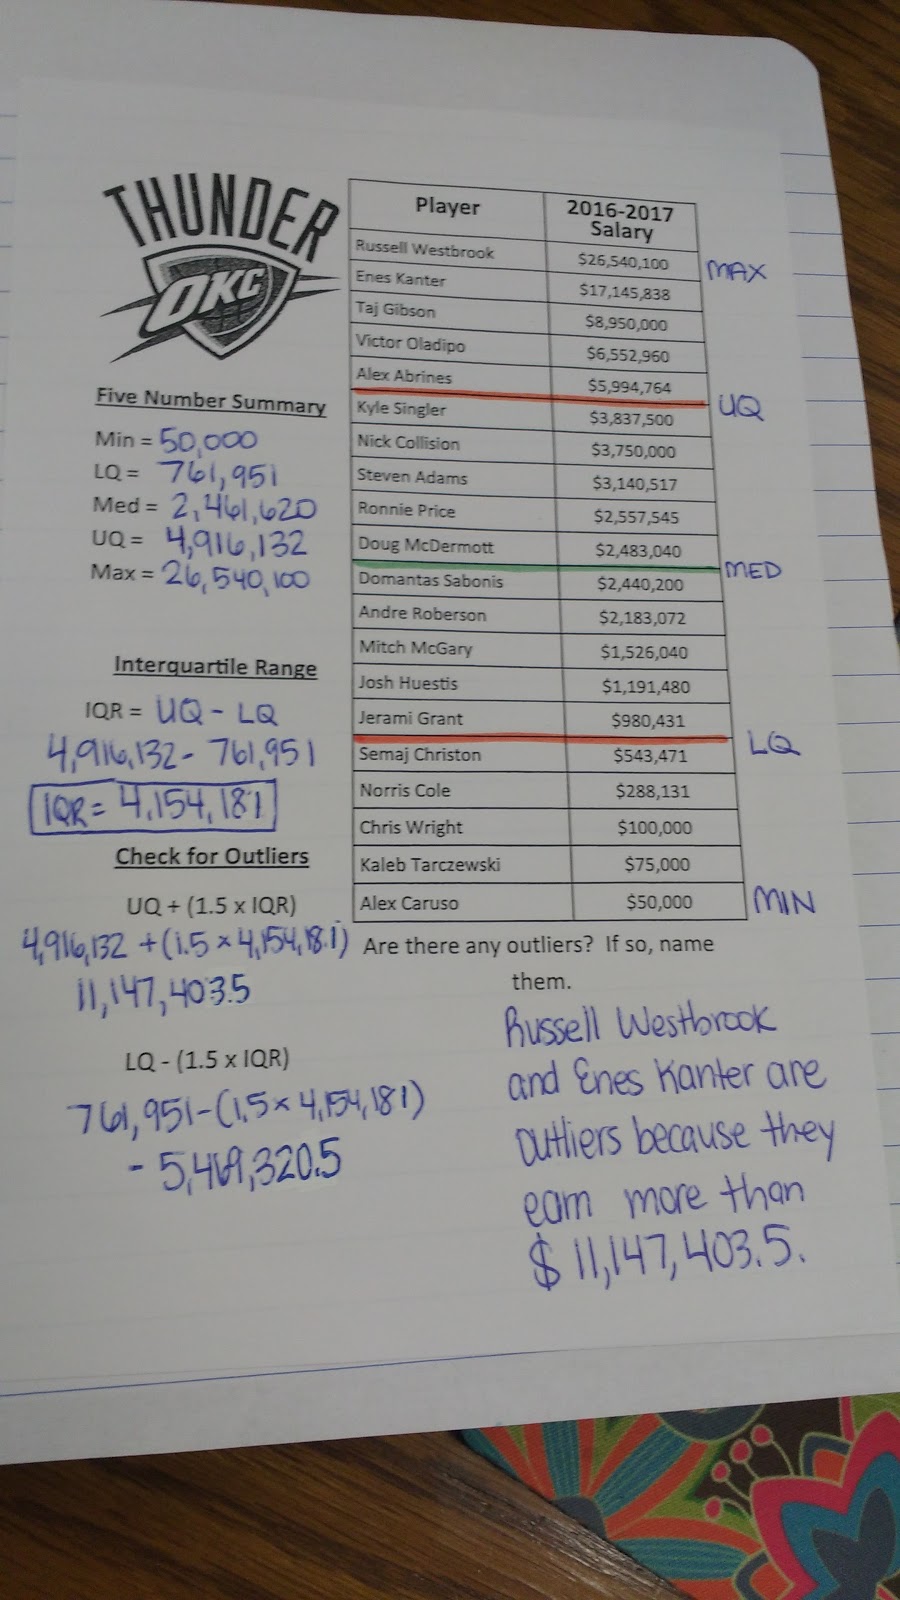
This was my students’ first time ever finding the five number summary for a data set. Finding the minimum, median, and maximum were a breeze. Students were a bit confused by lower quartile and upper quartile, but that confusion was quickly cleared up.
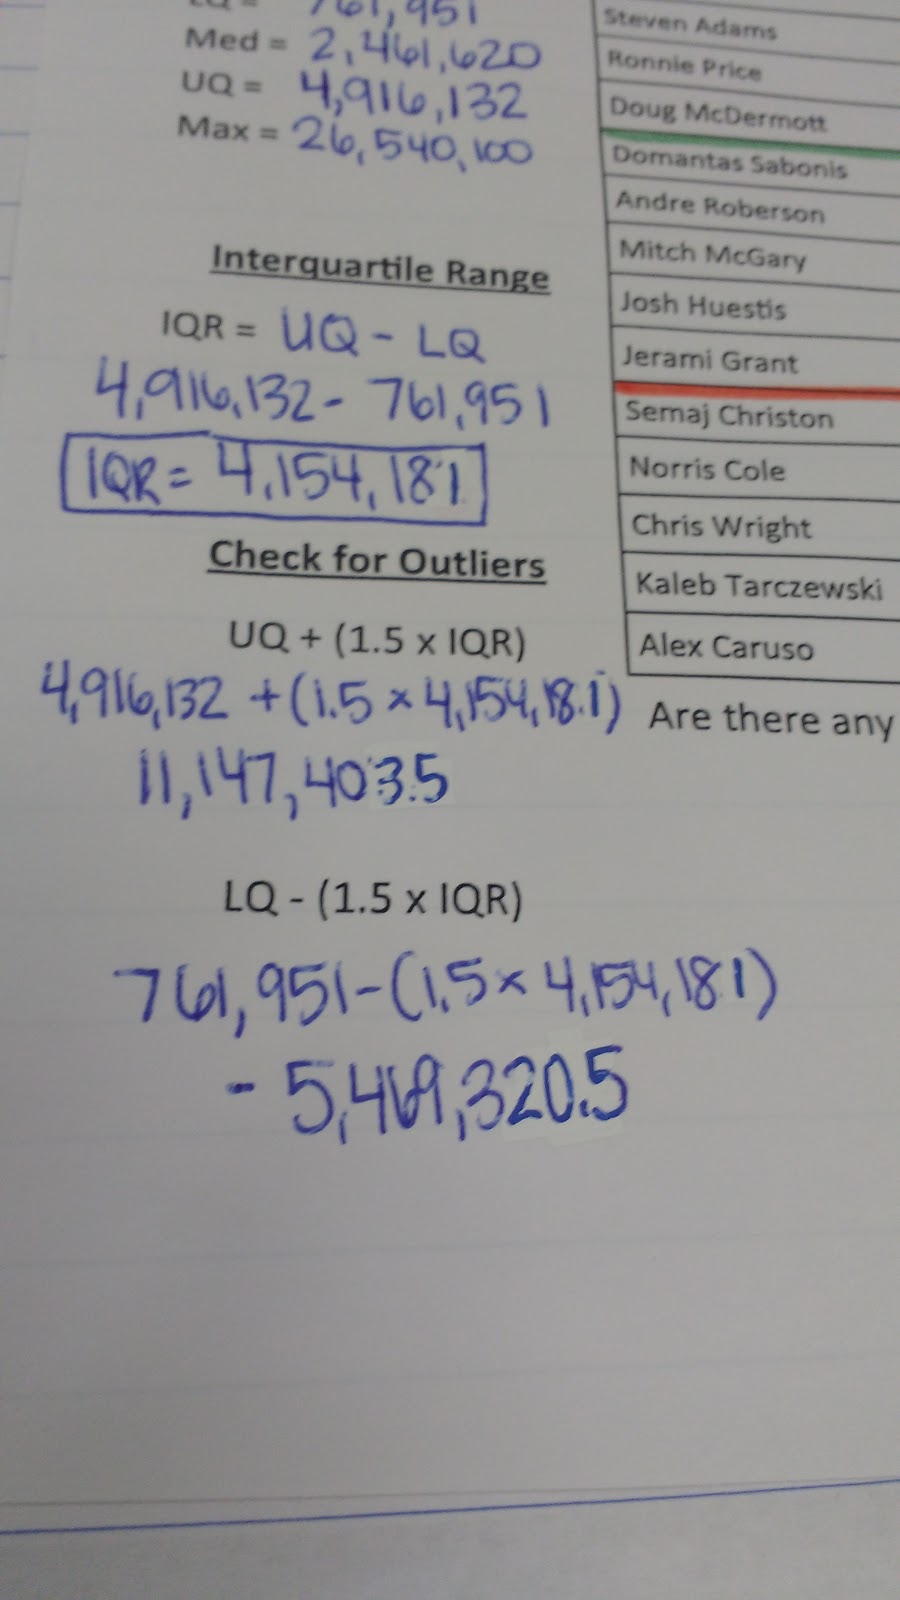
Next, we found the interquartile range. I must have jumped too quickly referring to the interquartile range as IQR because when my students took their quiz, I got asked way too many times what “interquartile range” meant. As soon as I said “IQR” they knew exactly what to do and got right back to work. Oops… Maybe I should only call it “interquartile range” in the future until students beg for an abbreviation!
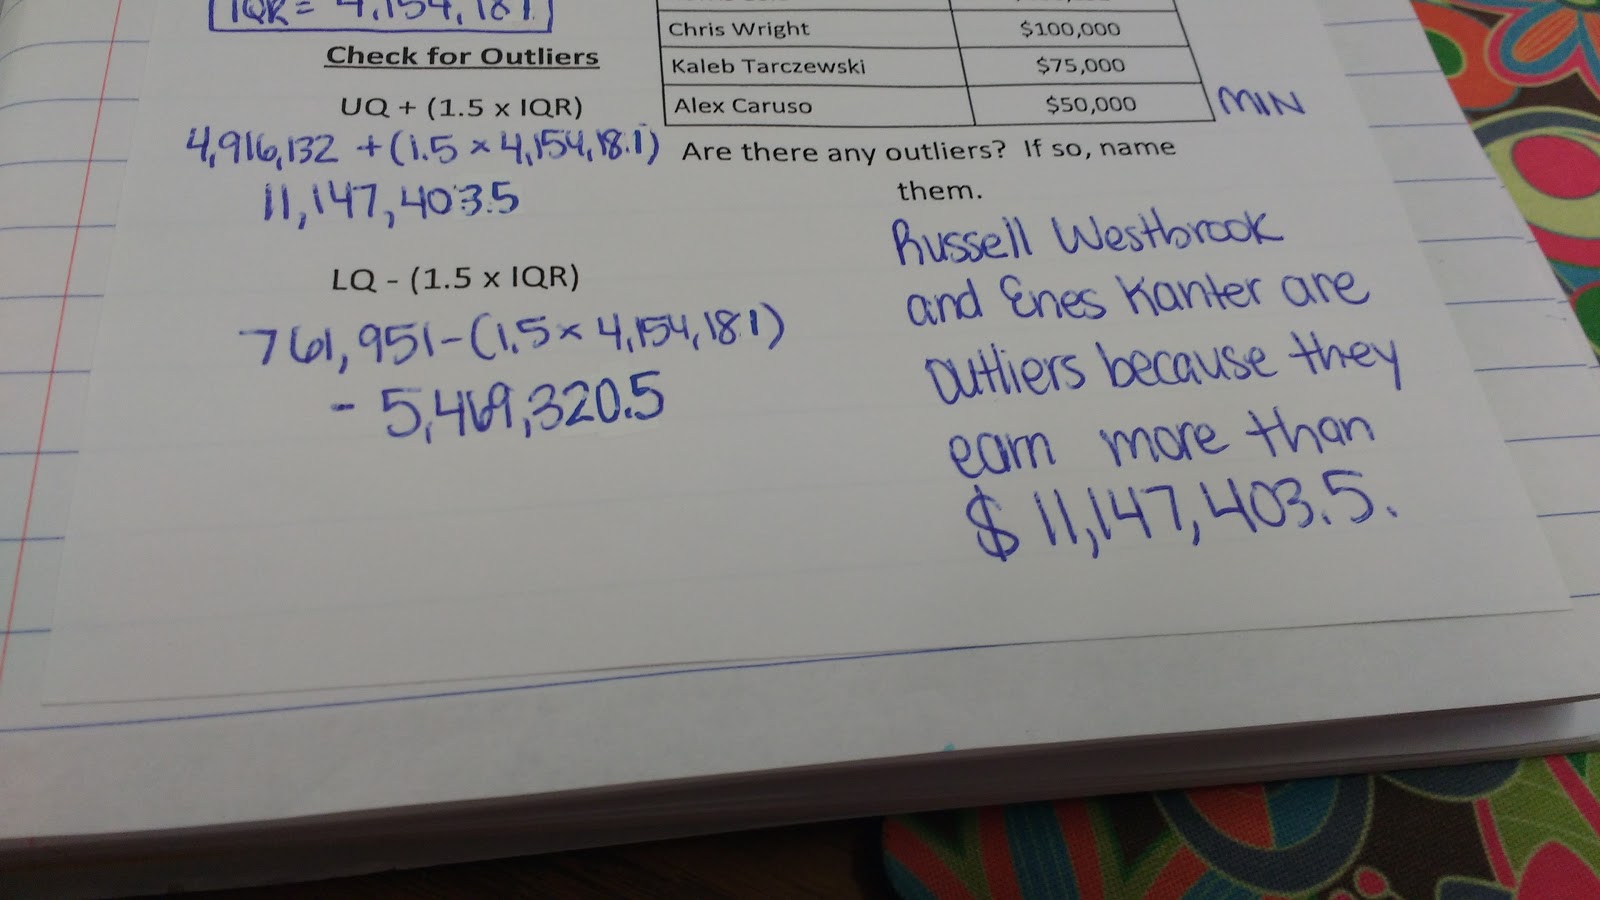
Defining outliers as being more than 1.5 IQRs outside of the upper quartile and lower quartile results in two outliers: Russell Westbrook and Enes Kanter.
My students ended up being engaged throughout this activity. They seemed genuinely interested in finding out which players were outliers.
One student begged me to look up data for other sports teams for their quizzes. He said that if I used his favorite teams I would be his favorite teacher ever!
UPDATE: A kind blog reader has updated this activity for 2022-2023! I will post the updated version below!
Click here to SAVE the file to your device.
OKC Thunder Activity 22-23 (PDF)
2096 saves – 225.44 KB
Thanks Sarah for this resource, it’s a great idea and the first I’ve seen on outliers. I’m going to adapt it based on data from our local football (soccer) team, which unfortunately has no outliers, but should provide some discussion when compared with highly paid footballers in the UK.
Lisa
That would be an awesome comparison!
Fun activity. I've done it with other sports teams before. Mine was based on number of shots made during a season. Most people around me consider the Thunder to still be the Seattle Super Sonics 🙂
Number of shots would be a fun twist. One version of my scatterplot quiz was number of points scored vs. number of minutes in game. So much fun data tied to sports!
I've been teaching 30 years. I make more than two of those guys. Sigh.
Thanks for sharing. I have done similar things with the ages of US presidents in the past.
It’s interesting to look at what Alex Caruso is making today.