Analyzing the Ages of Academy Award Winners
Well, it turns out that I still have posts in my drafts folder from last year. I guess I should do something about that.

The Skill: Comparing Data Sets
The Topic: Ages of Academy Award Winners
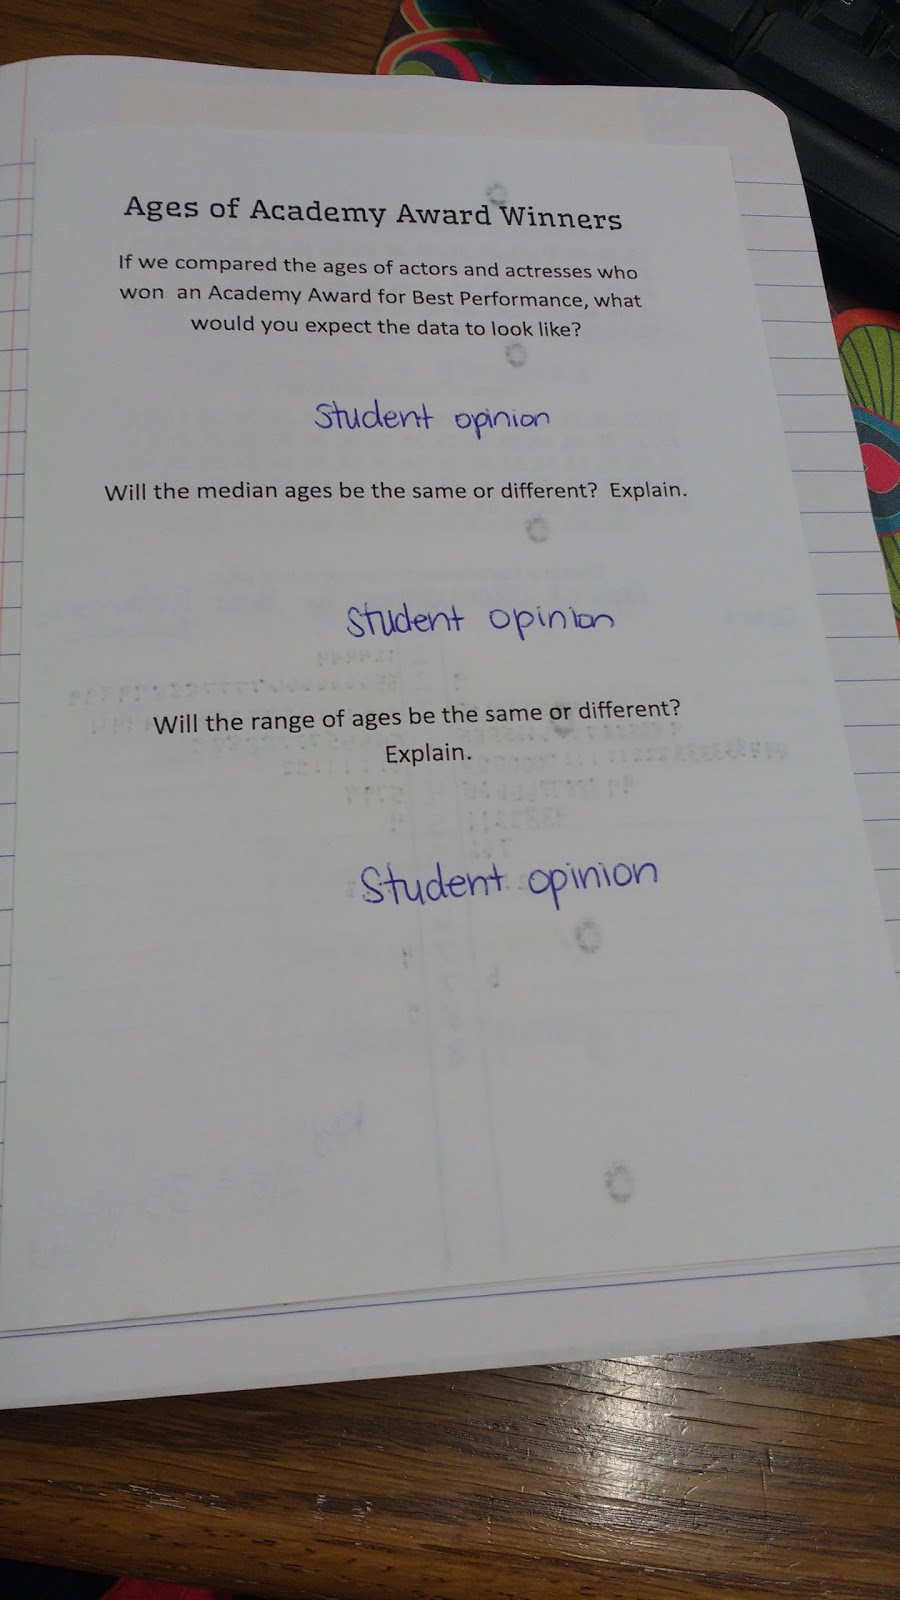
The Introduction: Ask students what they expect to happen. This was a difficult task for my students. It turns out they didn’t really have a good idea of which actors/actresses have ever won an Academy Award for Best Performance. They were convinced that Betty White had won the Oscar for Best Performance…
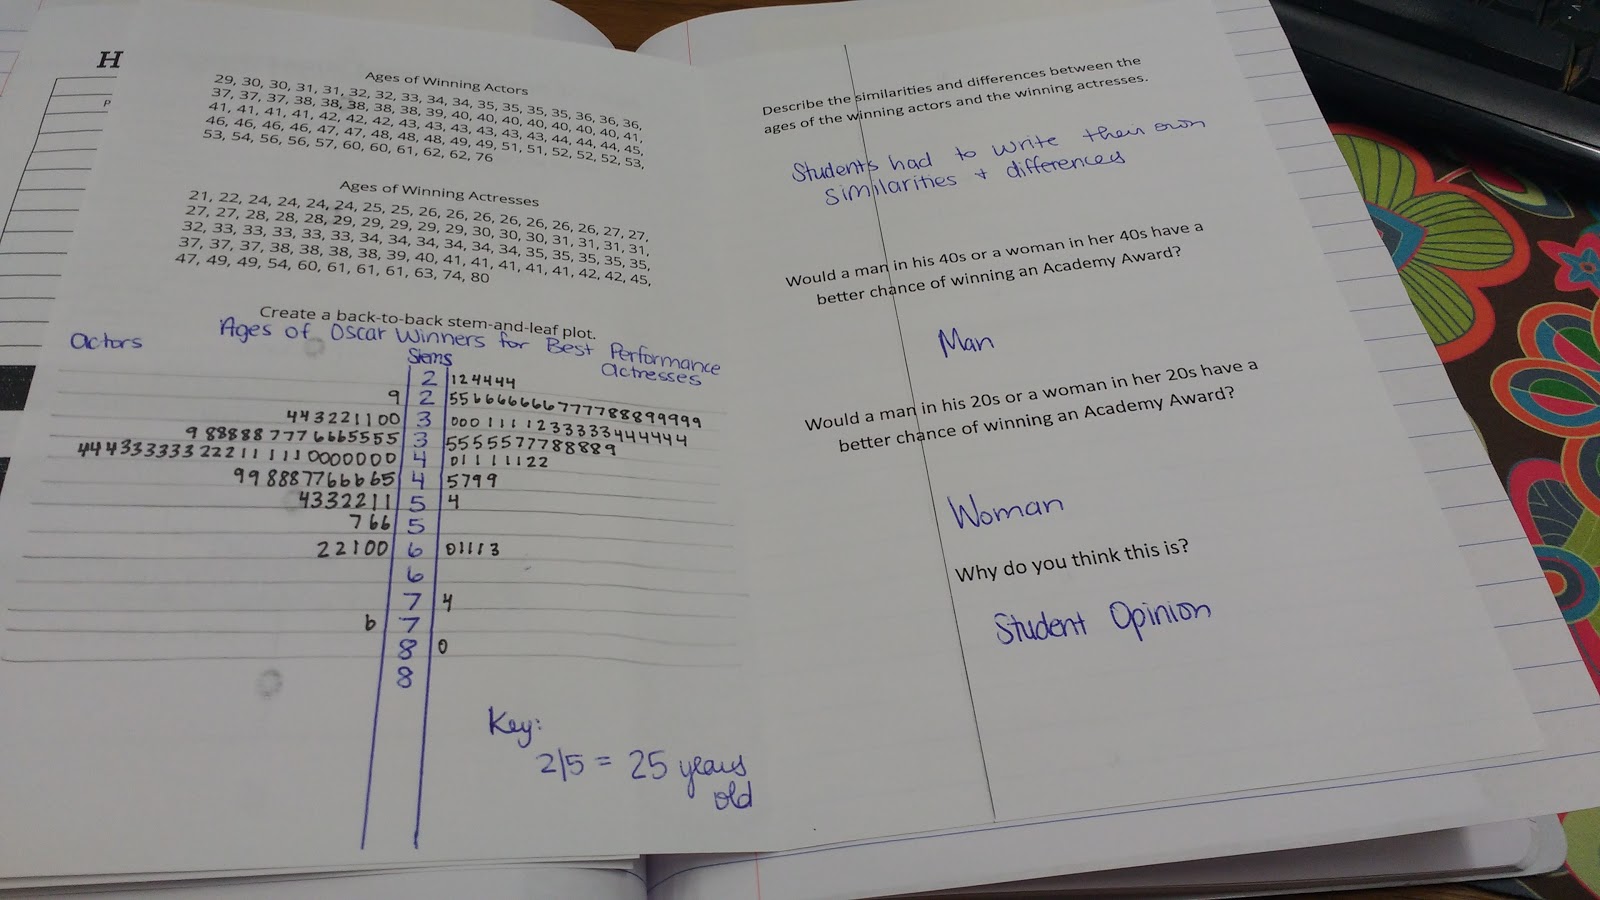
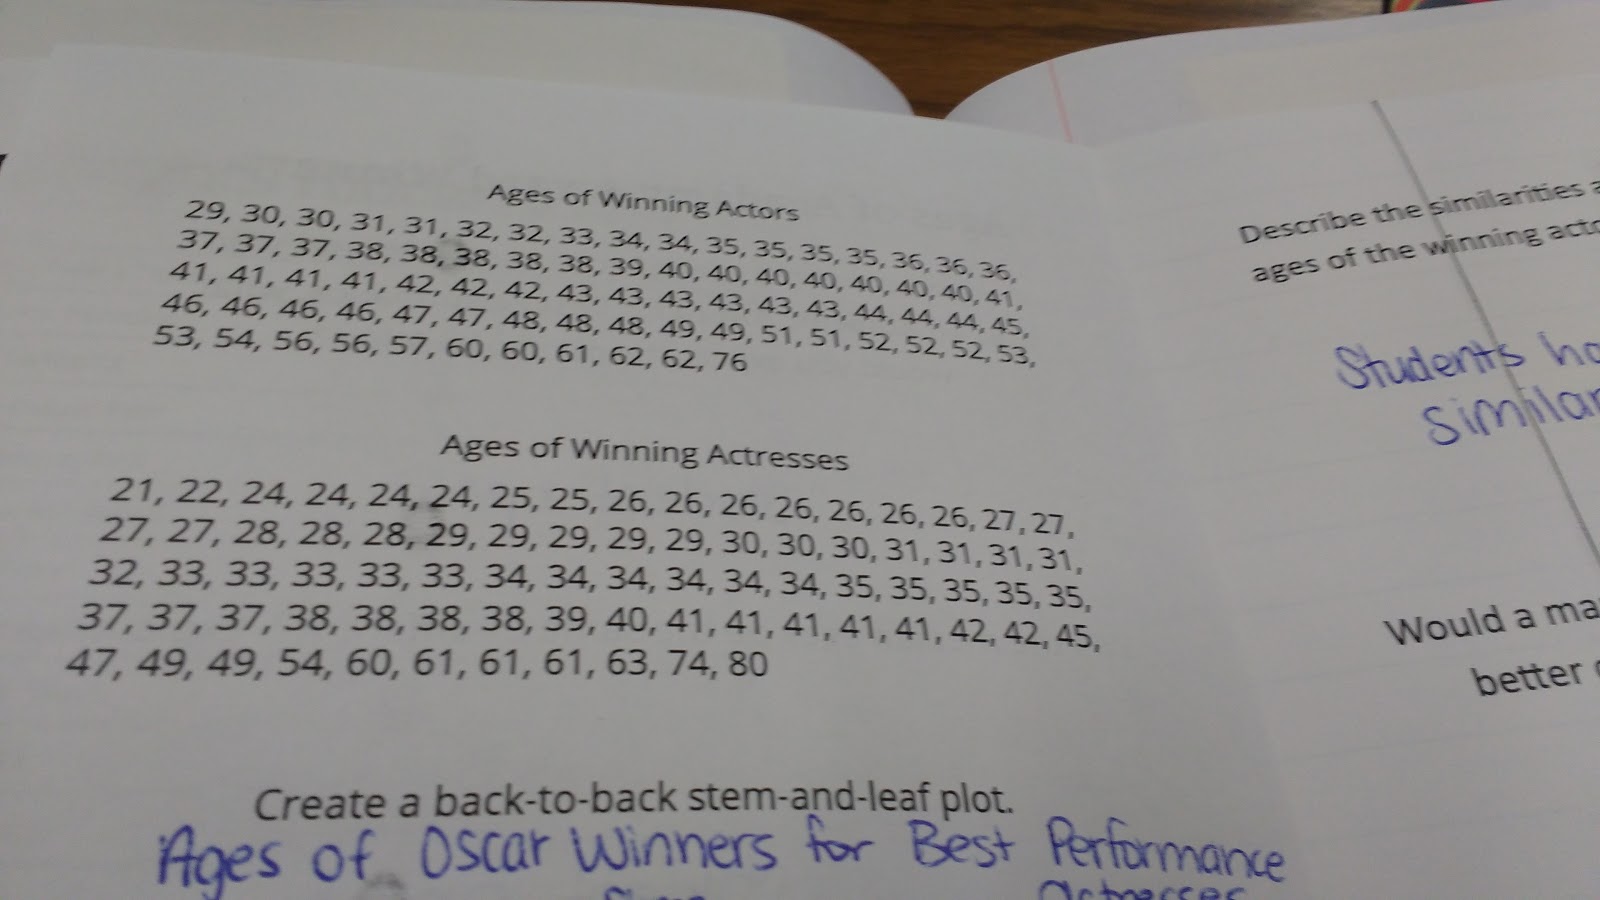
The Data: Ages of Winners Divided by Gender
The Data Display: Back-to-Back Stem-and-Leaf Plot
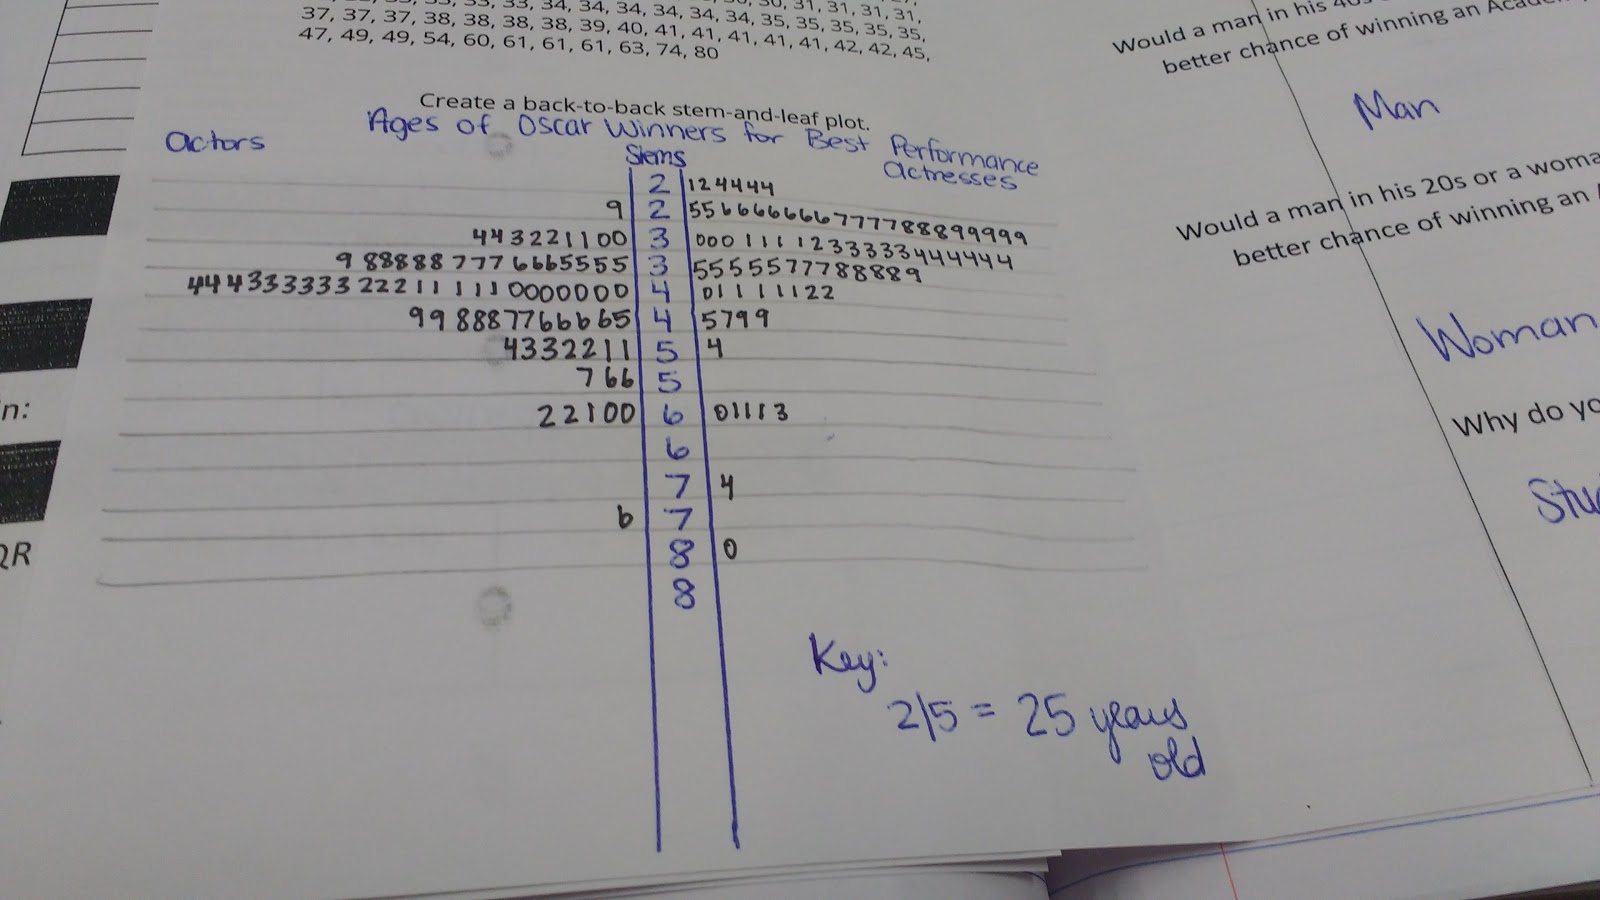
Note to self: Give students a graph paper grid to do this on top of in the future. Their data displays were a MESS.
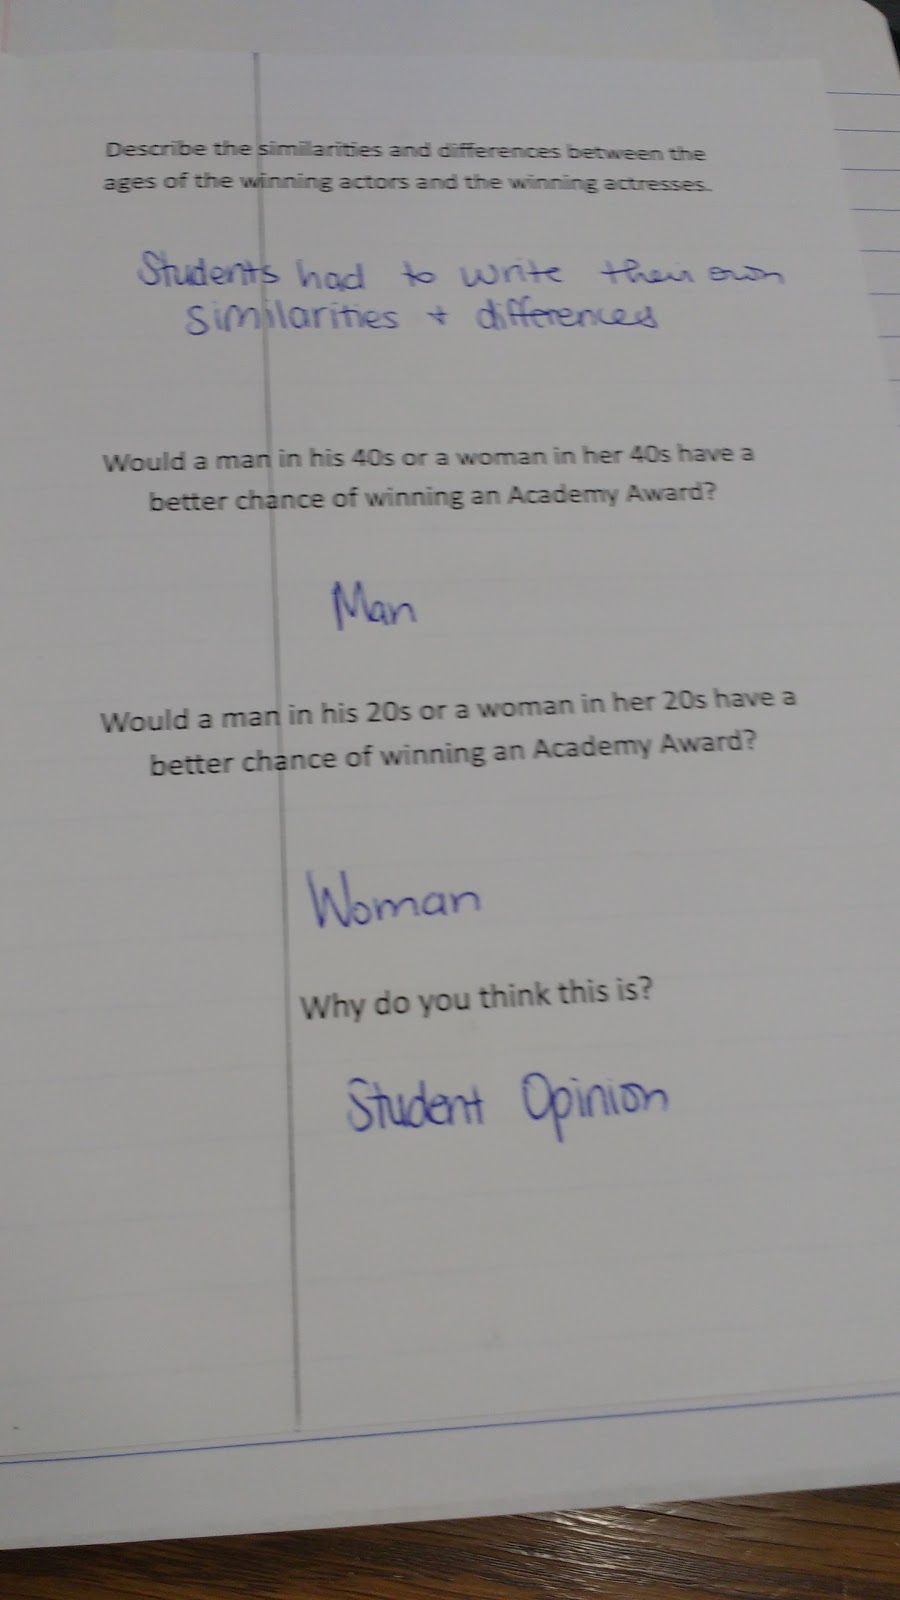
The Conclusion: Analyze Similarities/Differences and Answer Reflection Questions
Of all the activities we did in our data analysis unit last year, this one was probably one of my least favorites. It’s not that the activity was bad.
It just didn’t have the enjoyment factor that our other activities had of collecting our own data. So, I’ll probably be on the lookout for a different activity for creating back-to-back stem-and-leaf plots for this year.
It was really interesting to listen to students share their theories regarding this data, though!
I was planning something similar but using the ages of my students' parents. I wonder if this would create authentic data with a gender gap?