Types of Data Displays Foldable
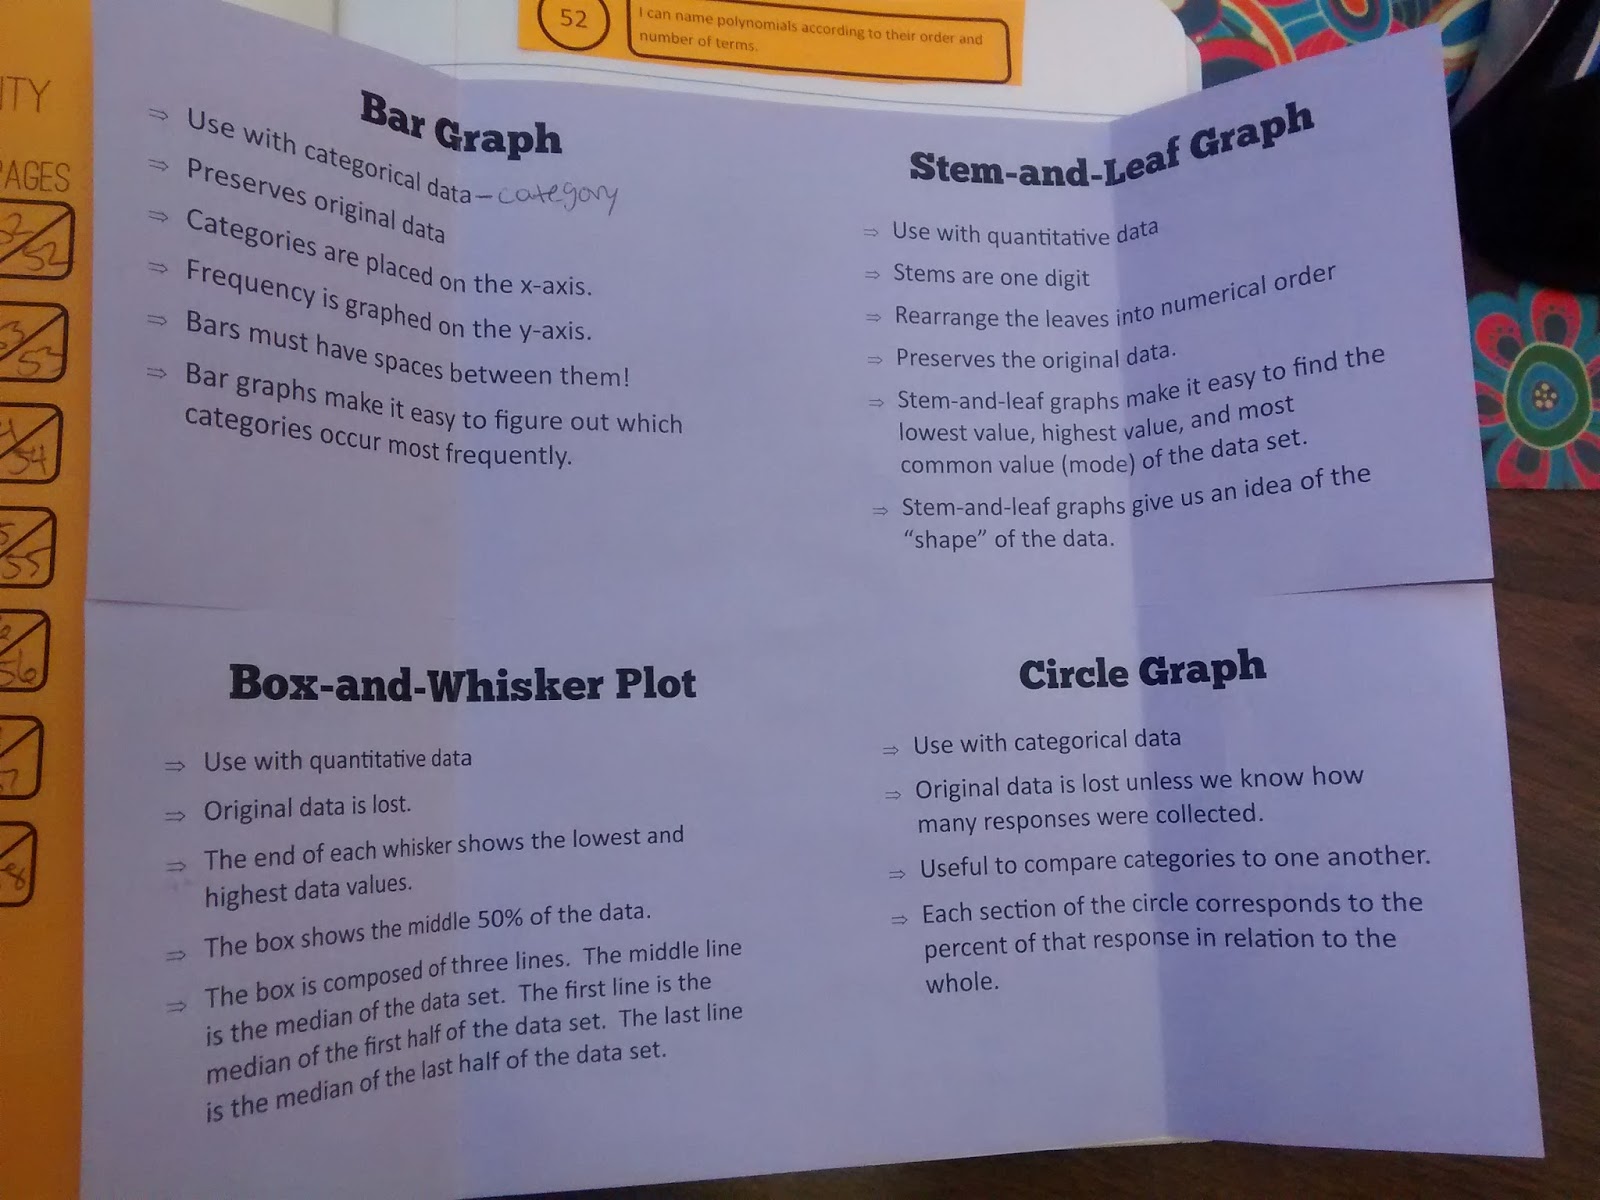
I created this types of data displays foldable for my Algebra 1 students to review bar graphs, stem-and-leaf graphs, box-and-whisker plots, and circle graphs.
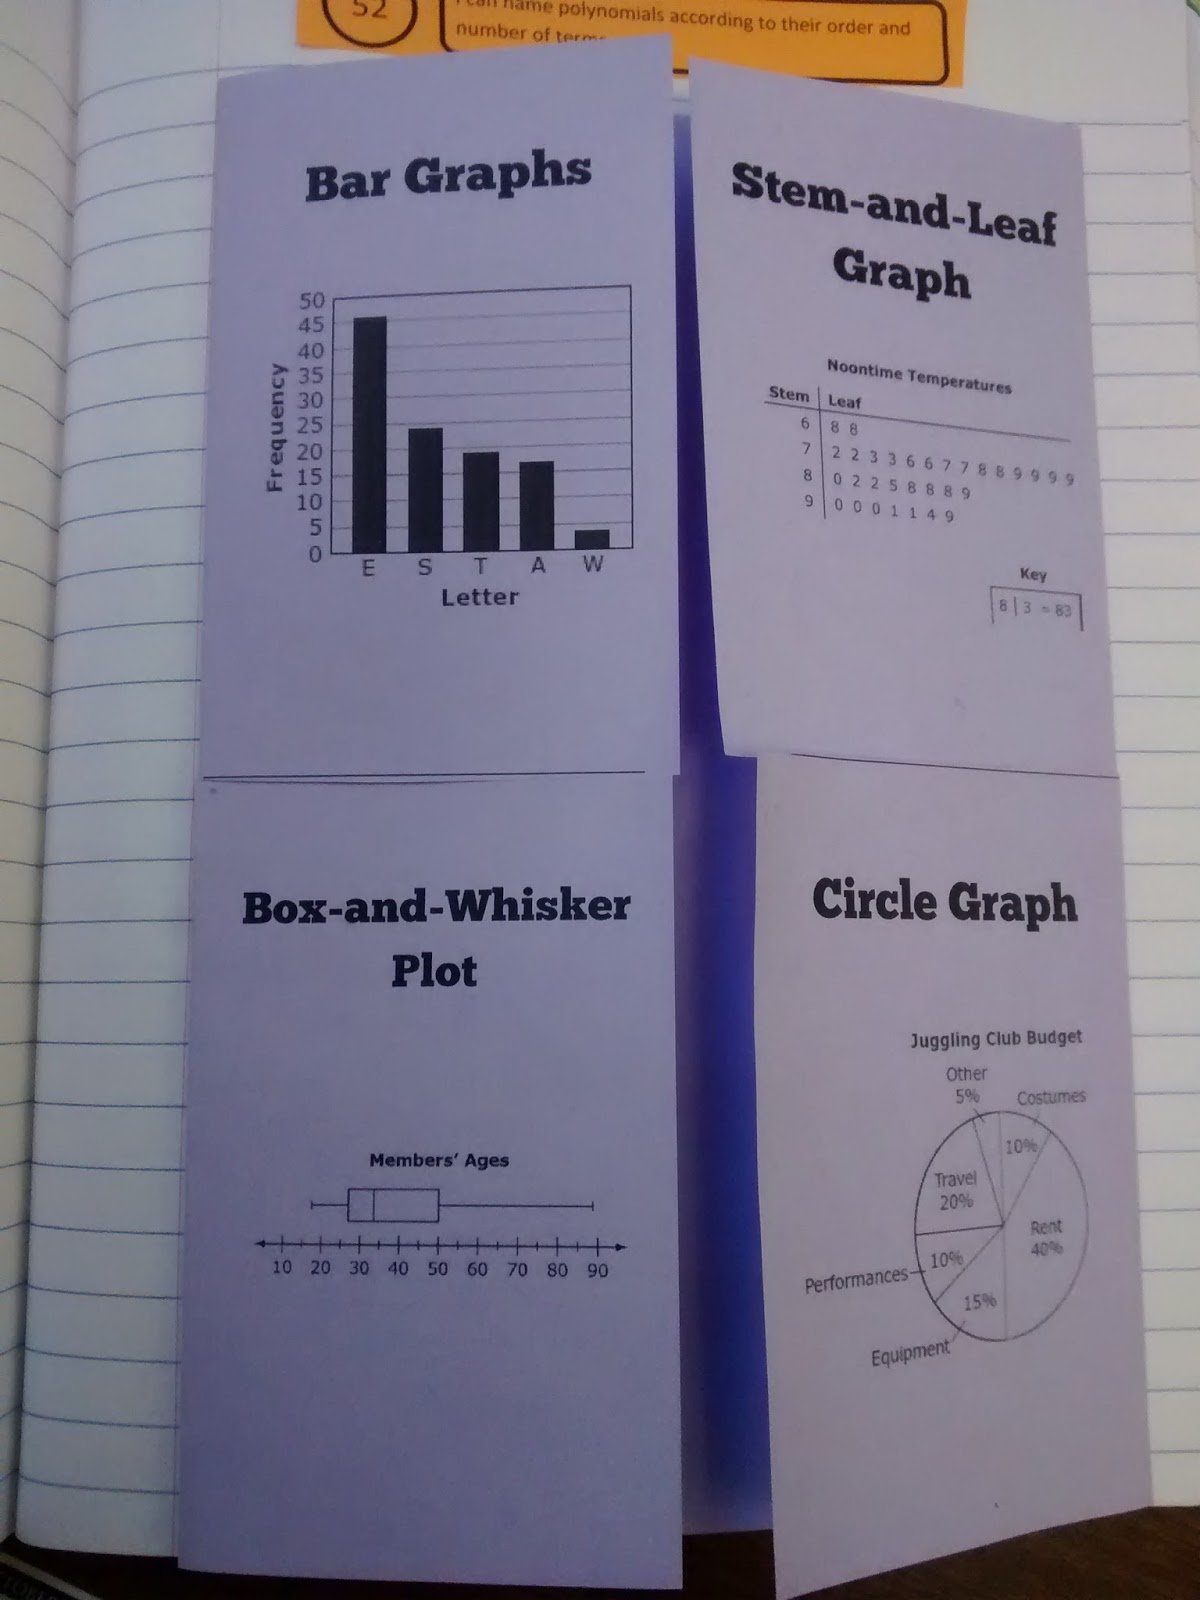
My Algebra 1 classes recently started their last unit of the year: Data Analysis and Probability. They will take their end-of-instruction exam on April 11th, so the rush is on to finish the last unit and do a comprehensive review before their first high-stakes high school test.
Given that we will be missing a week for spring break, and I’ll be taking off four additional days for my wedding before then, it’s super crucial for us to use every moment wisely.
Since it was Friday and all of the basketball players were gone, my students assumed I would give them a free day. Nope. Can’t we just wait until Monday to start the new chapter? Nope.
My first skill for this last unit is for students to be able to choose an appropriate representation for a set of data. We are covering four different representations: bar graphs, circle graphs, box-and-whisker plots, and stem-and-leaf graphs.
I modified a similar foldable I had made for my stats class that was at a much higher level and covered different graphs for my Algebra 1 kids.
This was my students’ first exposure to distinguishing between quantitative data and categorical data. In retrospect, I should have prepared a sorting activity like I used with my statistics students. Oh well… Hindsight is 20/20.
Also, ignore the fact that I have one of the graphs in the plural form and all the others in the singular form. I corrected it on the downloadable file. This is what I get for throwing this together at the last minute.
Bar graphs, circle graphs, and stem-and-leaf graphs were review for almost all of my Algebra 1 students. A few had seen box-and-whisker plots before, but none of my students knew how to go about making one.
Free Download of Types of Data Displays Foldable
Click here to Download
Types of Data Displays Foldable (PDF)
2000 downloads – 357.30 KB

