Let’s Make a Graph Activity
I created this let’s make a graph activity to give my Algebra 1 students practice making various types of data displays. We needed to practice making bar graphs, box-and-whisker-plots, circle graphs, and stem-and-leaf graphs.
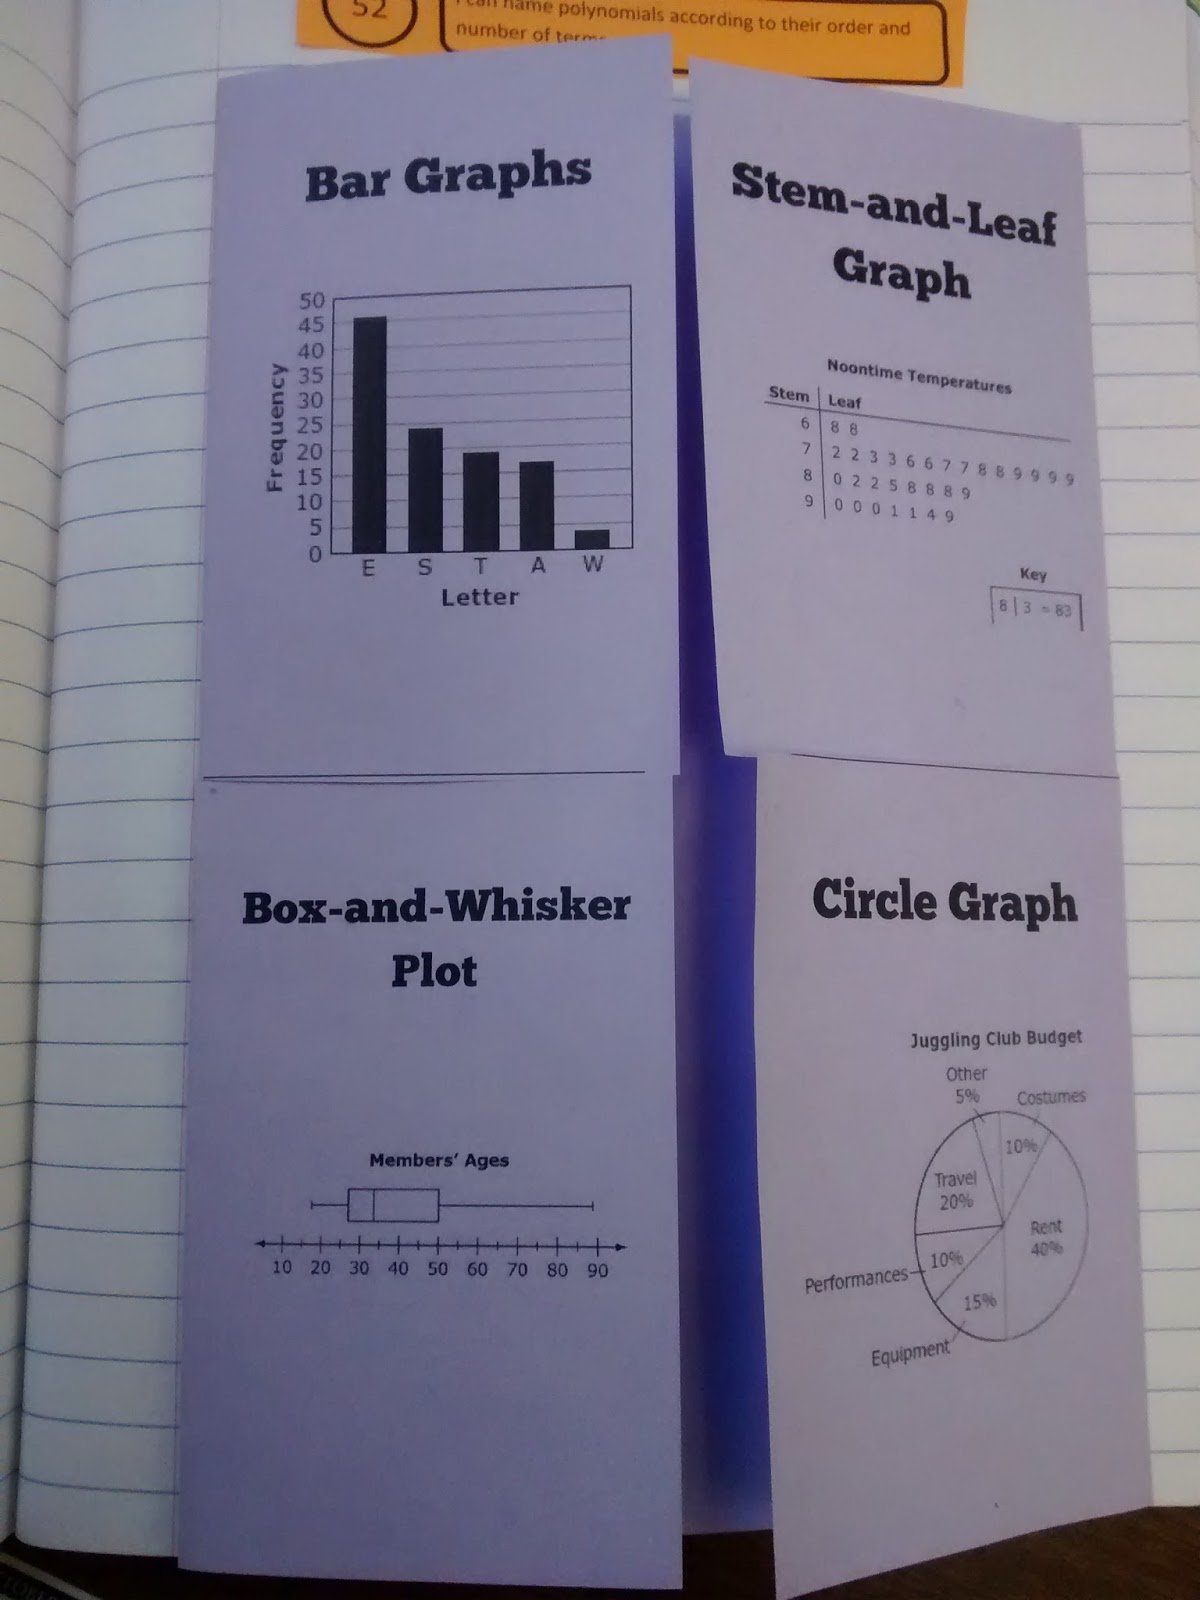
We completed this activity after going over our Types of Data Displays Foldable.
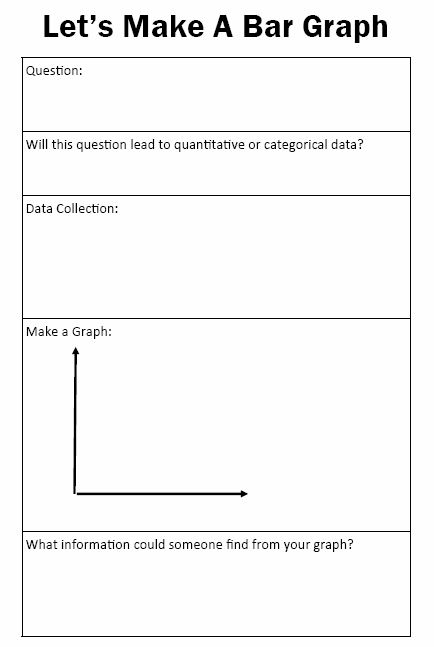
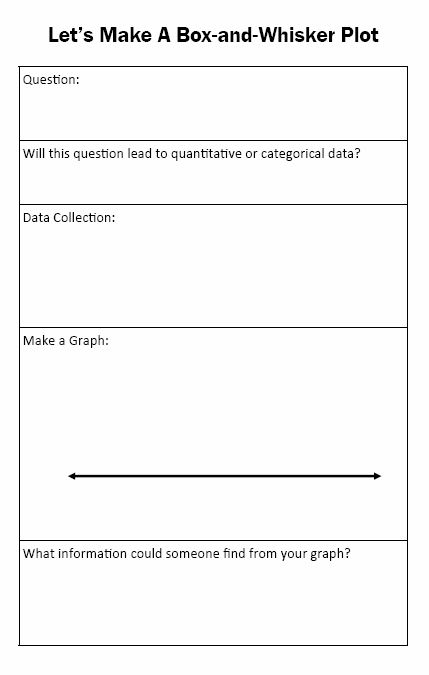
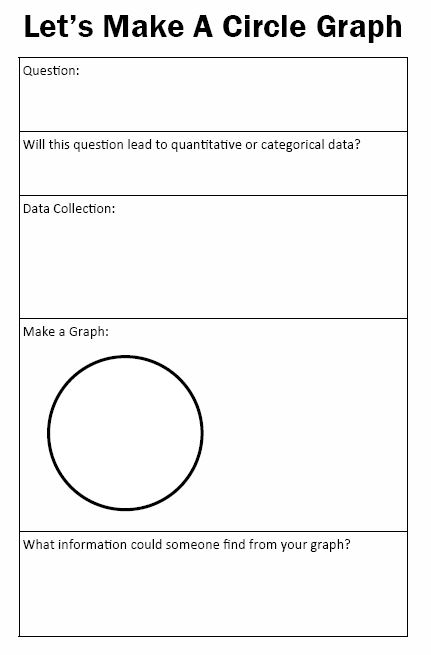
I made these half-sheet forms for students to complete and then put in a pocket in their notebooks.
Students had to come up with four different questions for the class to ask that we could turn into the four different types of graphs/data displays.
This activity ended up taking a class period and a half (50 minute periods) to complete.
My students struggled with coming up with appropriate questions that would yield good data. So, I had to keep telling them to come up with new ideas.
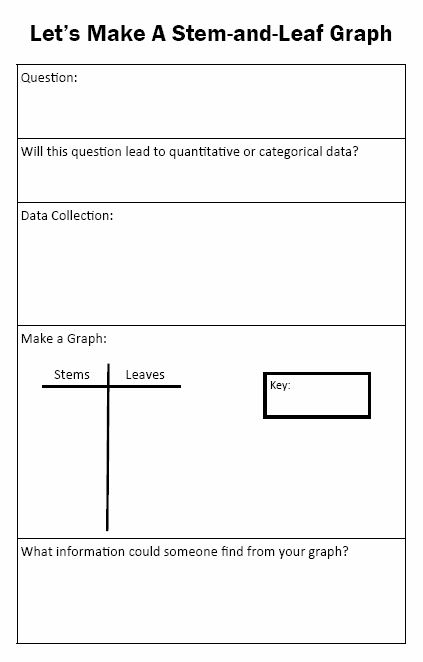
For the stem-and-leaf graph, all three of my Algebra 1 classes independently decided to do “What is your favorite number?” I found this to be very interesting!
Let’s Make a Bar Graph Activity
Let’s Make a Box-and-Whisker Plot Activity
Let’s Make a Circle Graph Activity
Let’s Make a Stem-and-Leaf Graph Activity
Great way to take notes on these!
Thanks Alicia!
I wish Stats was placed at the end of the year for us. They have it as our 5th unit and make us take benchmark assessments so I can't change the order too much. They had it between linear functions and systems. I vetoed that this year because the students just get comfortable with linear functions and then take a month off to do stats before returning to systems. So I moved it to after systems. Still a terrible but better than before.
Benchmark Assessments seem like a pain to work around.
Great items to add to that math journal. Thank you for those ideas to get me started
Thanks Becky!