Hiring Discrimination Simulation for Statistics
This blog post contains Amazon affiliate links. As an Amazon Associate, I earn a small commission from qualifying purchases.
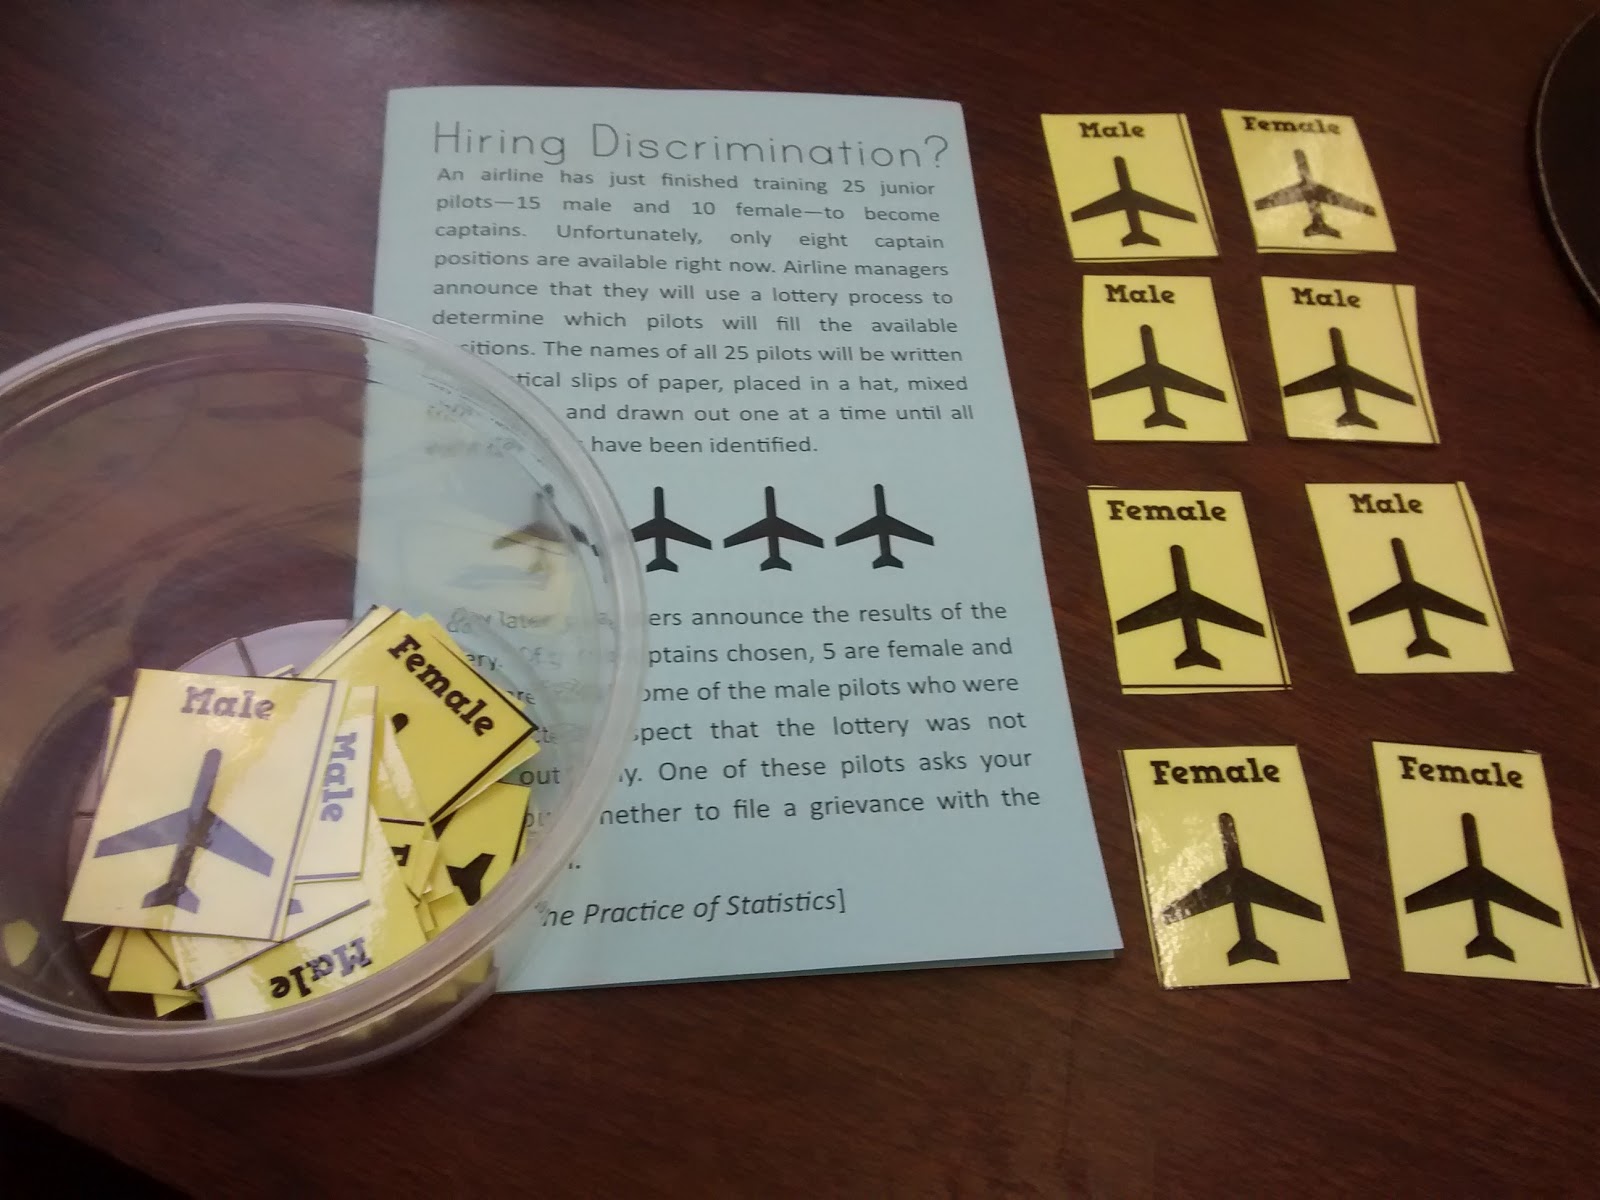
This year, I decided I wanted to start my statistics class off with a statistical simulation to give them a taste of what was in store for the year. I ran across mention of a hiring discrimination simulation on another blog, and I thought it would make the perfect first activity.

The activity is from The Practice of Statistics and has become one of the classic AP Statistics activities.
I made the activity into a quick booklet foldable for students to glue into their interactive notebook.
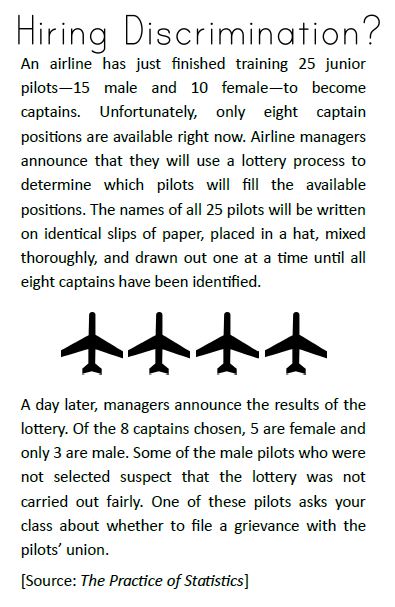
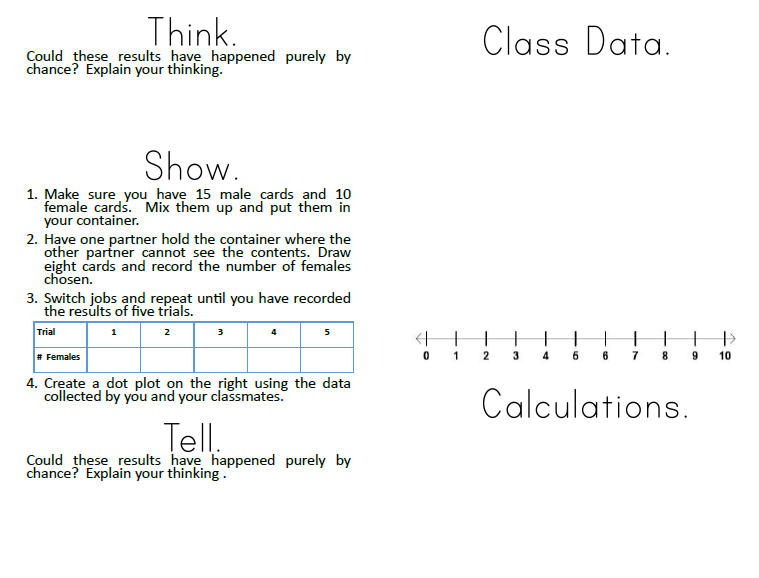
Here’s some more readable images.
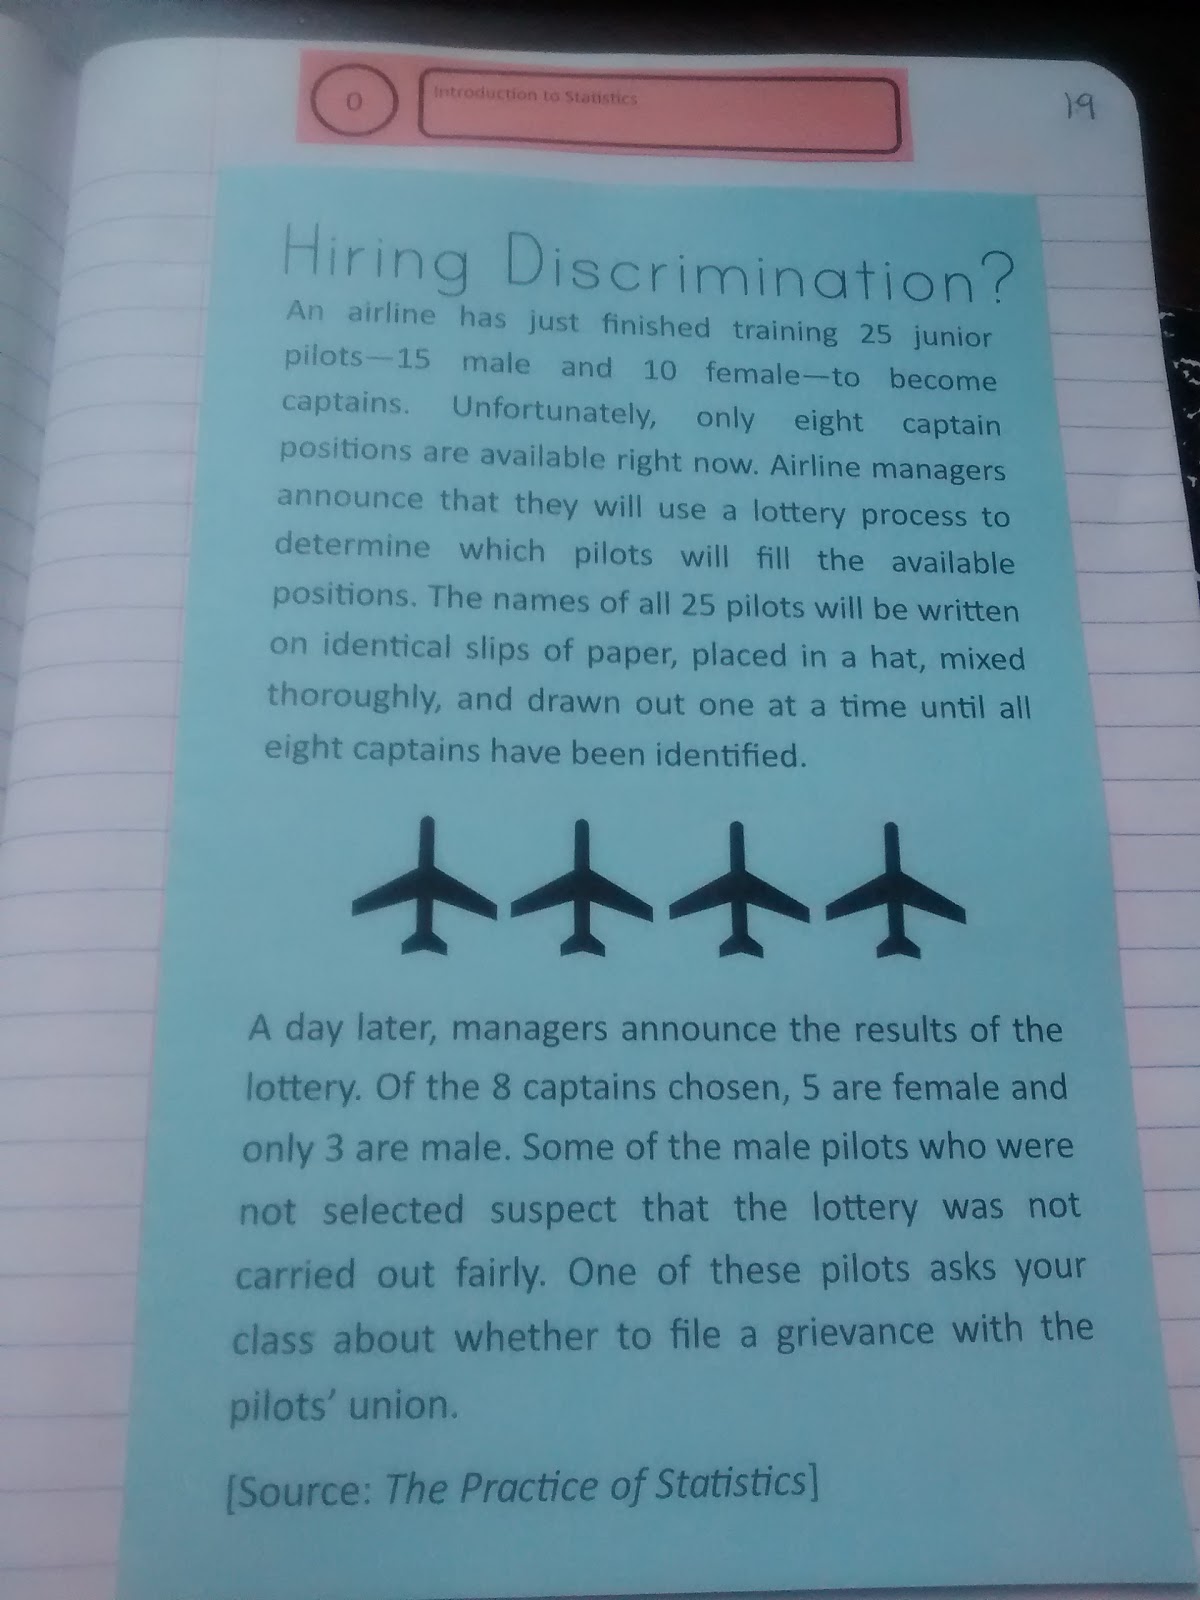
Outside of Hiring Discrimination Simulation Foldable:
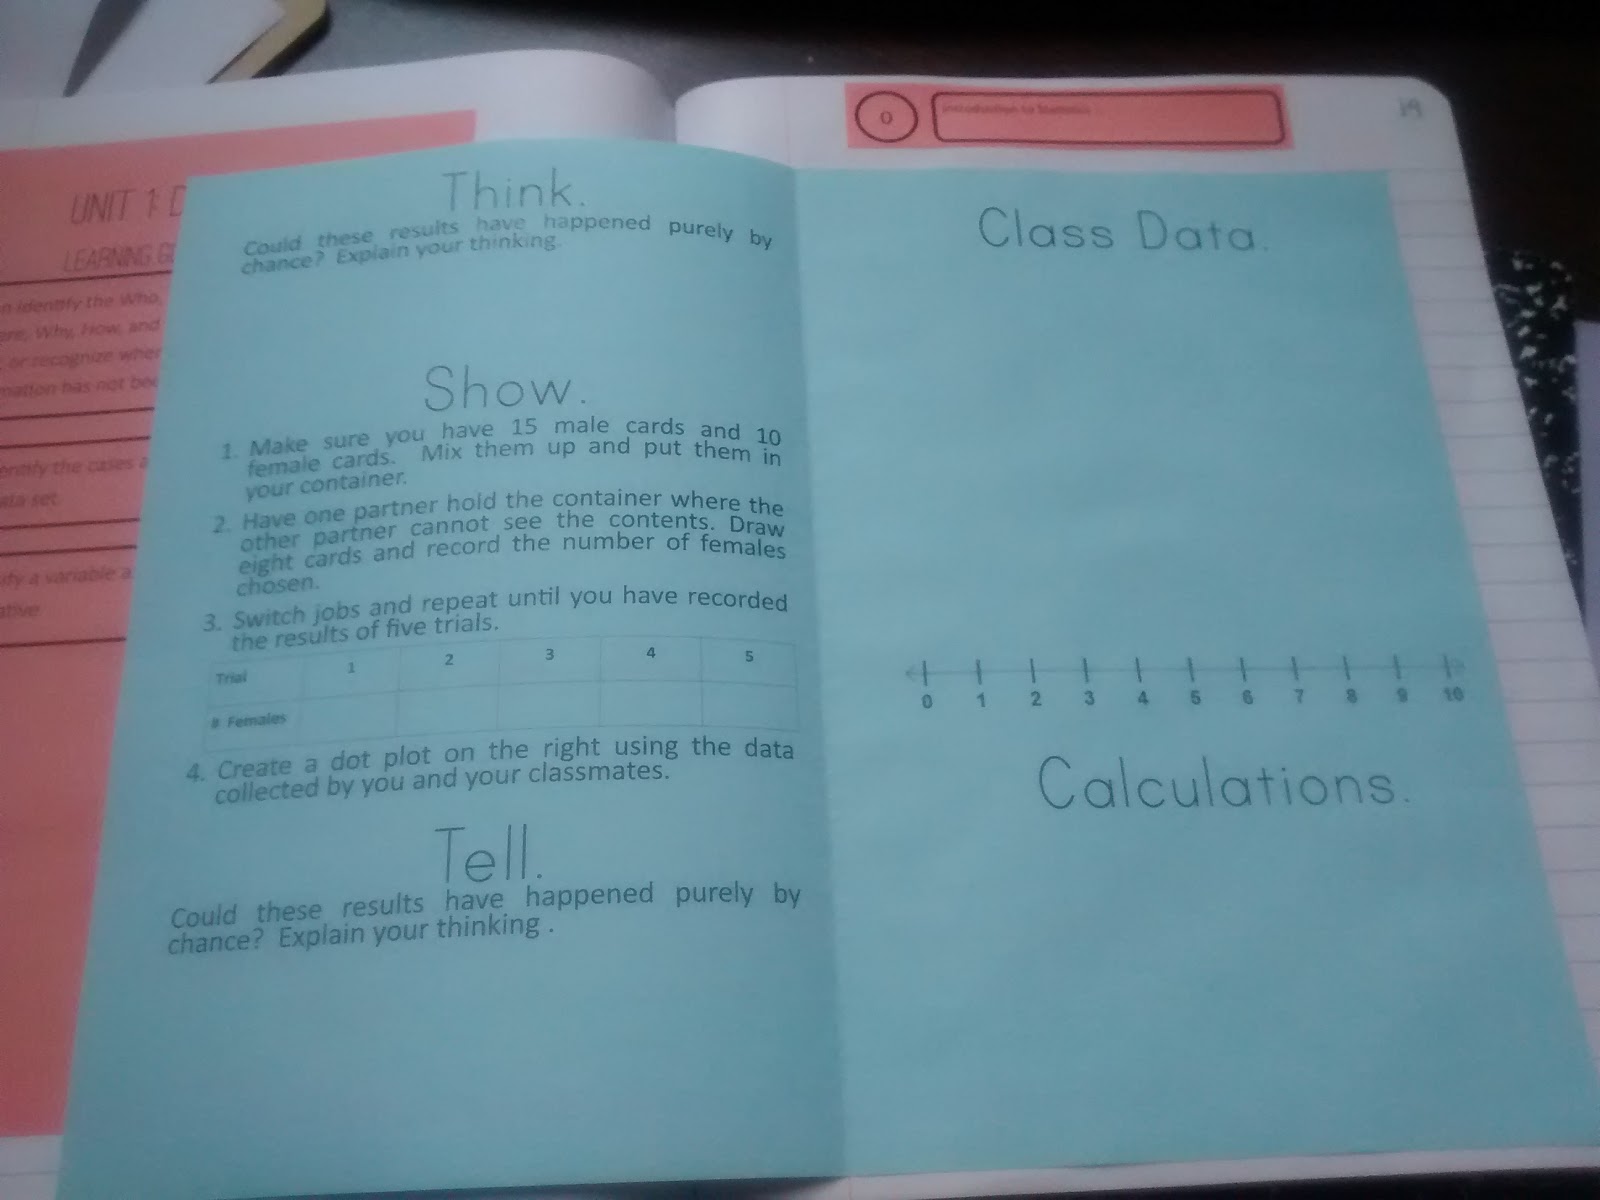
Inside of Hiring Discrimination Simulation Foldable:
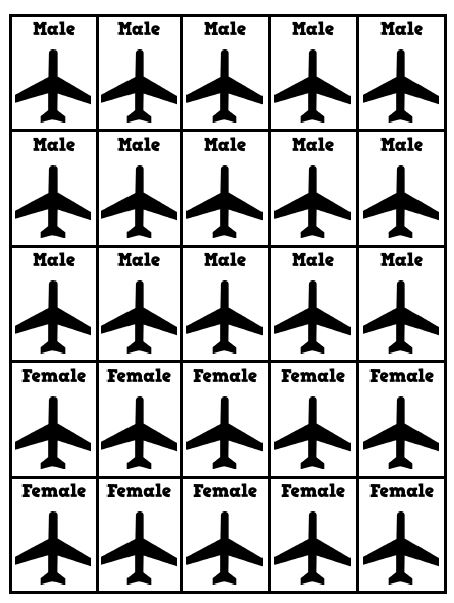
Instead of using a deck of playing cards to run the hiring discrimination simulation, I decided to make a sheet of pilot cards to print and laminate for each group.
MATH = LOVE RECOMMENDS…
A laminator is a MUST-HAVE for me as a math teacher! I spent my first six years as a teacher at a school with a broken laminator, so I had to find a way to laminate things myself.
I’ve had several laminators over the years. I currently use a Scotch laminator at home and a Swingline laminator at school.
I highly recommend splurging a bit on the actual laminator and buying the cheapest laminating pouches you can find!
I love finding excuses to laminate things!
Each group got a bowl of cards to run their hiring discrimination simulation. Well, they first had to cut their cards and put them in the bowl. Next time I teach stats, the cards will already be cut, and they’ll just get a bowl of cards.
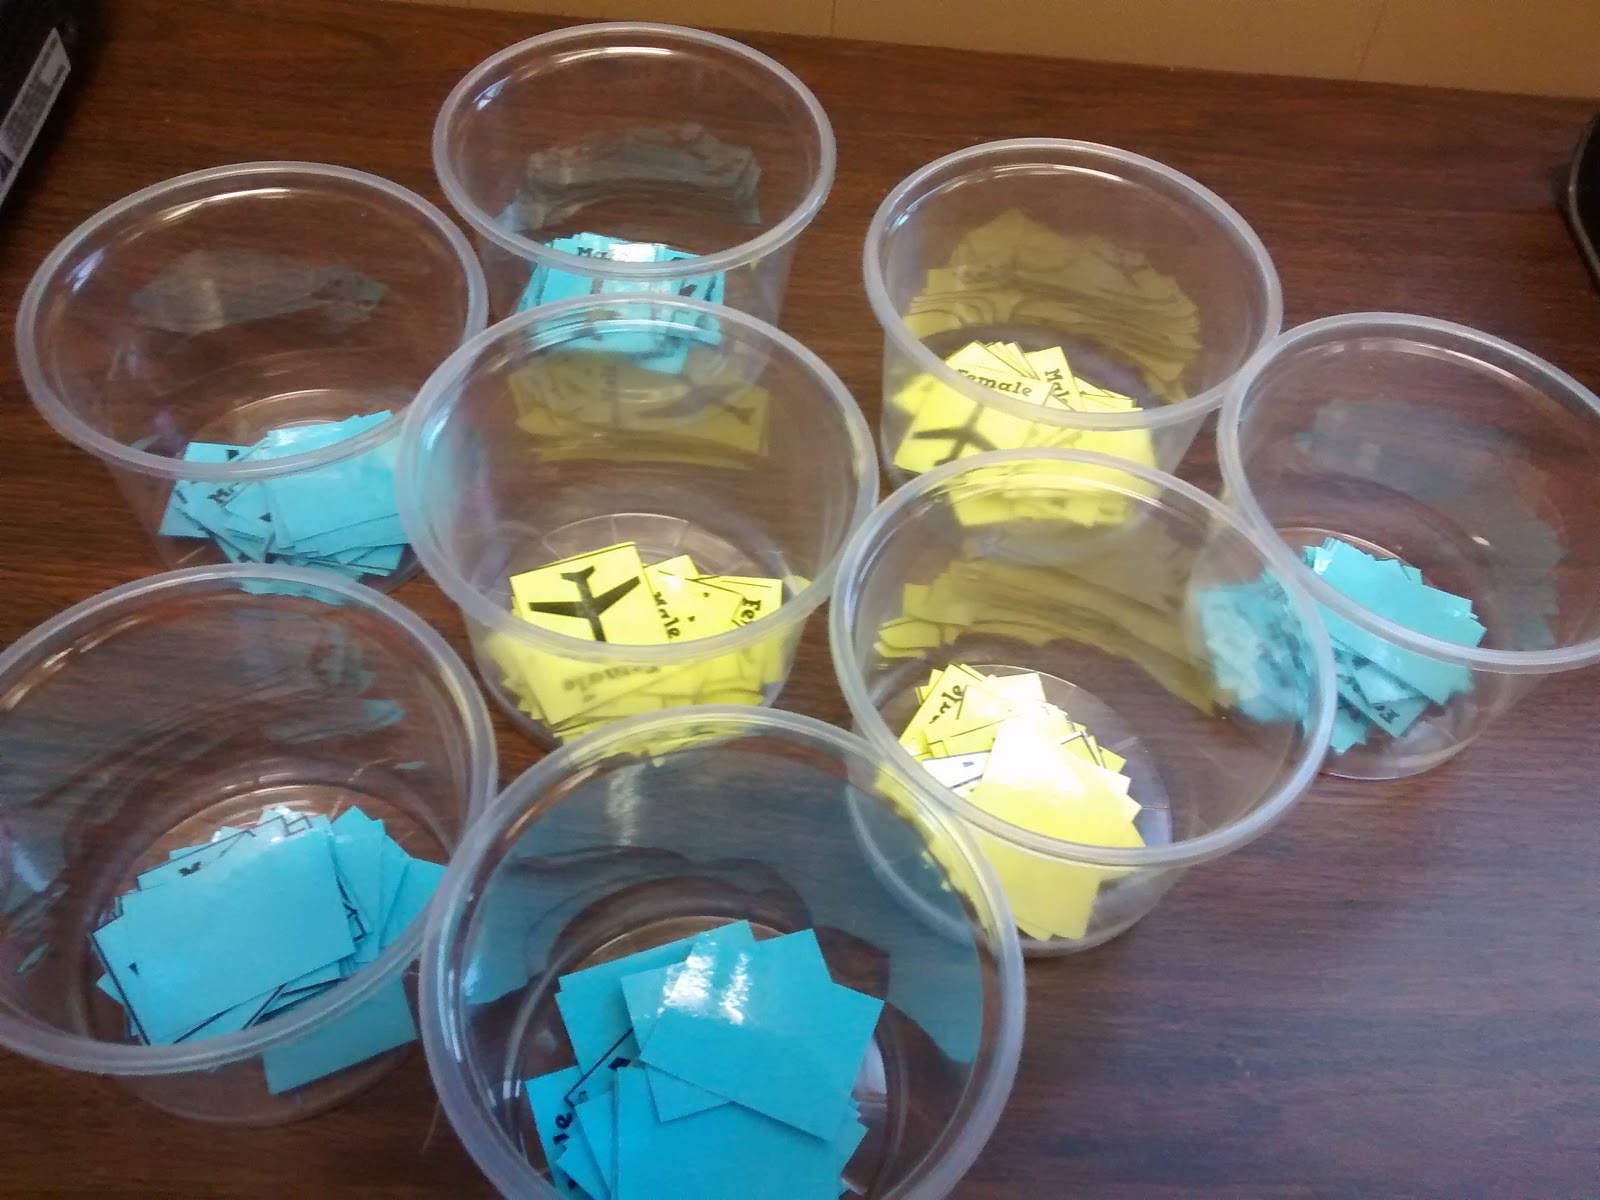
They pulled out eight cards to simulation the random picking of the eight pilots.
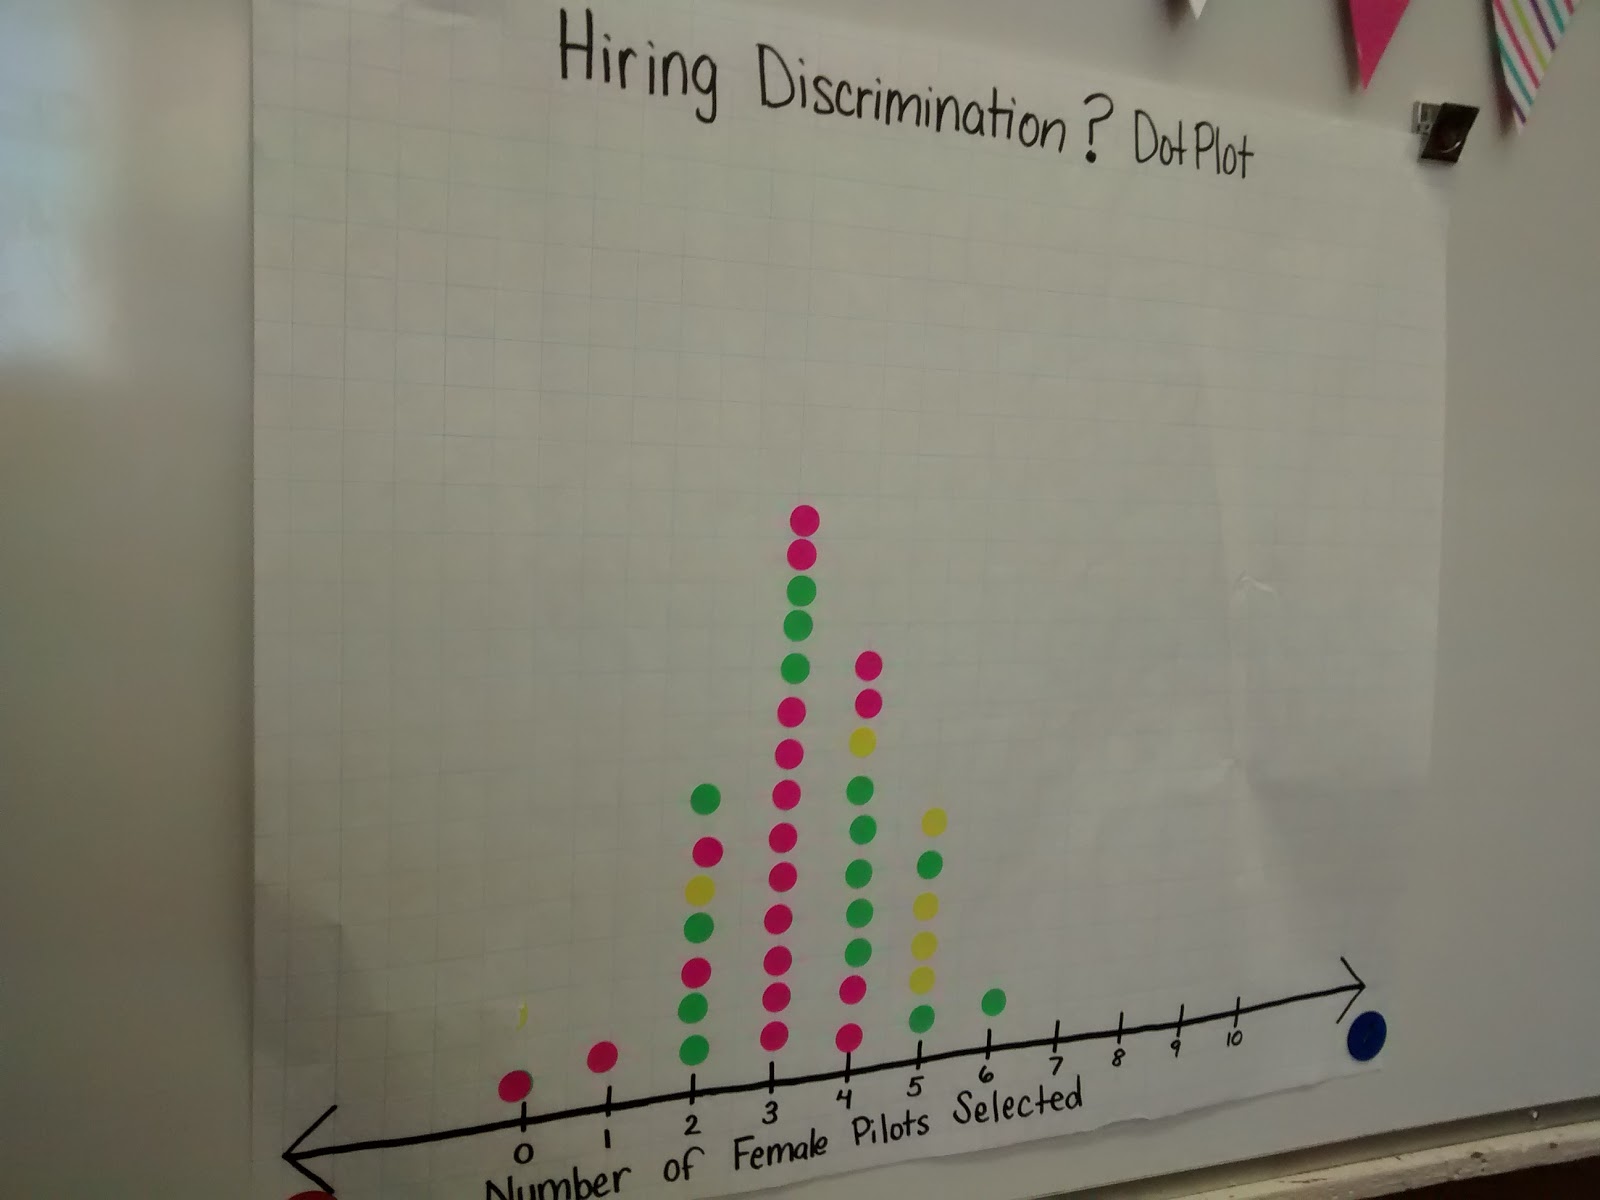
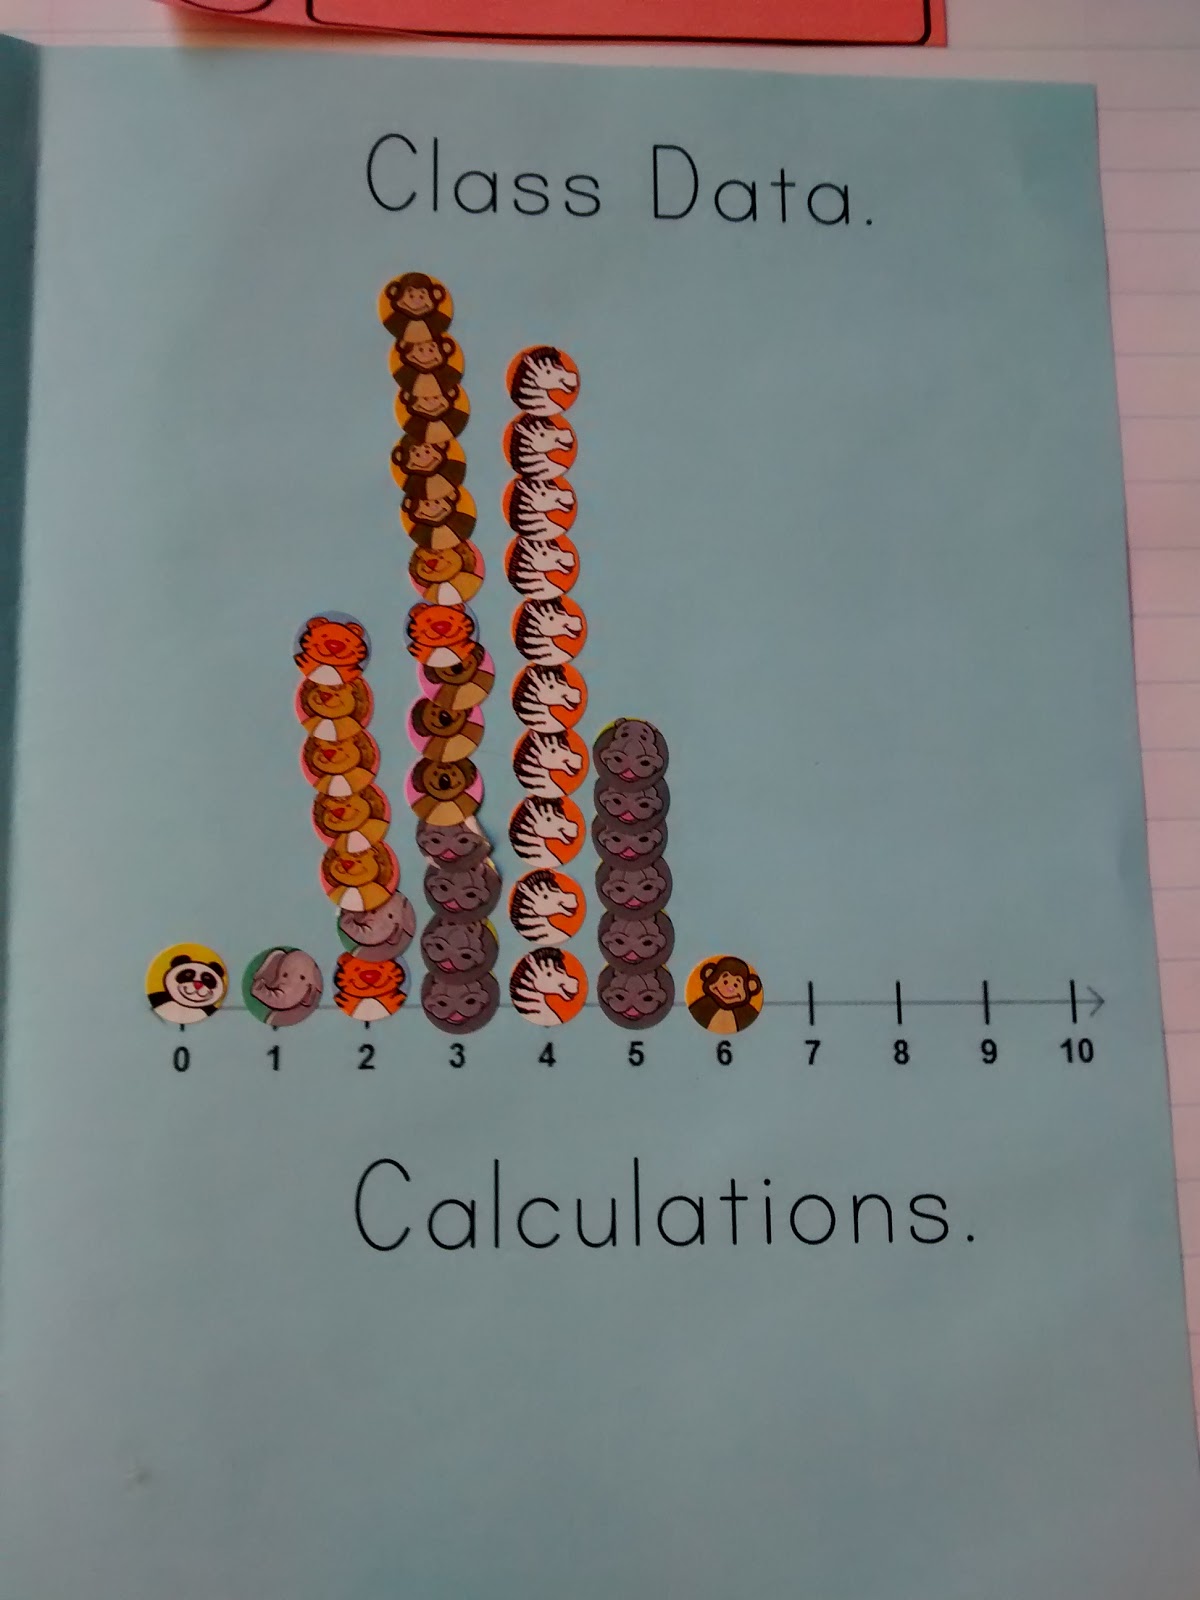
After a group completed their five simulations, I gave them a sheet of circle stickers and asked them to make a dotplot using our Pacon Easel Pad. Here was our class results:
Students then had to copy the class dotplot into their notes. One girl asked if she could use stickers there, too. Of course!
I was a bit disappointed with how little my students wanted to critically think through the scenario to decide if discrimination was present or not. It seemed like they just wanted to guess and not use statistics or math of any sort to back up their hunches.
I guess this does mean the activity gave me insight into how my students would likely approach our study of statistics. Getting my students to write out a full sentence with fully explained thinking for the TELL section was difficult.
This has proved true for the entire year. My students hate to write and explain.
I do think this was a worthwhile activity to start out the year!
Hiring Discrimination Simulation Activity Files
Click here to SAVE the file to your device.
Male and Female Pilot Cards (PDF)
2628 saves – 39.02 KB
Your stats activities are great! I was just curious though, are you teaching AP statistics or regular statistics?
Thanks! It's a non-AP stats class, but we're just working through an AP stats book at a super slow pace.
Fun. This problem is actually based on one of the authors sons experiences. The author was the teacher for my AP Institute this summer.
That must have been an AWESOME institute!
It was great. Starnes taught my class and Tabor taught the class for those who had taught AP for at least 3 years. I plan to go again next summer. I want to get a couple of years in first before I go again. It's only 40 minutes from my house for one of the national institutes.
It was great. Starnes taught my class and Tabor taught the class for those who had taught AP for at least 3 years. I plan to go again next summer. I want to get a couple of years in first before I go again. It's only 40 minutes from my house for one of the national institutes.
I used to do this with my AP Stats classes on the first day of school. We kept the dot plots and our summary poster up on the wall all year and we when we got to hypothesis tests we'd revisit the problem. I love this, and the students always loved seeing how "intuitive" stats can be, and then how we can back up our arguments "scientifically." Go you! I love your INB twist on it!
Any time my kids say they don't remember what a dot plot is, I just point to the this one that's still hanging on the wall. This makes me realize I should hang up more examples we make together!
I use this same book with my AP Stats class and I love the way you made this into a booklet!!!
Thanks! My kids need a lot of help to stay organized. If I don't give them templates like this to fill out, their work is a mess to grade!
Cool activity! Made a simulation for it on processing if interested: https://openprocessing.org/sketch/537502