Game of Greed Statistics Foldable
I want to share a statistics foldable I made for the Game of Greed. I’ve been looking for fun ways to collect quantitative data in my statistics class. Let’s just say my students are tired of surveys of how many siblings they have or how many states they’ve visited.

I got this Game of Greed activity from @druinok, but I’ve played a slightly different version of the game with students before called Greedy Pig.
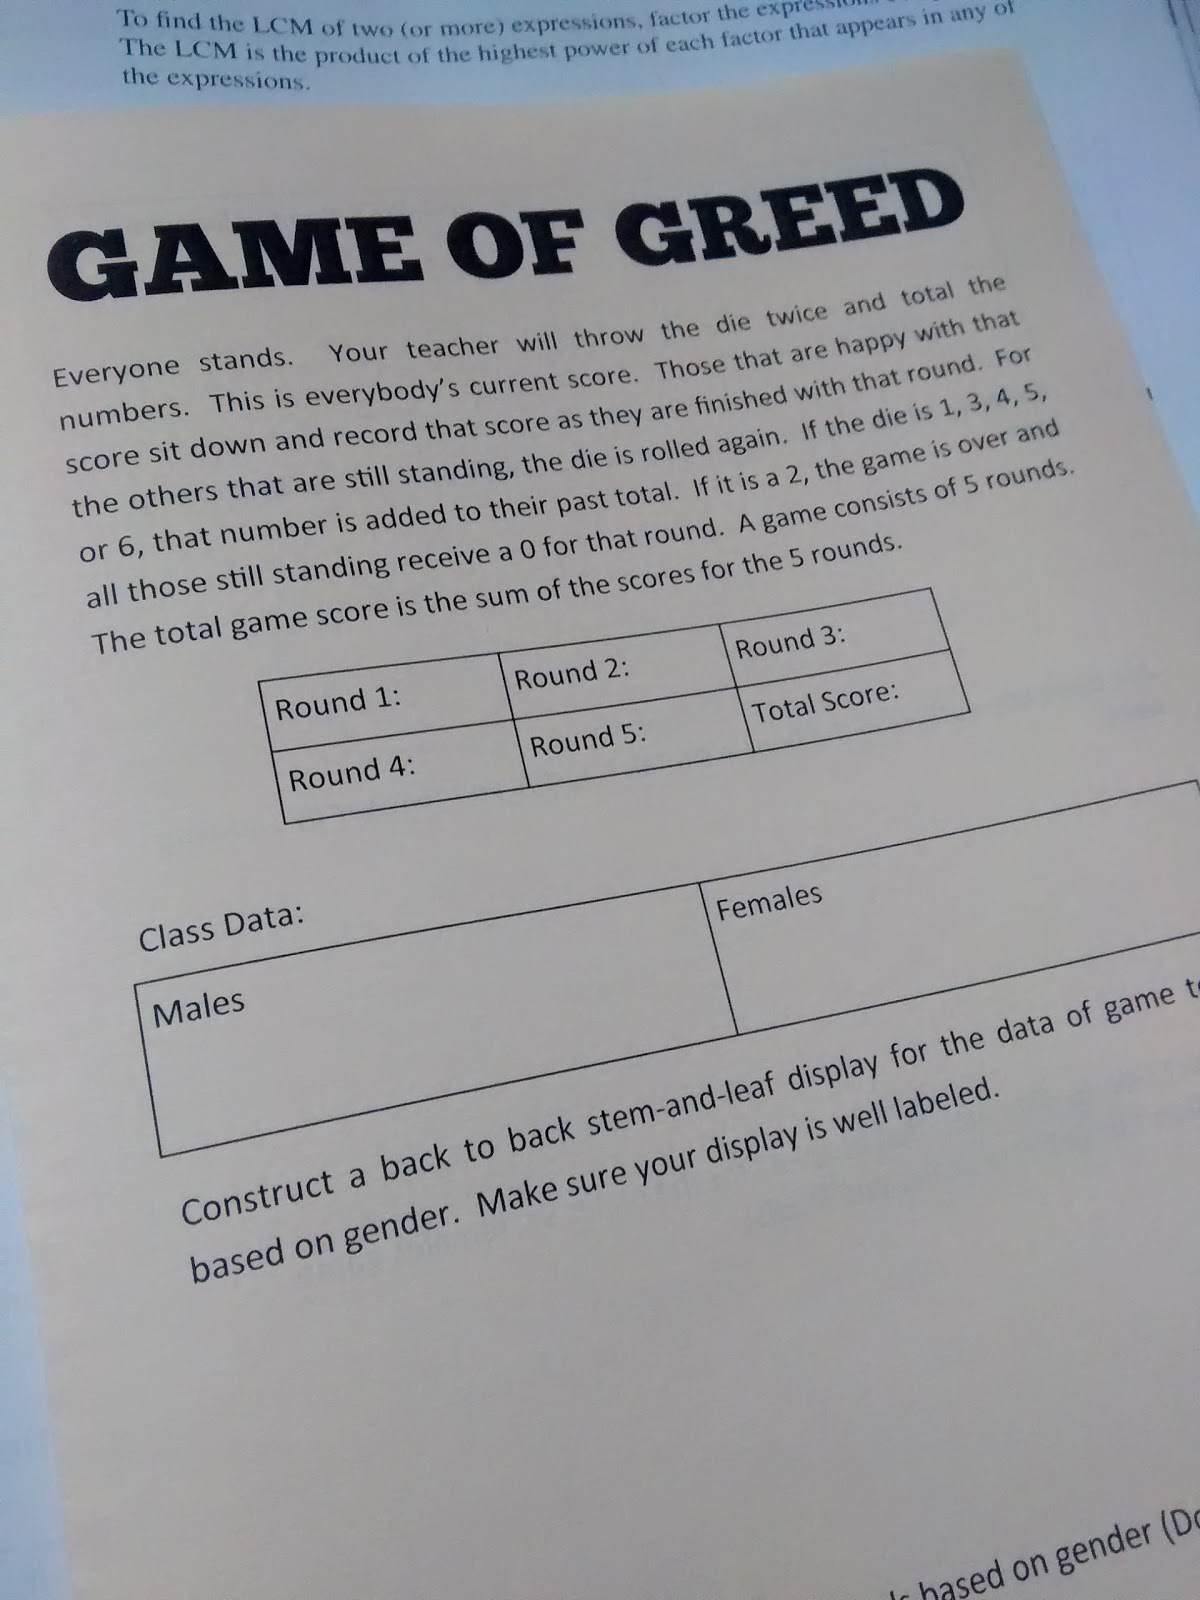
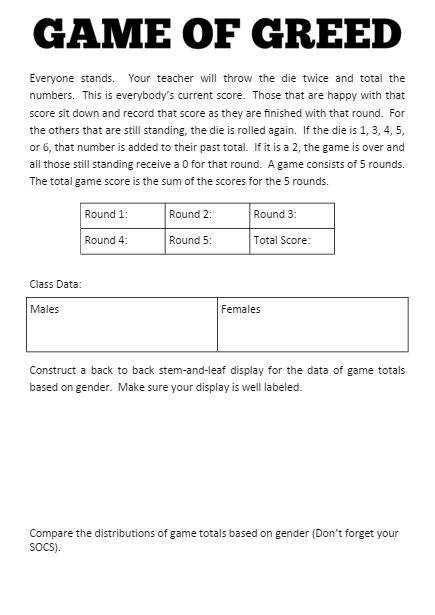
In the Game of Greed, everyone stands. Students are told that their teacher will throw the die twice and total the numbers. This is everybody’s current score.
Those that are happy with that score sit down and record that score as they are finished with that round. For the others that are still standing, the die is rolled again. If the die is 1, 3, 4, 5, or 6, that number is added to their past total.
If it is a 2, the game is over and all those still standing receive a 0 for that round.
A game consists of 5 rounds. The total game score is the sum of the scores for the 5 rounds.
Want to know what made the activity? We didn’t just roll any die. We rolled this jumbo blow-up die that a coworker gave me last year.

I created a booklet foldable that my students will record their data on and glue into their statistics interactive notebooks.
Once we had collected our class data, the students recorded the class data on their foldable. I had them break the data down by males vs females. Then, students were tasked with constructing a back-to-back stem-and-leaf display for the data.
They then used SOCS to compare the distributions of game totals based on gender.
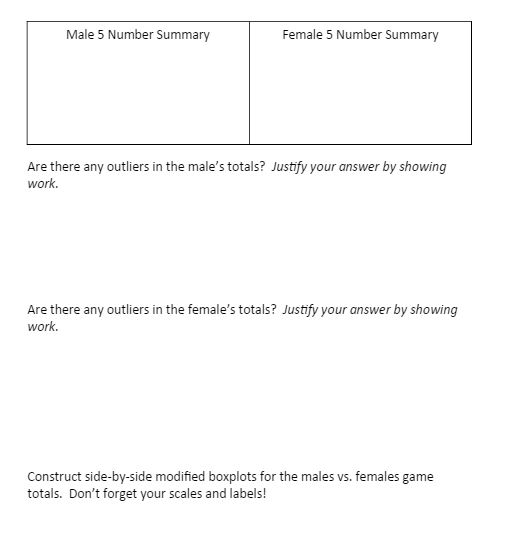
Inside their Game of Greed foldables, students found a 5 number summary for both the male and female data. Next, they checked for outliers in the data and constructed side-by-side modified boxplots for the males vs females game totals.
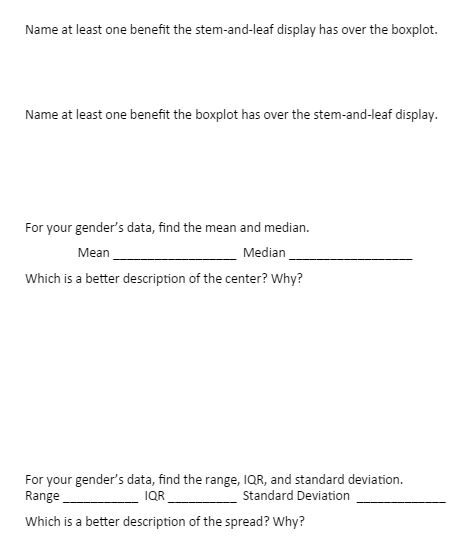
Finally, students had to name at least one benefit each display had over the other. Then, for their gender’s data students had to determine whether the mean or median was a better description of the center. They repeated the process with IQR vs standard deviation.
I was really impressed by my students’ answers to the benefits of the various types of graphs. They had been really hating on boxplots lately, but they did note that they could come in handy for various things.
My students had a lot of fun playing this game, and they seemed legitimately interested in the data analysis because they wanted to know if boys or girls were better at the game.
Of course, I had a group of boys decide they were all going to stay in/go out at the same time, so that definitely influenced our data.
They’ve also wanted to keep playing with the die ever since. I can’t exactly just stick this thing in the cabinet to keep it hidden away…