Statistics Interactive Notebook Pages 2015-2016
This blog post contains Amazon affiliate links. As an Amazon Associate, I earn a small commission from qualifying purchases.
Have you ever wondered what an entire interactive notebook looks like? Today I want to share with you one of my student’s notebooks from last year’s statistics class. I didn’t do the best job of blogging all my notebook pages last year. I blame it on the craziness of getting married last school year!
Many of these pages should look familiar because I did blog about some of them!
These notebook pages are based off of an older edition of BVD’s Stats Modeling the World textbook.
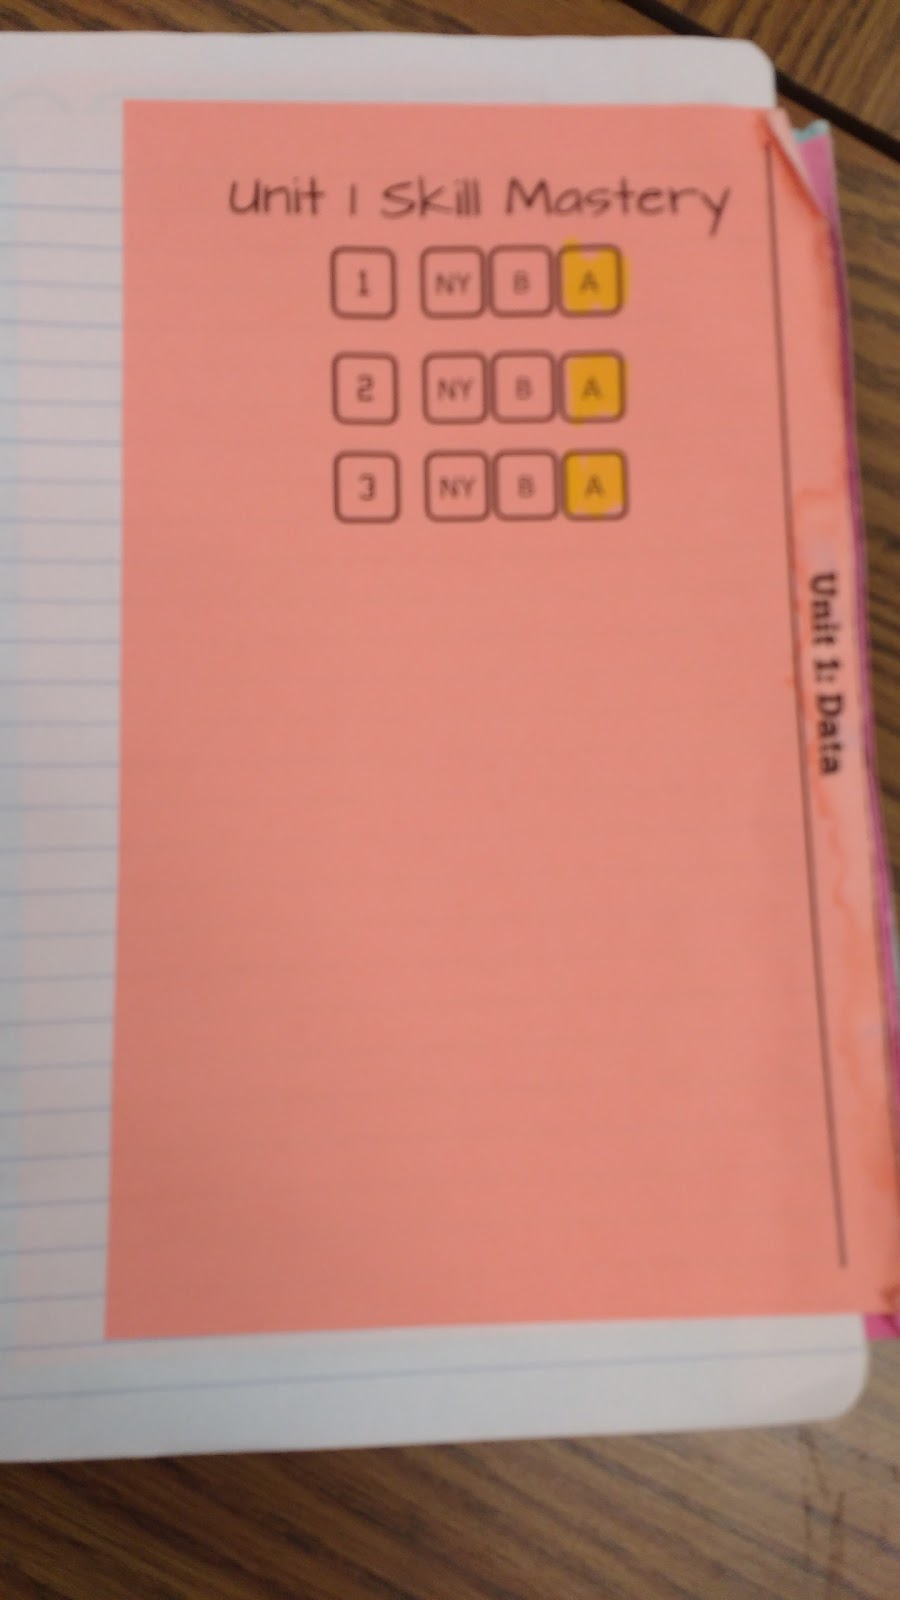
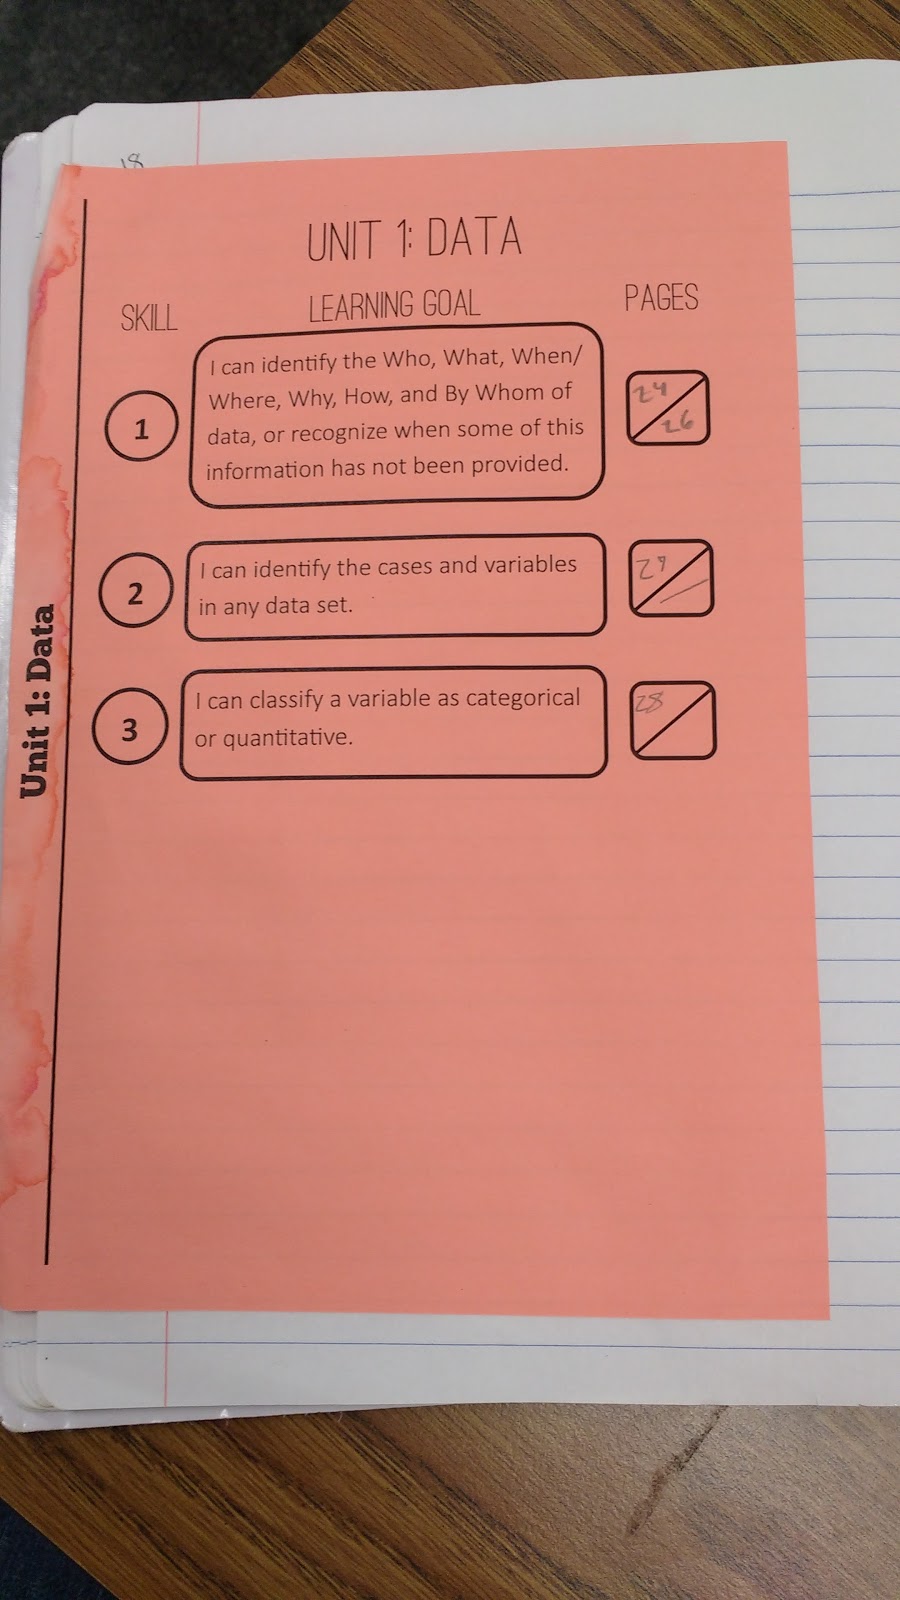
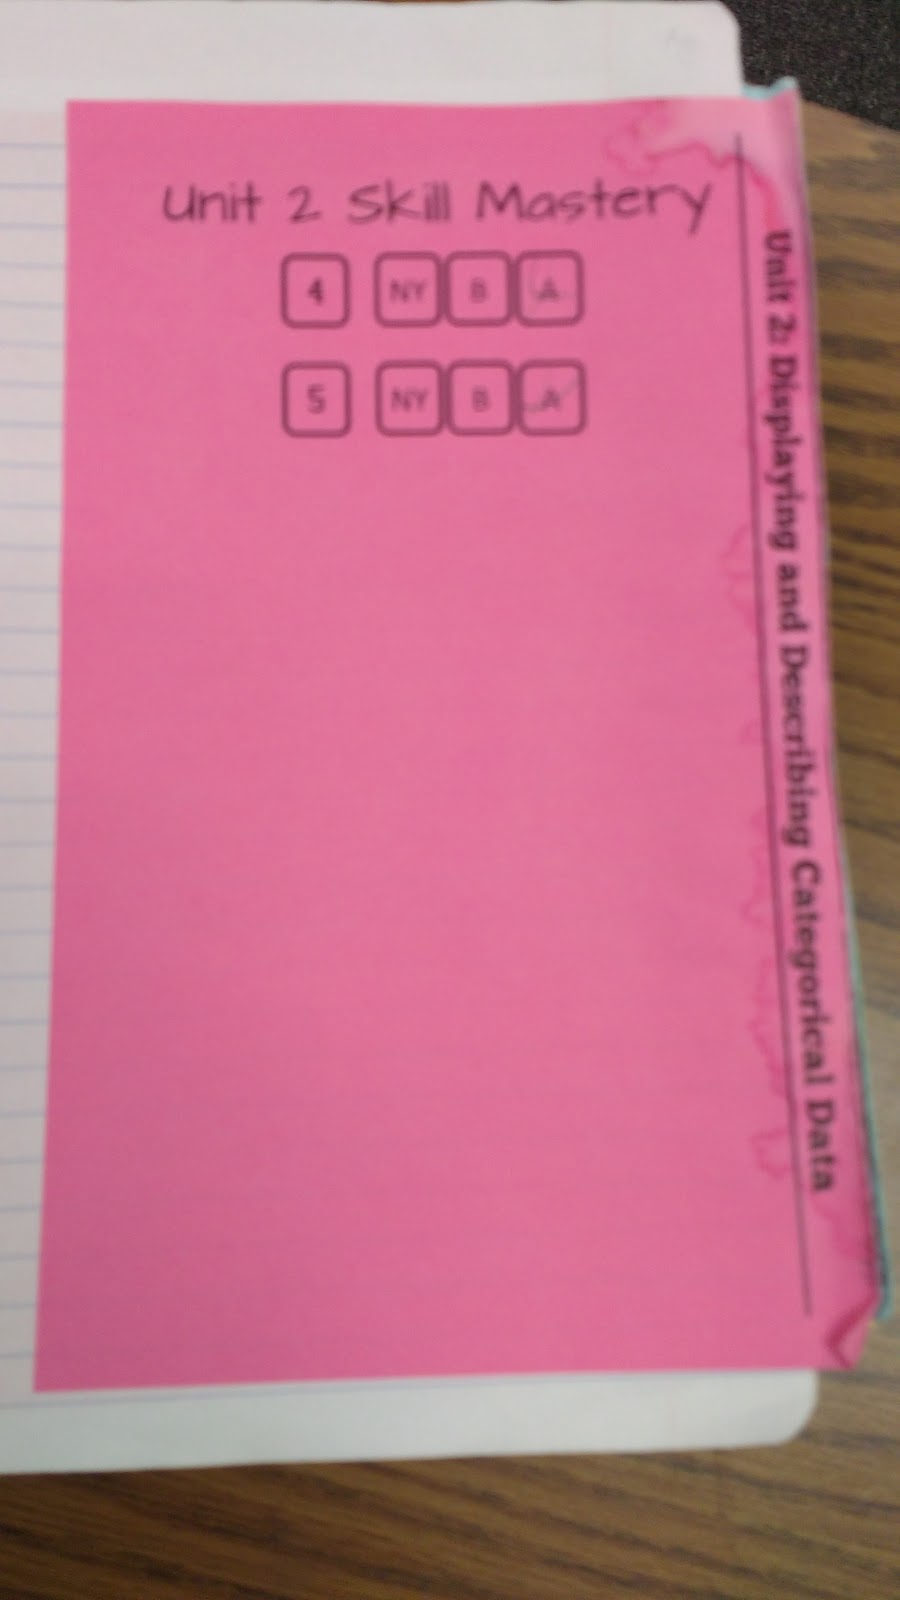
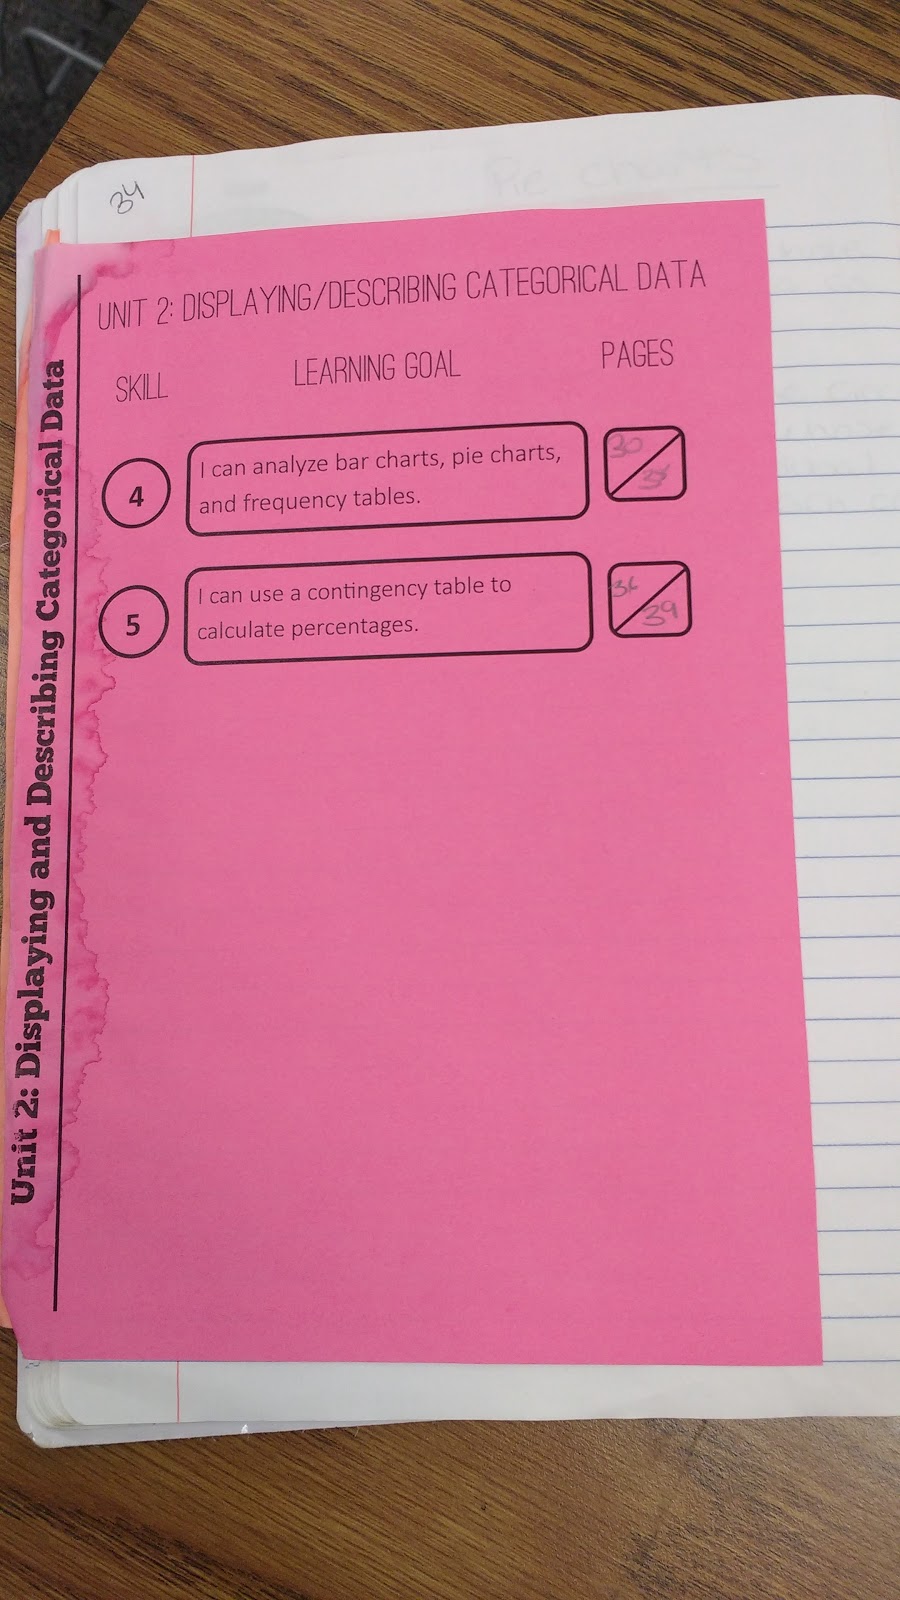
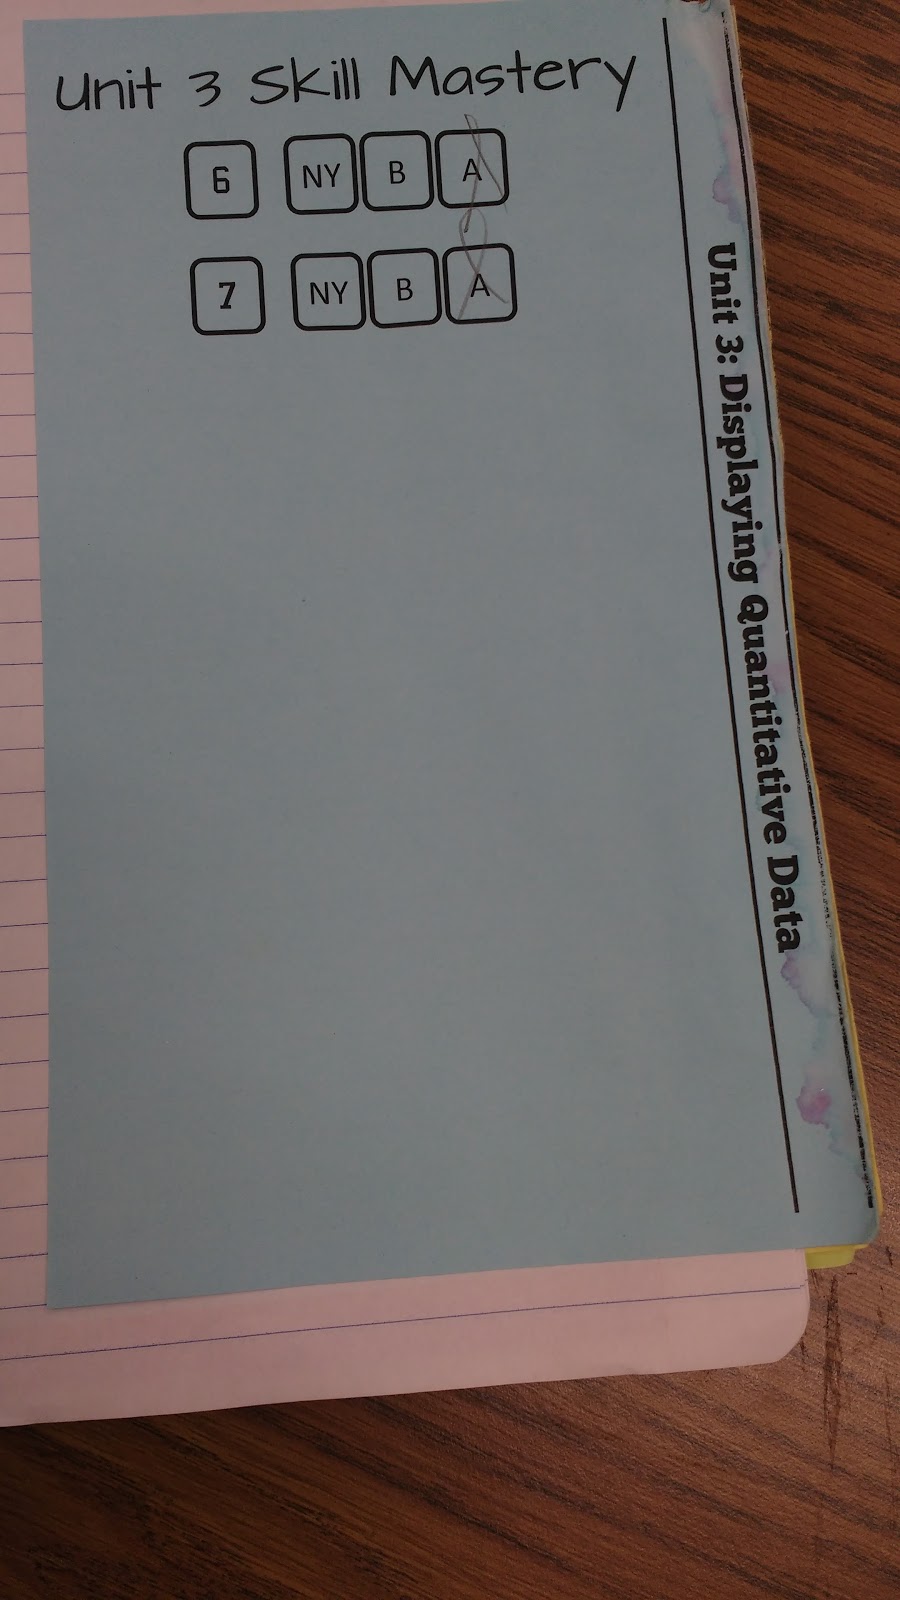
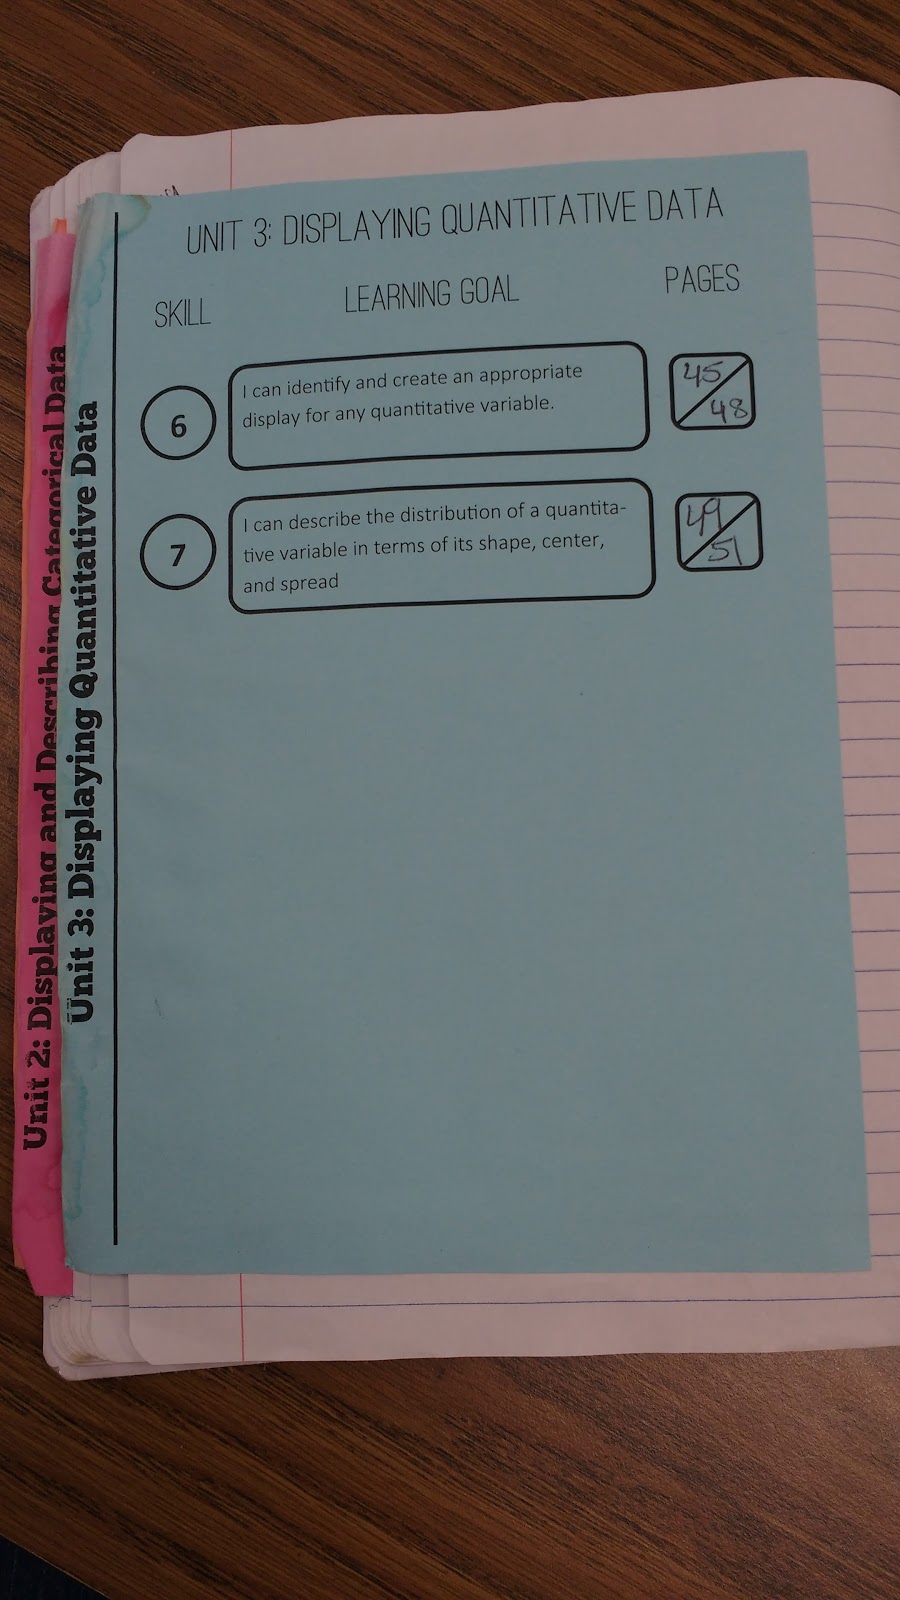
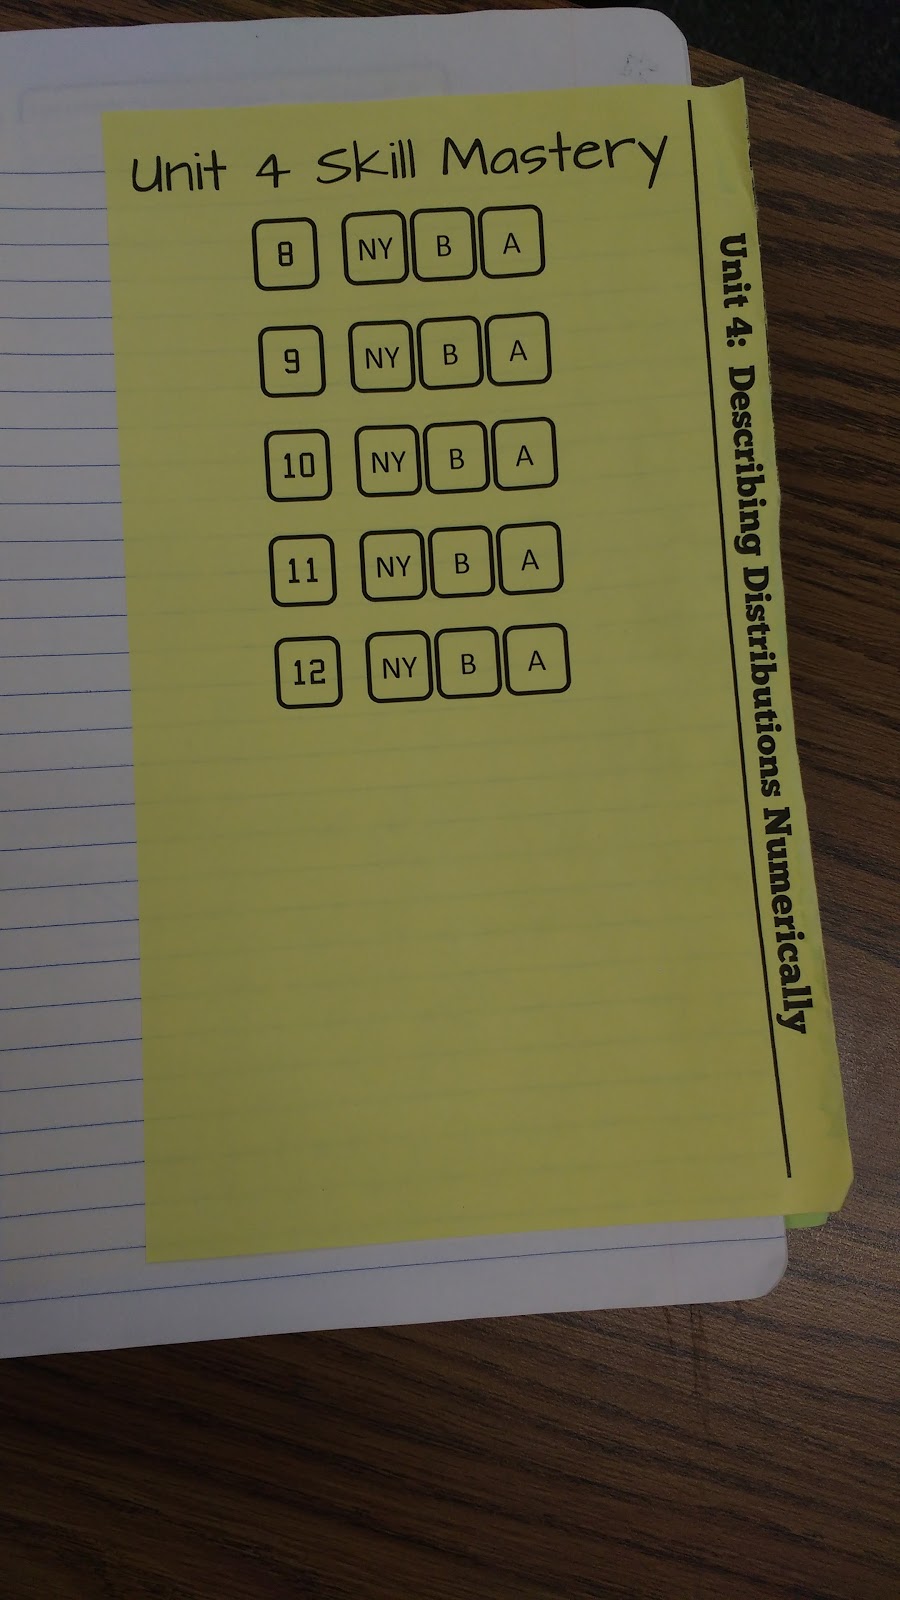
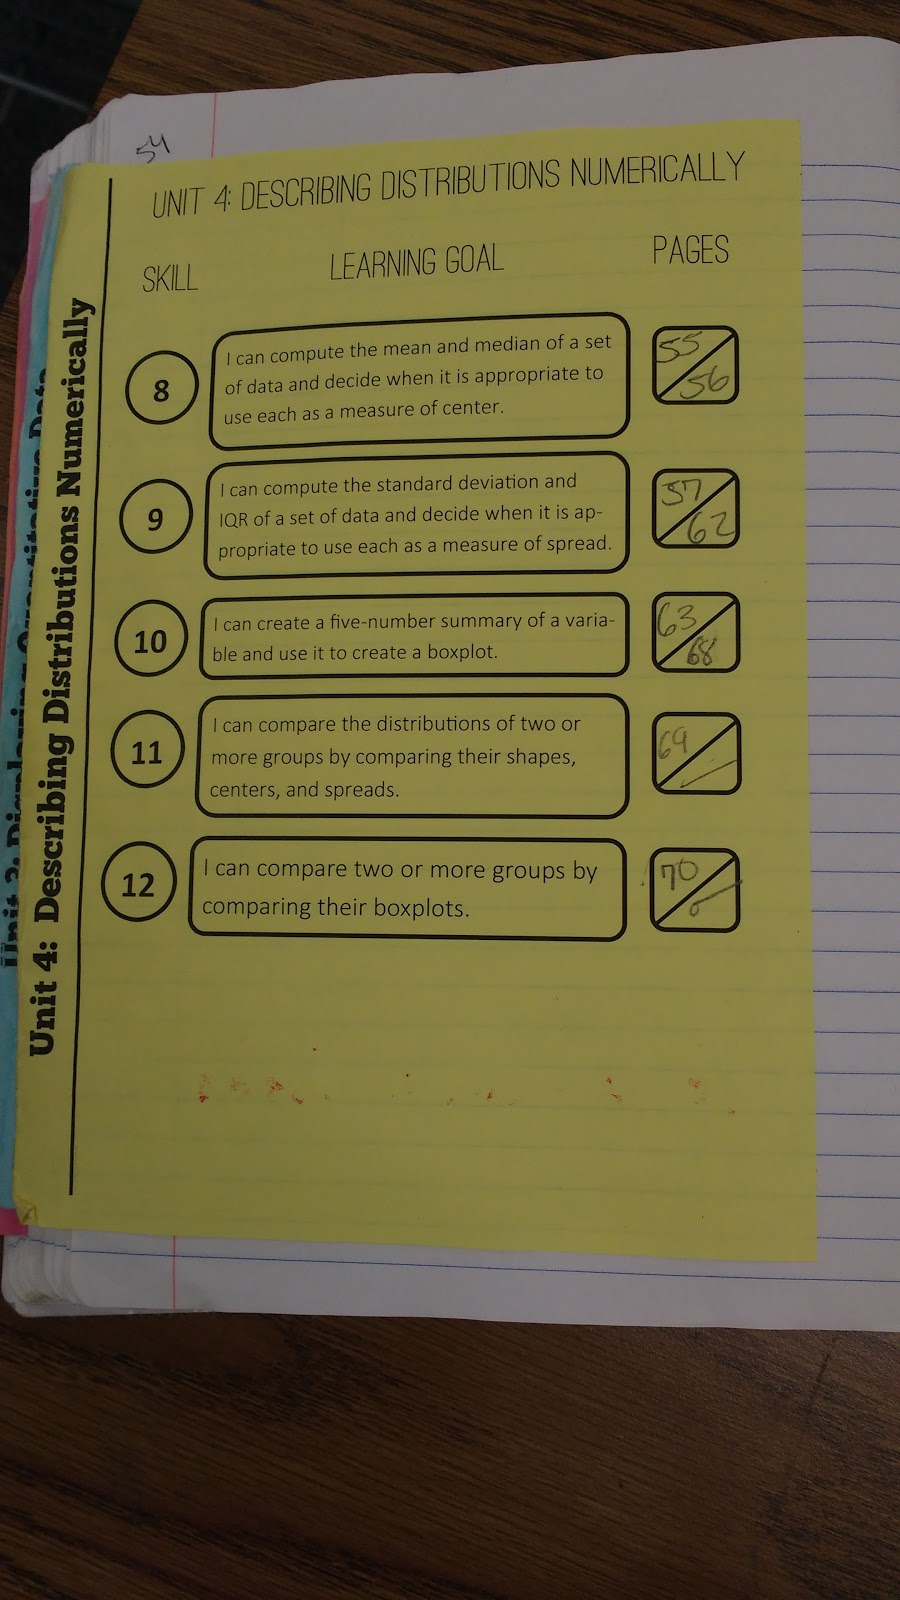
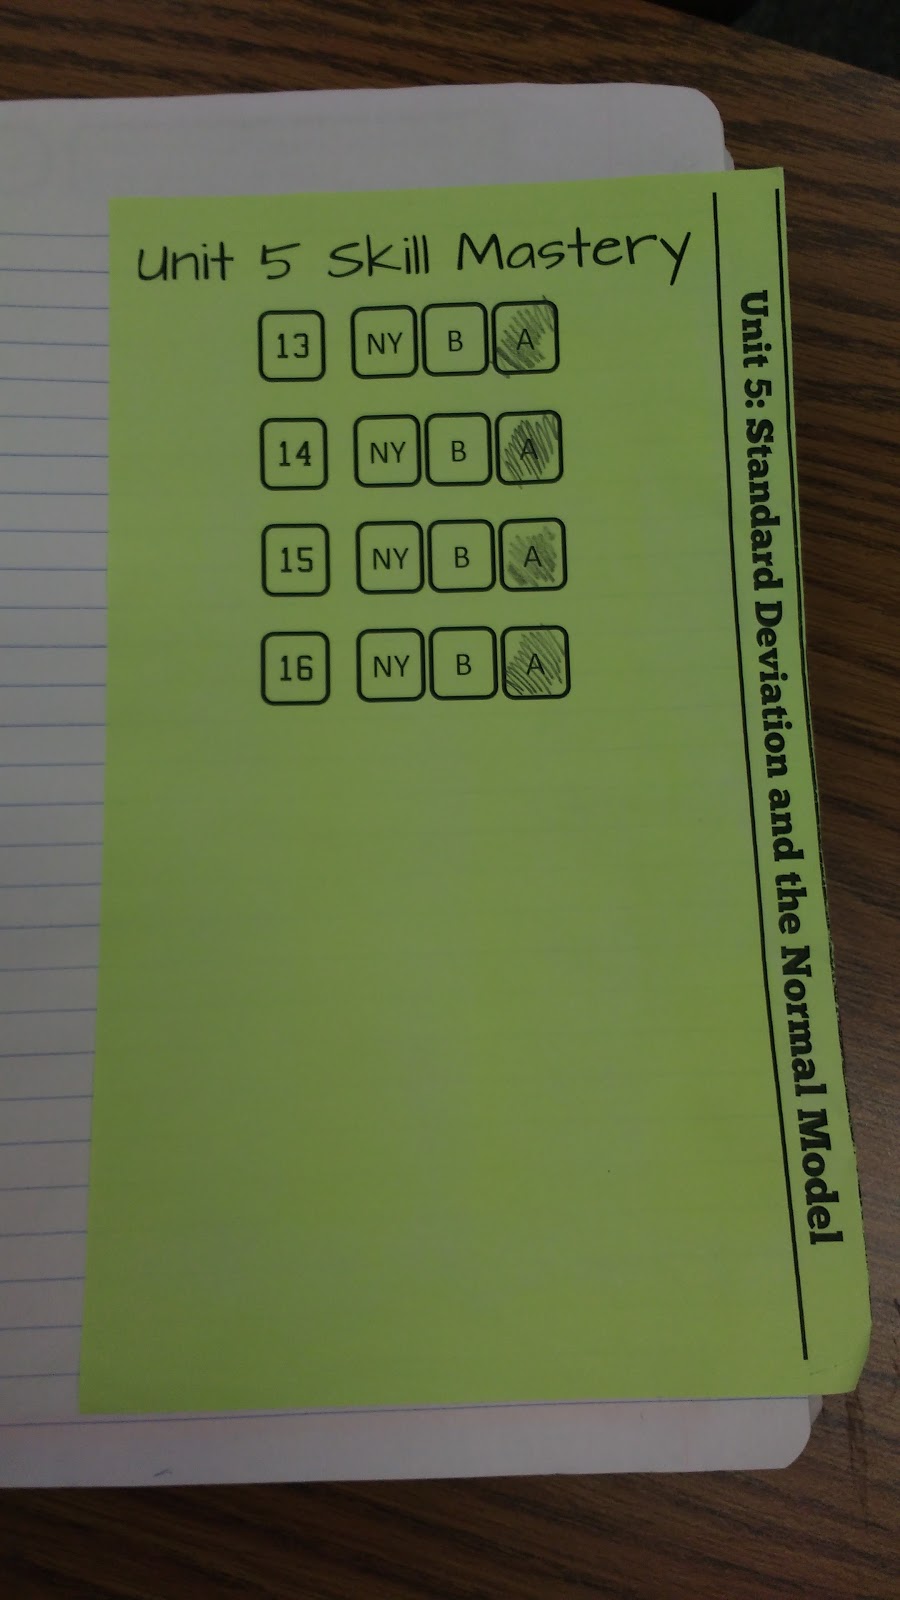
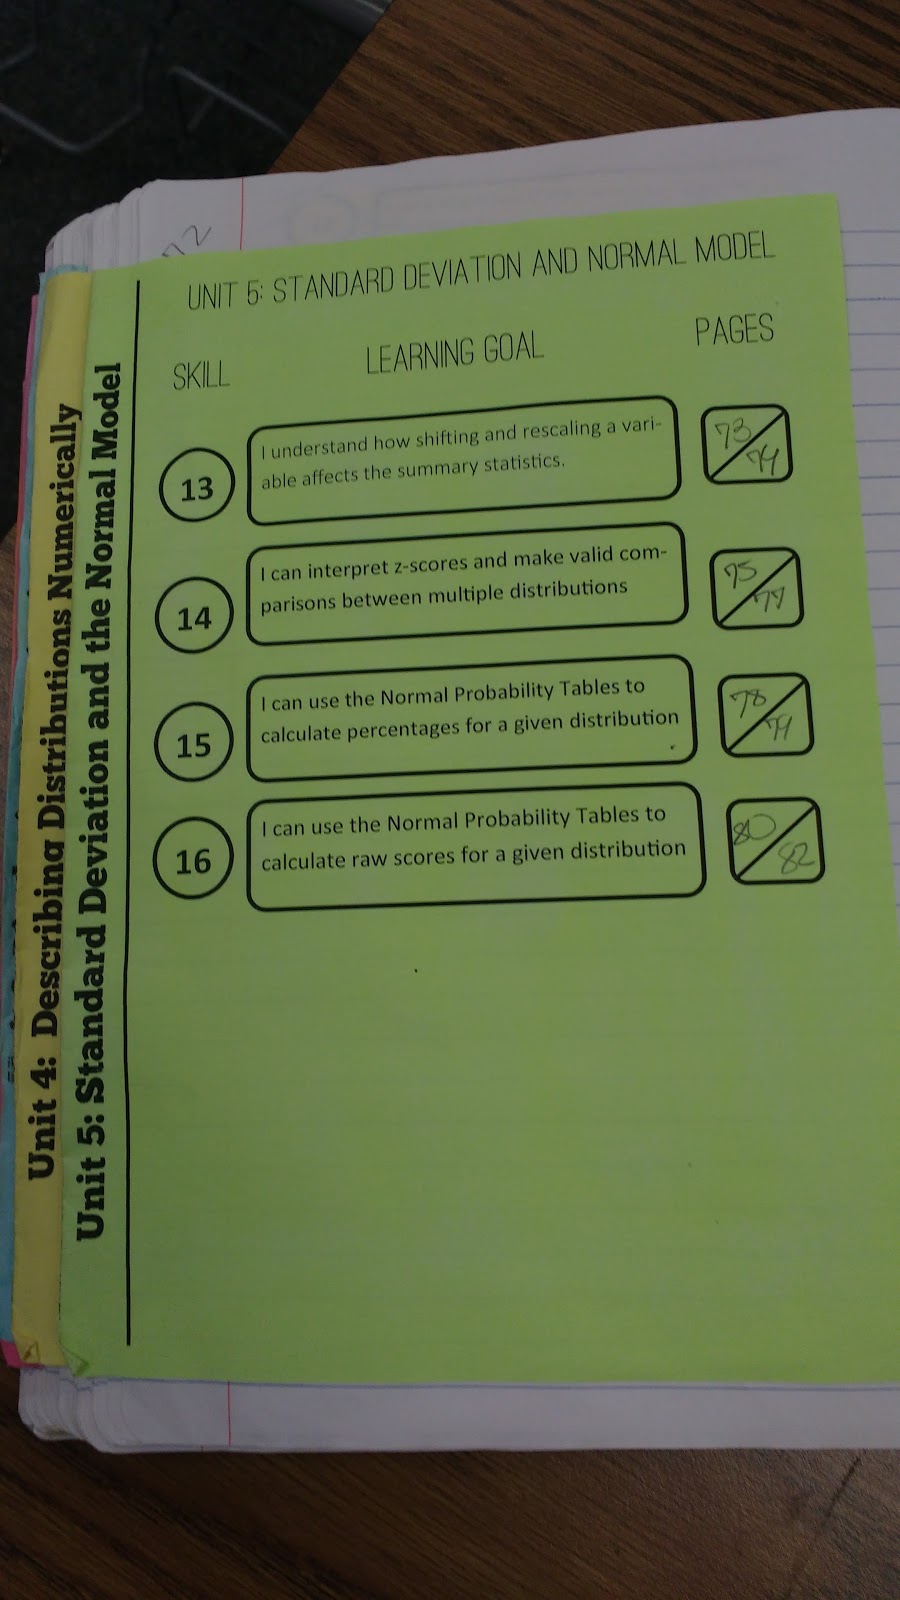
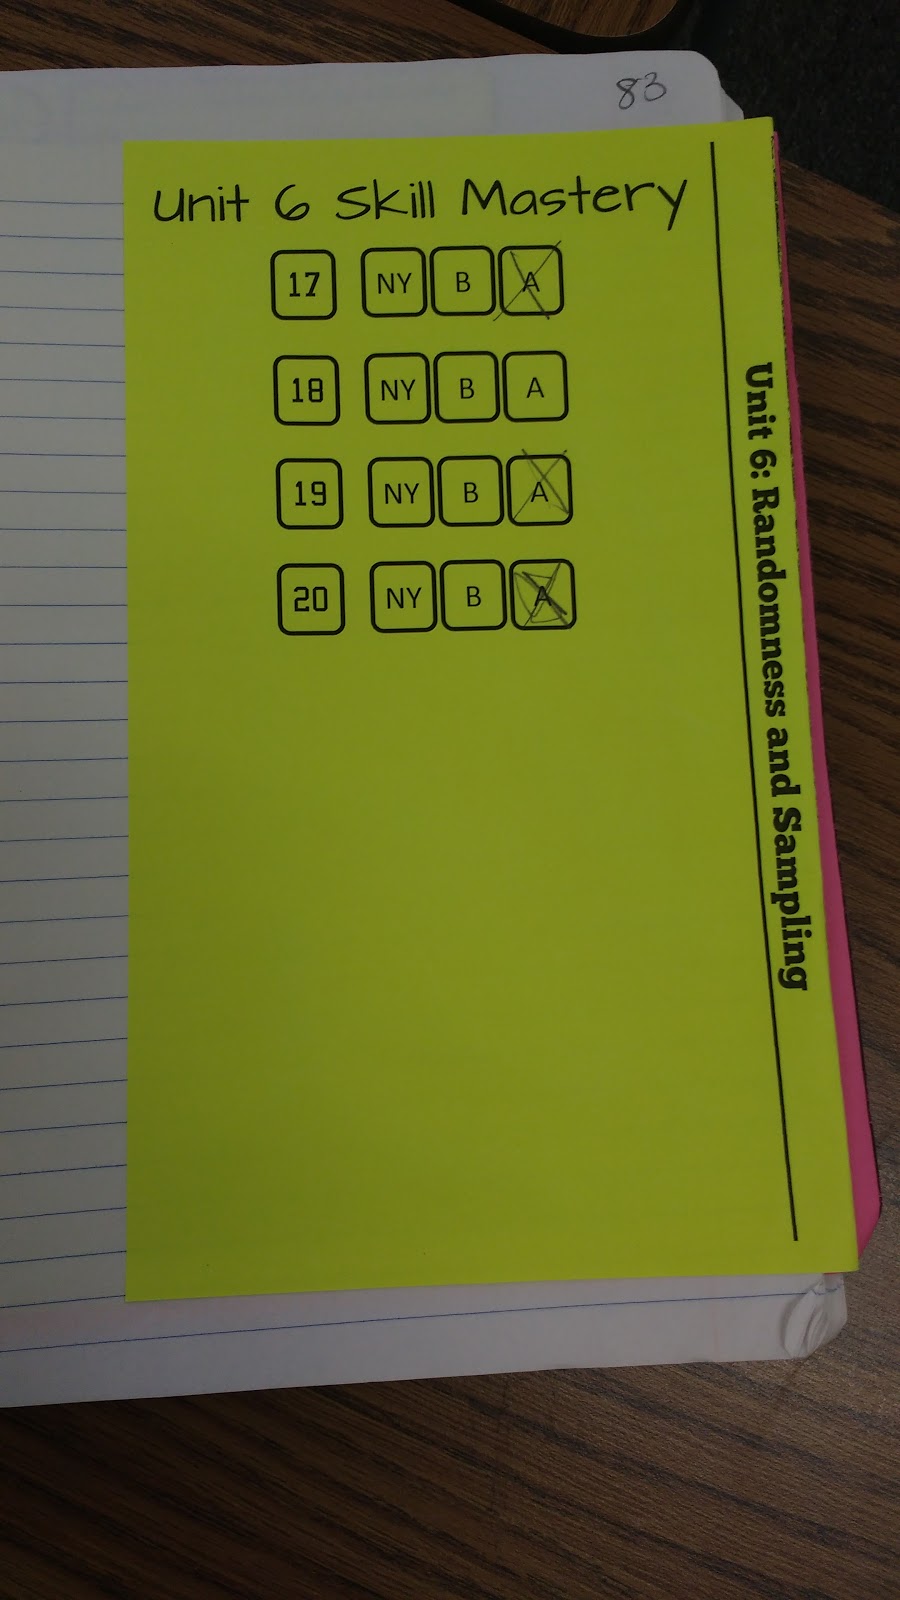
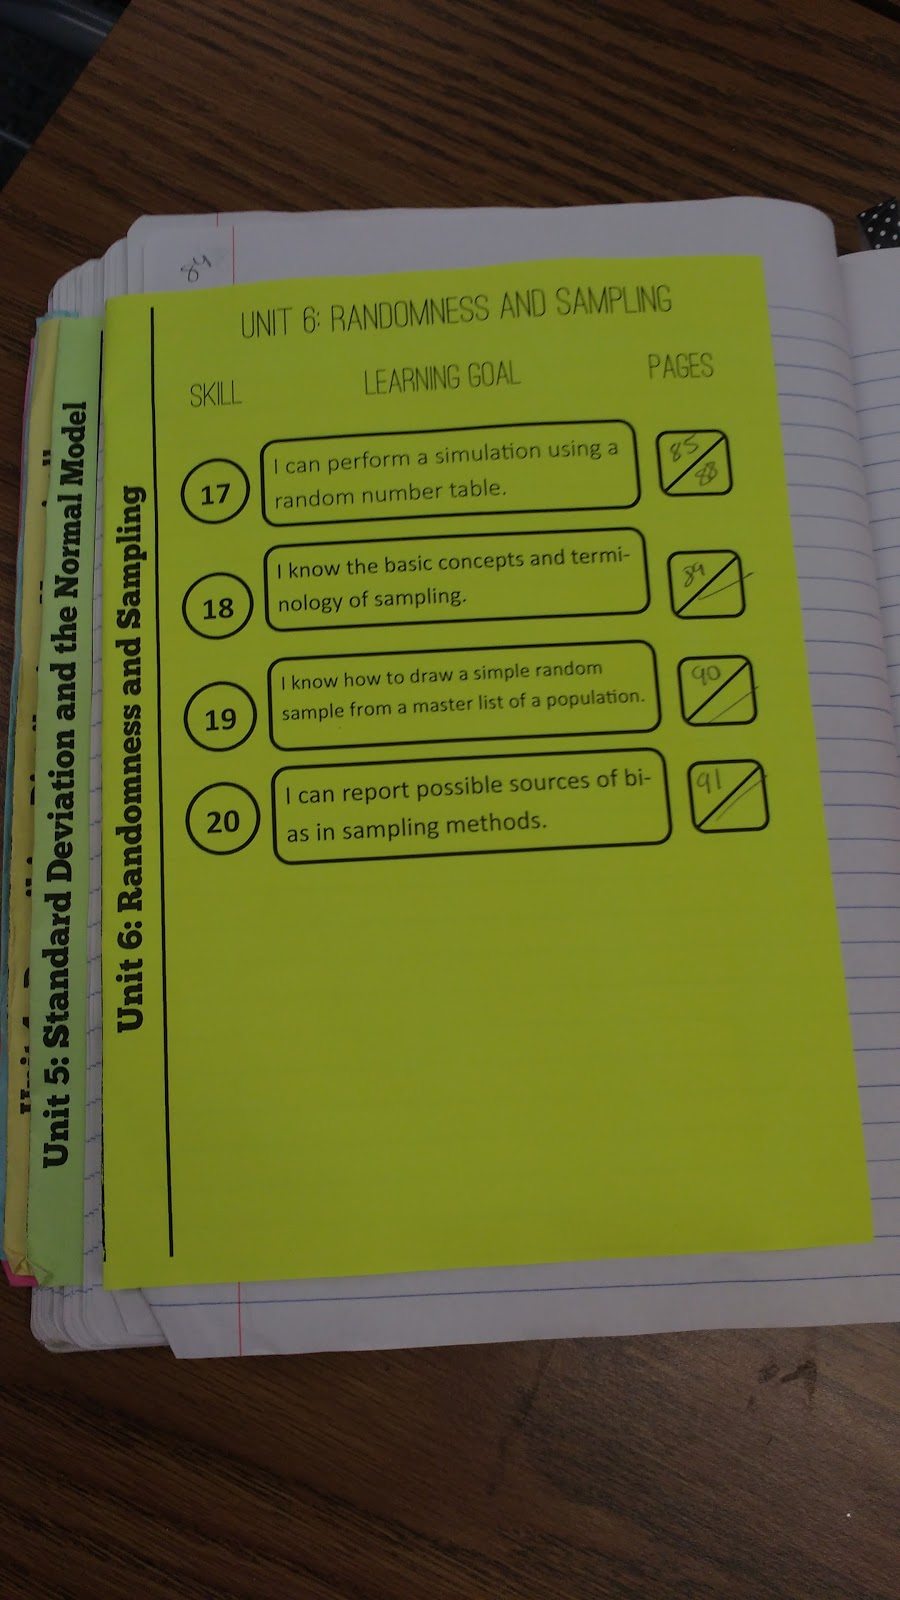
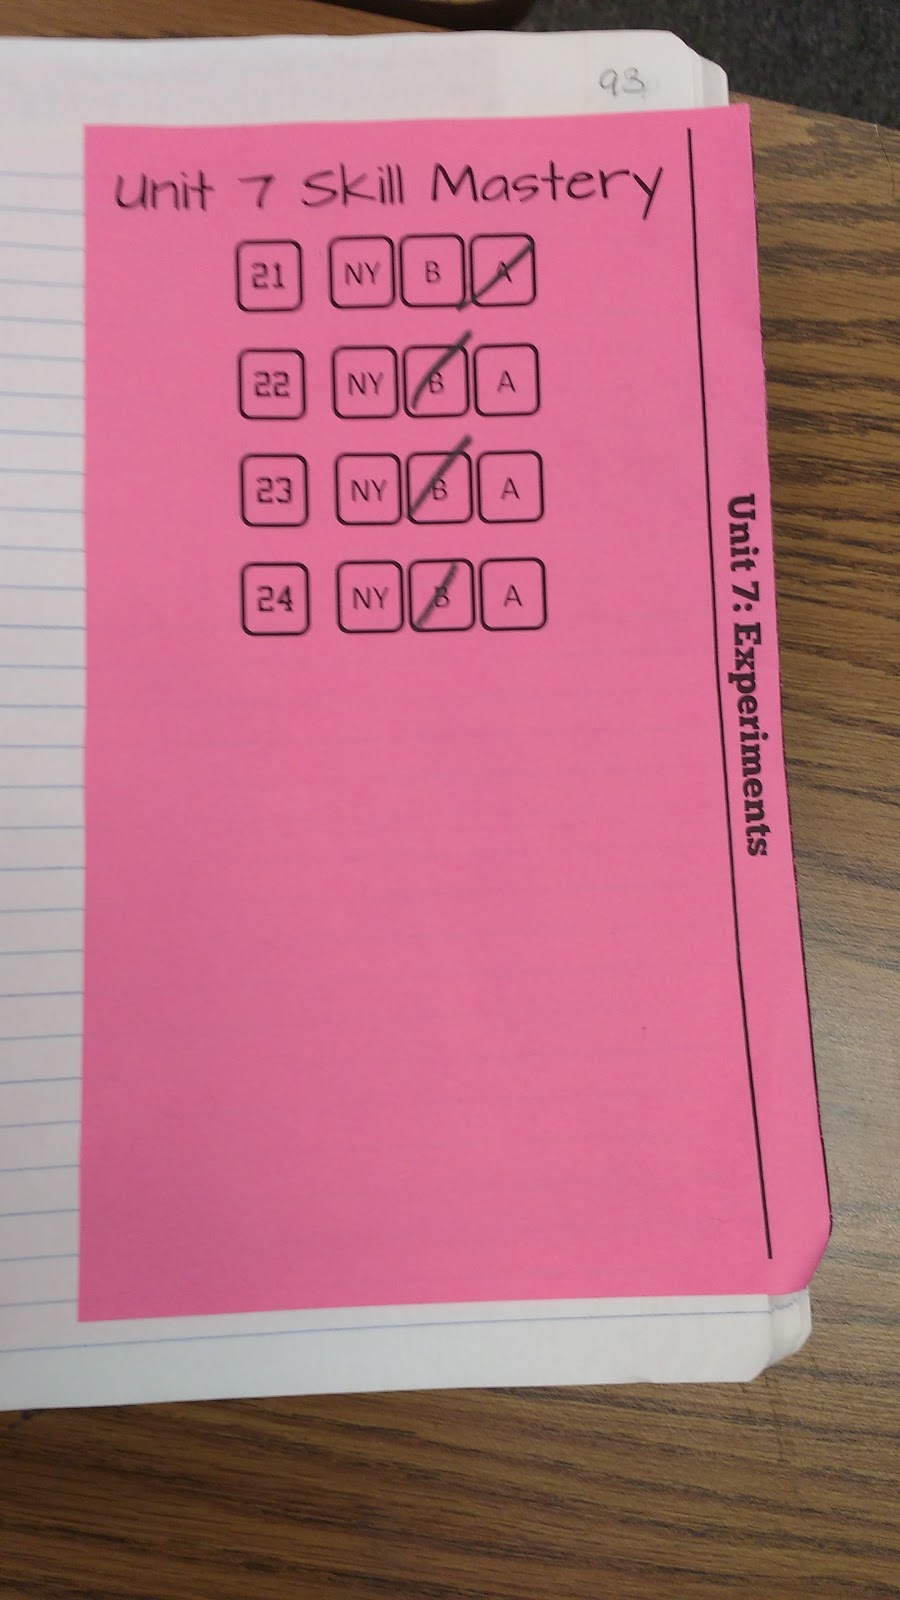
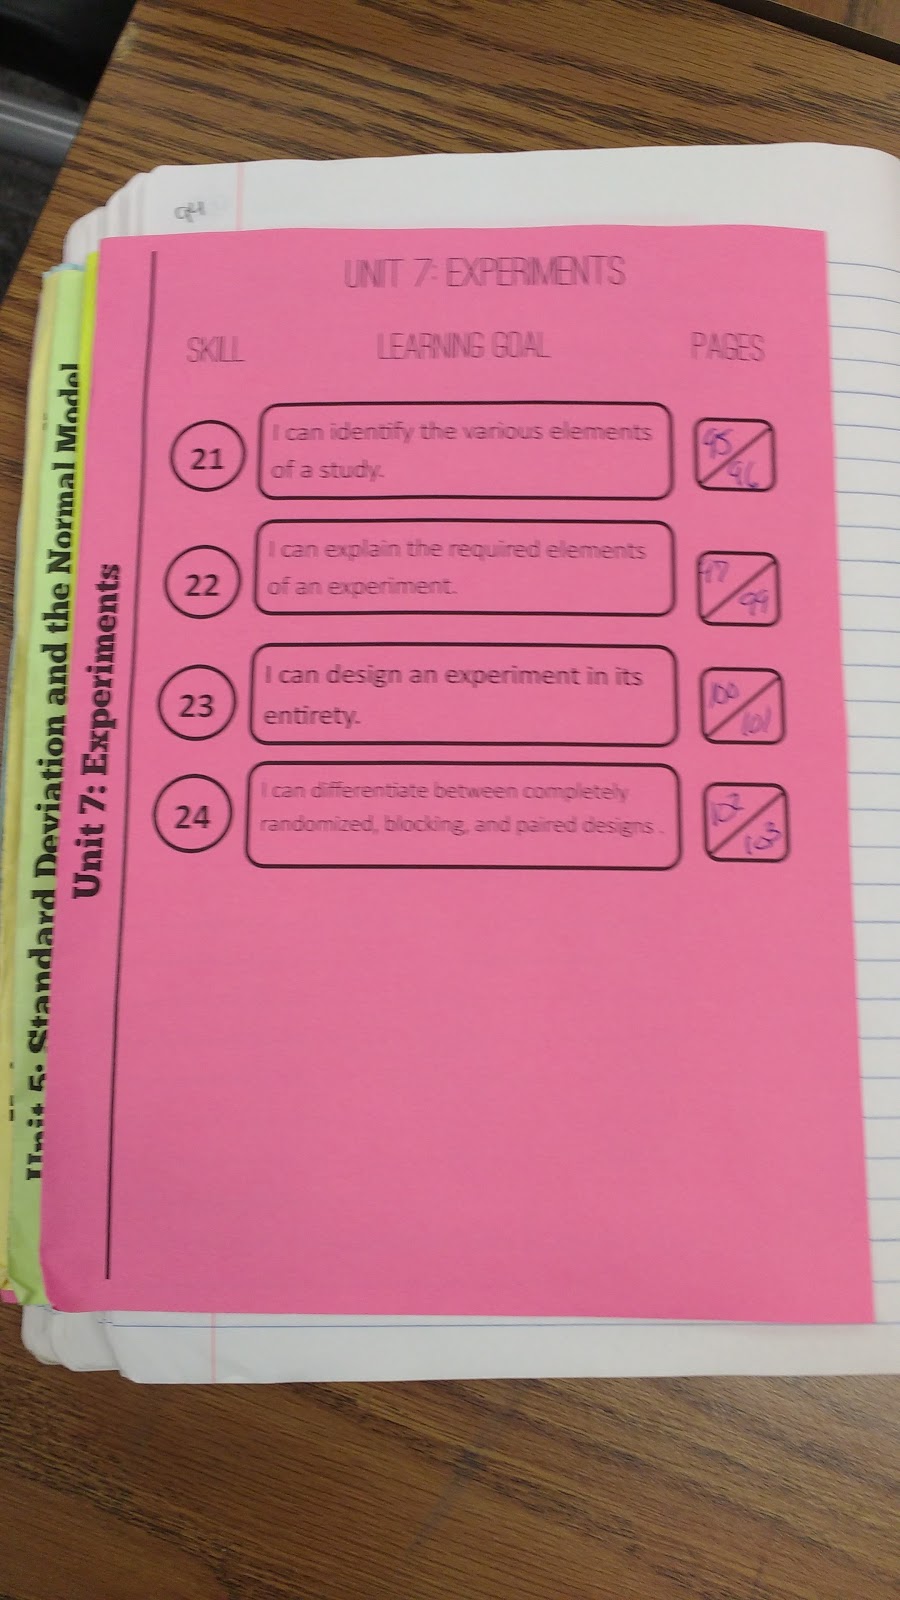
Each unit started out with a unit divider/table of contents/score tracking sheet. I blogged about this system here.
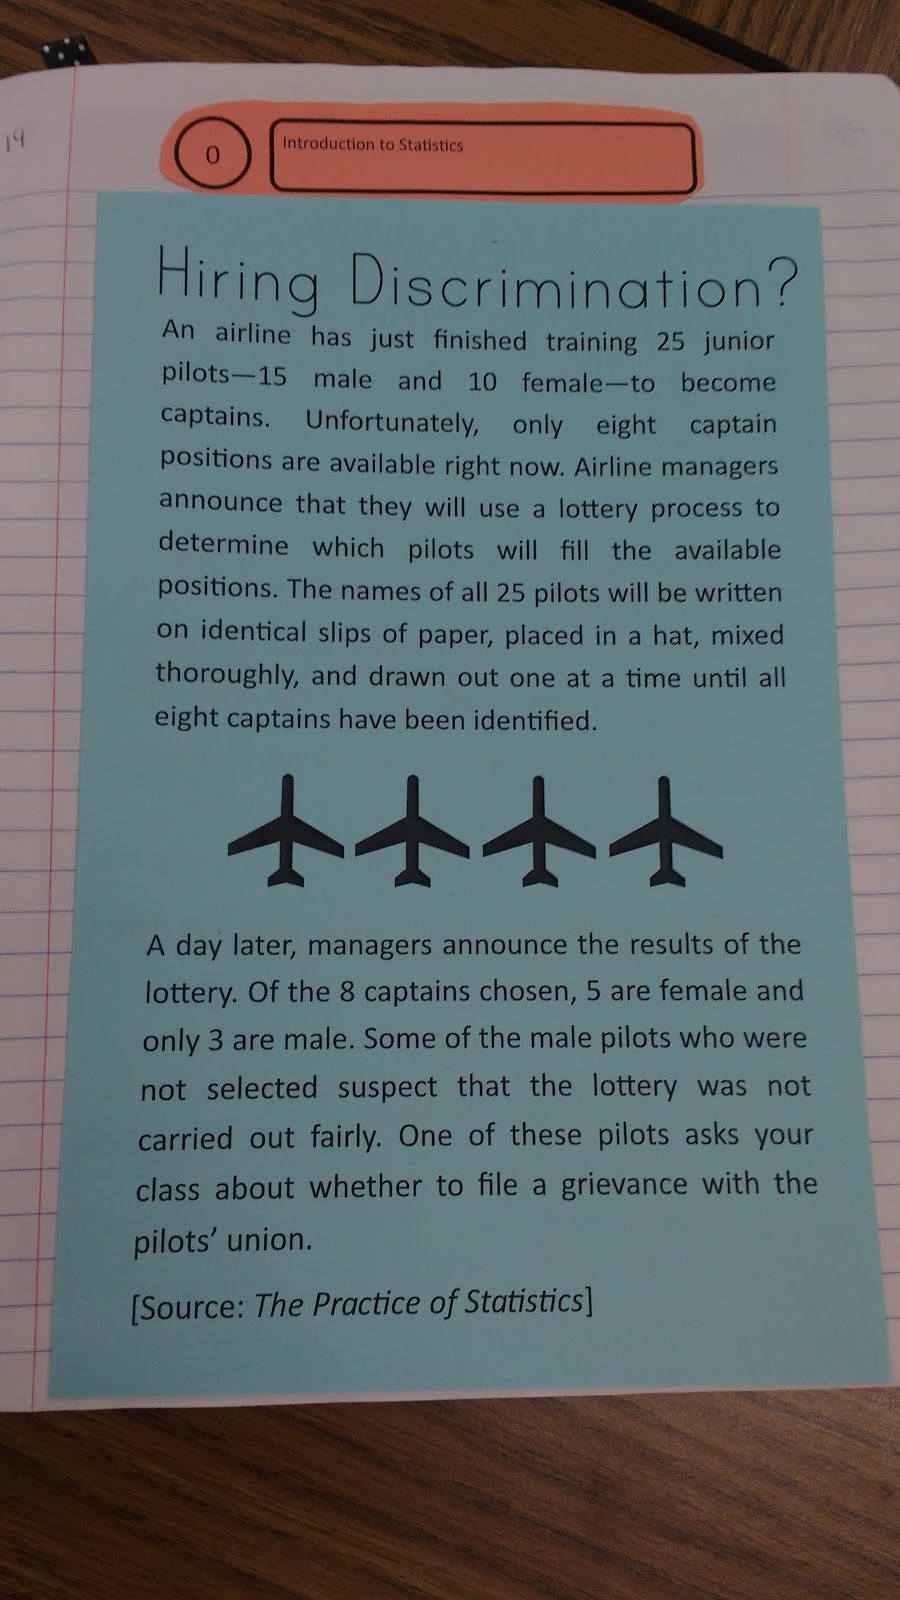
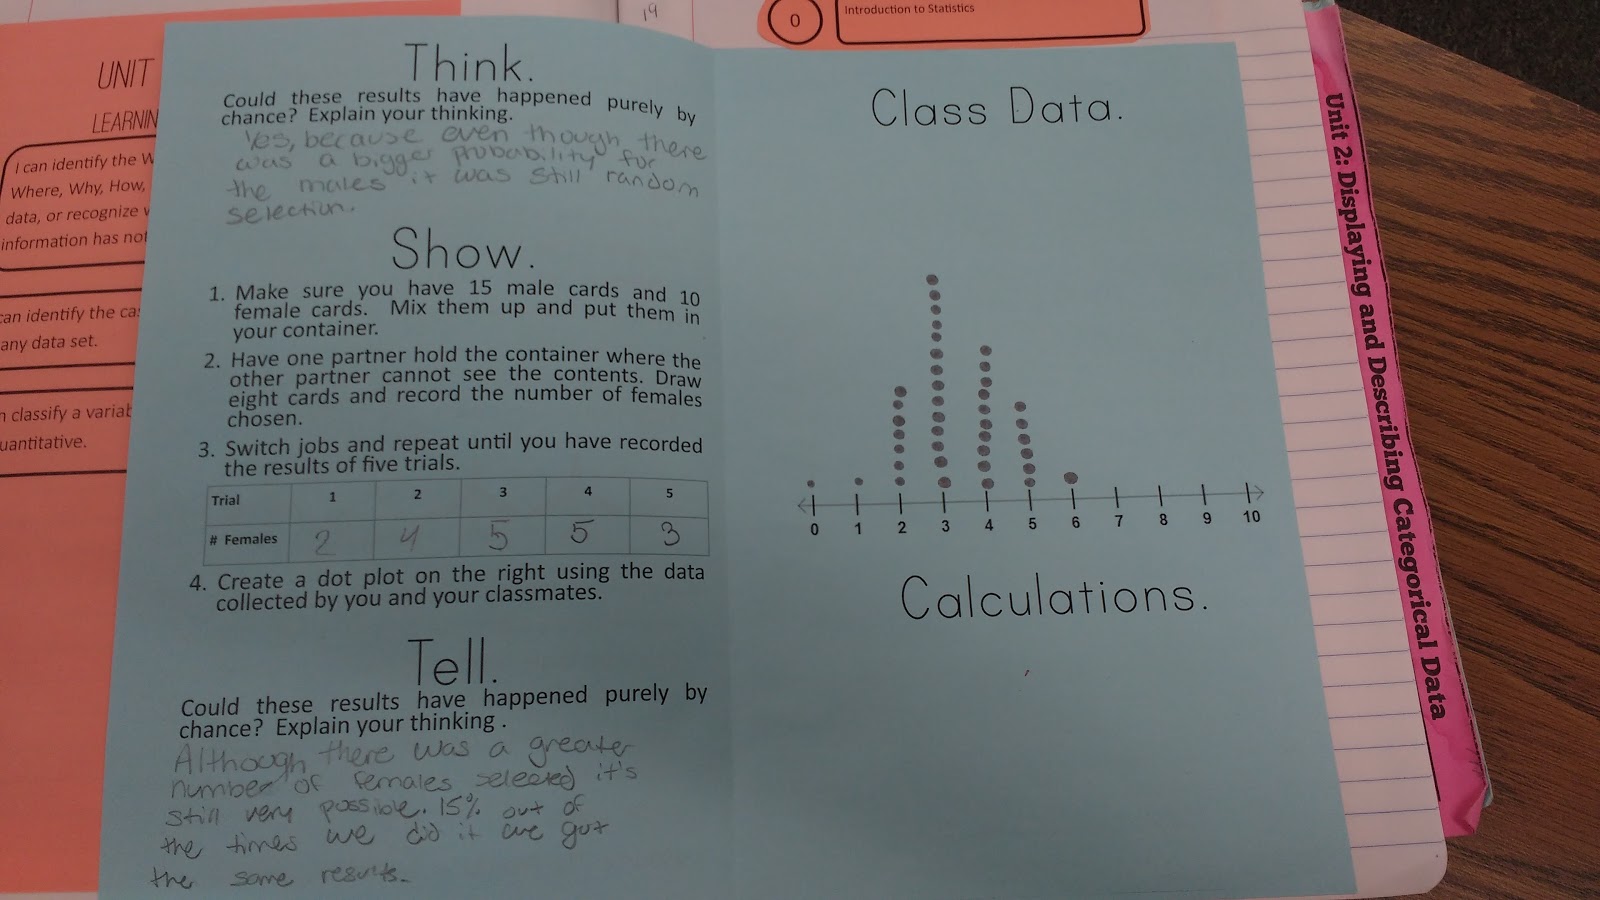
Our first activity of the year was the hiring discrimination activity from The Practice of Statistics. This activity got a blog post here!
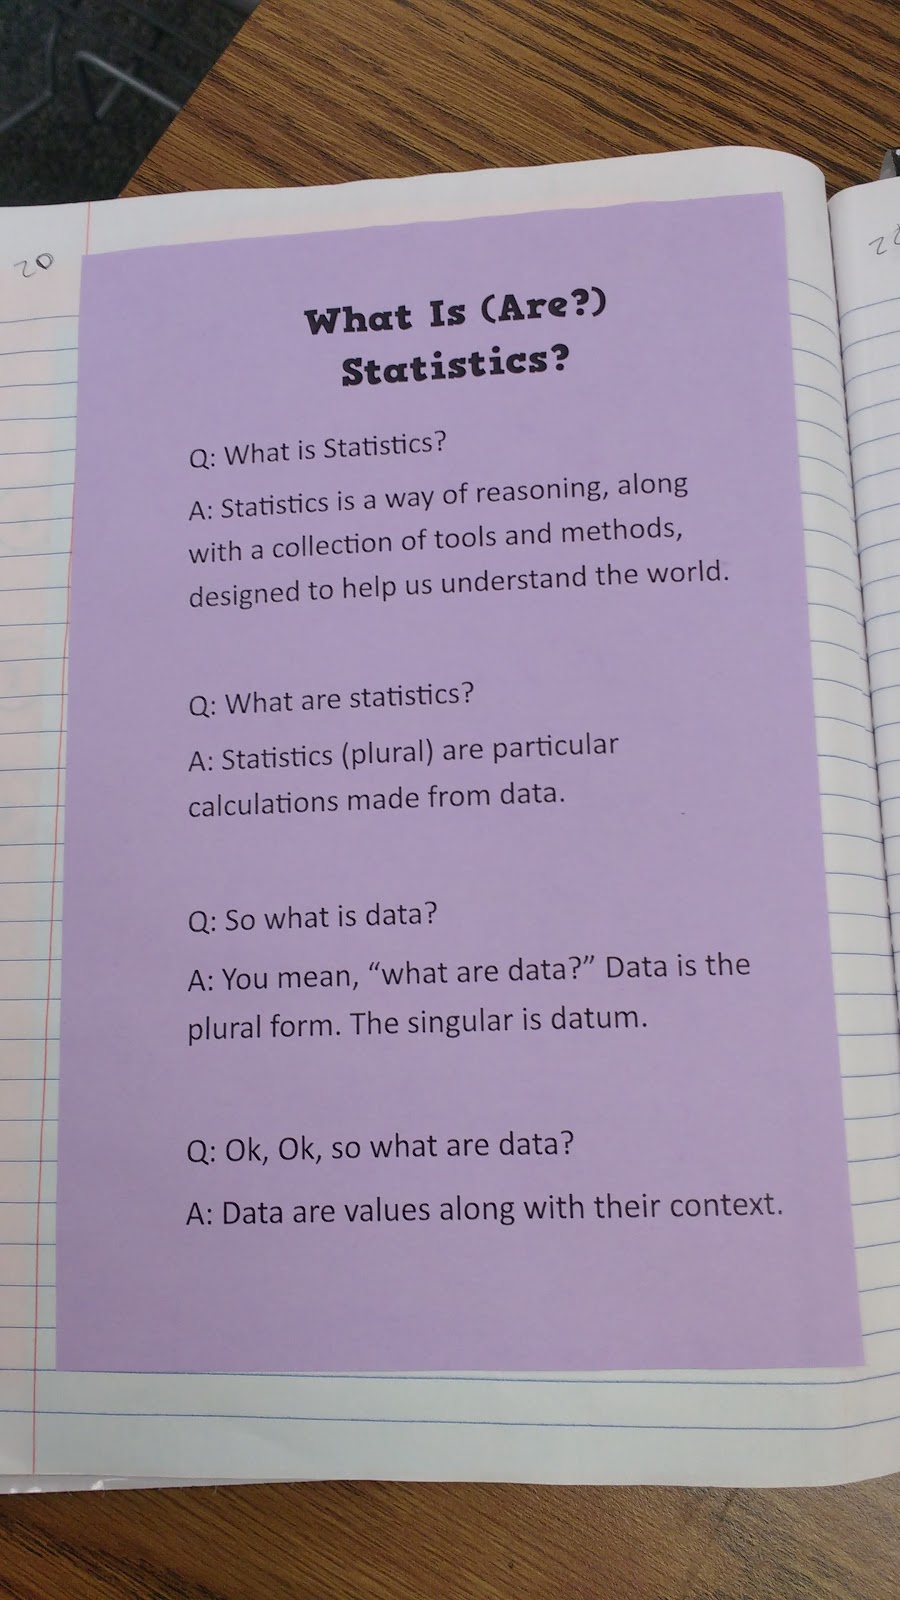
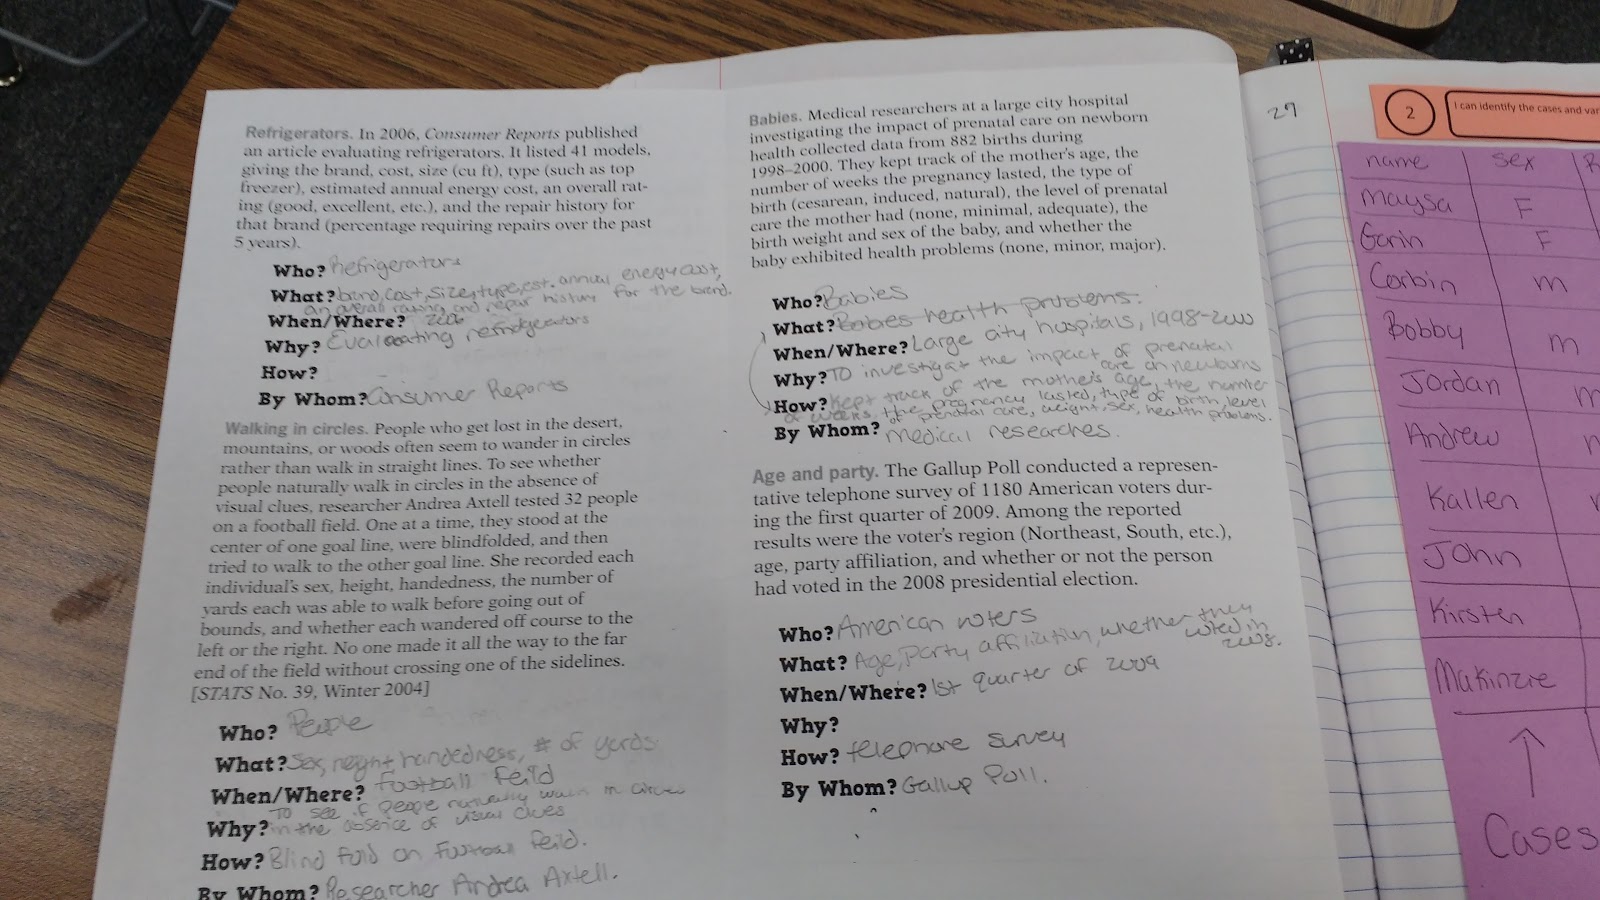
Next was a Q and A section taken straight from the BVD stats book:
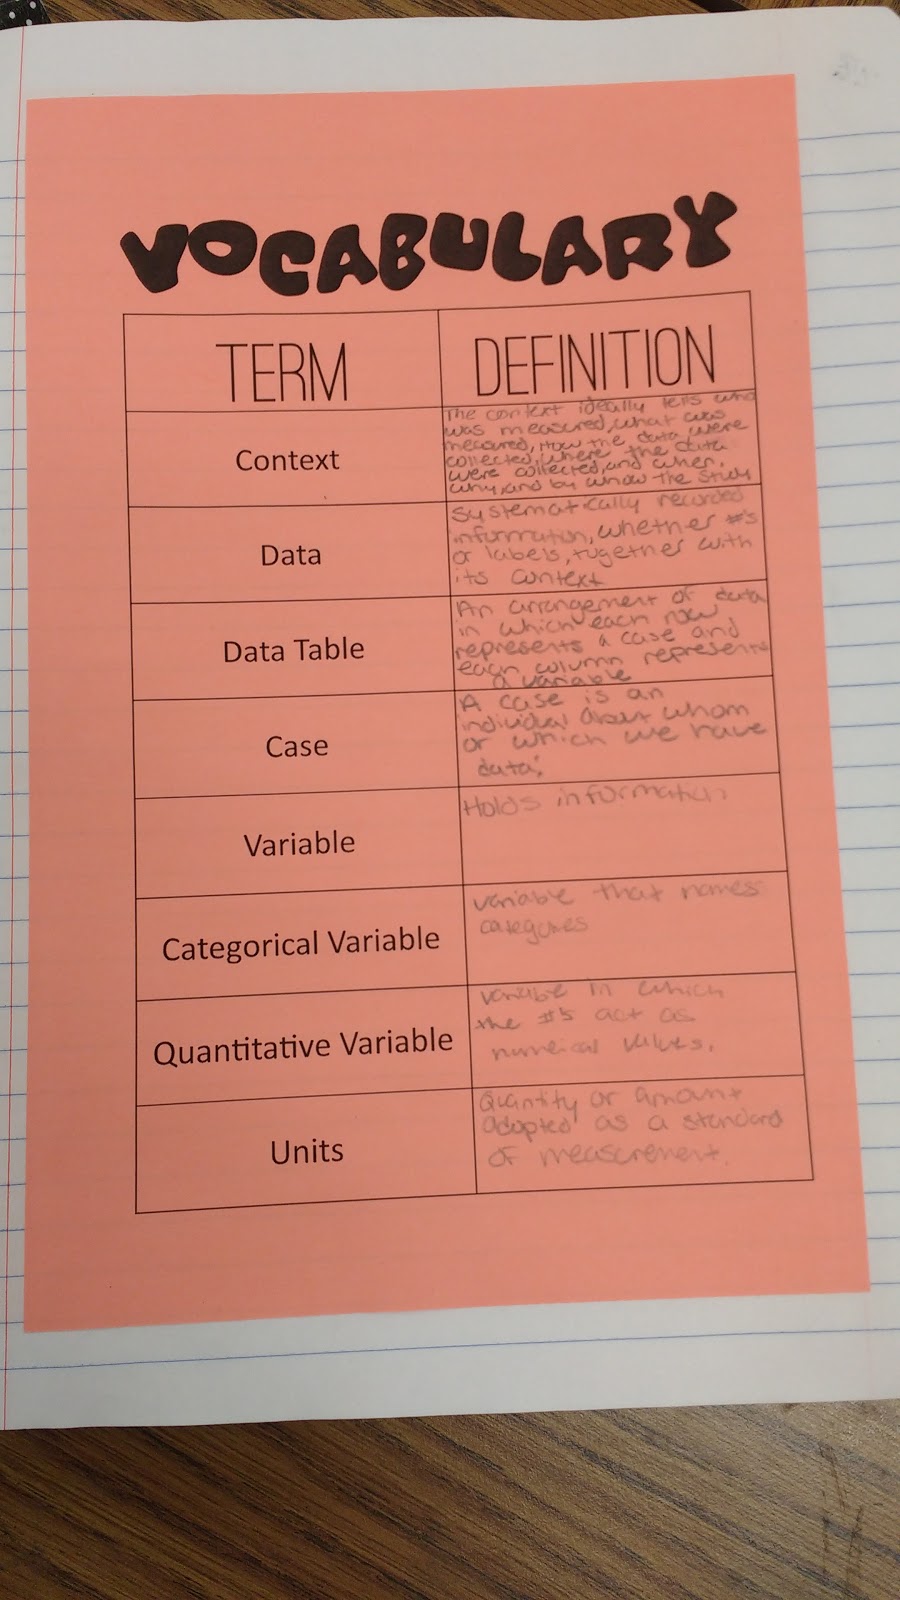
Vocabulary Sheet for Unit 1. This idea failed TERRIBLY. Having my students copy down vocab words took waaaaaaaaaaaaaaaaaaayyyyyyyyy too long. We don’t have stats books, so I can’t make them copy down the vocab on their own time.
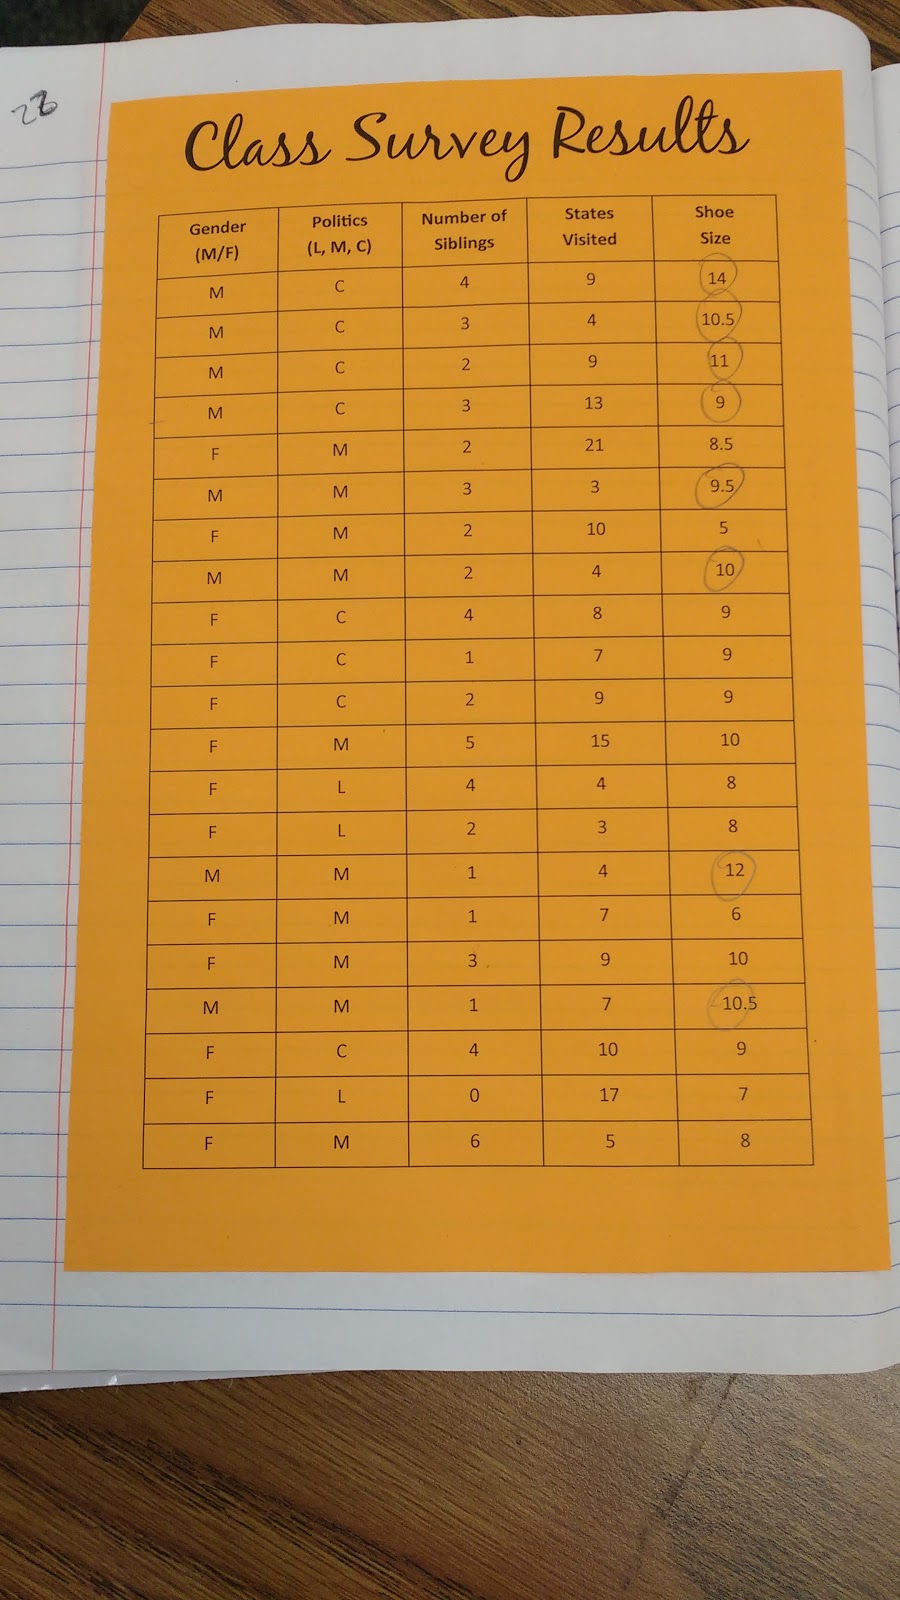
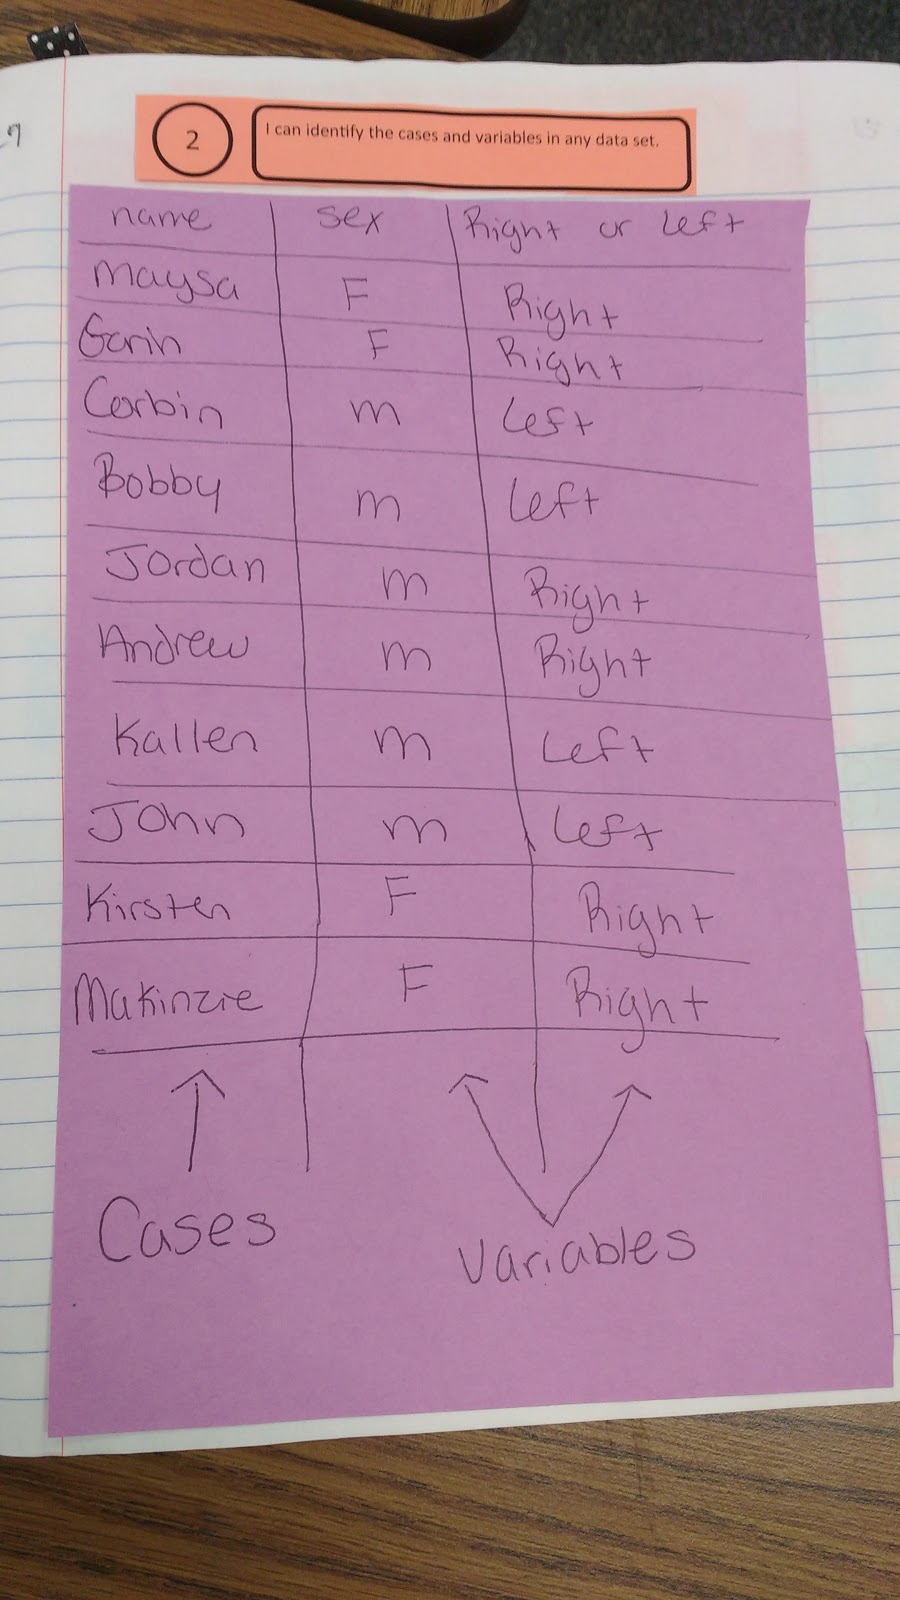
Class Survey Results. I typed up the results for the class so we could use this data throughout the rest of the course.
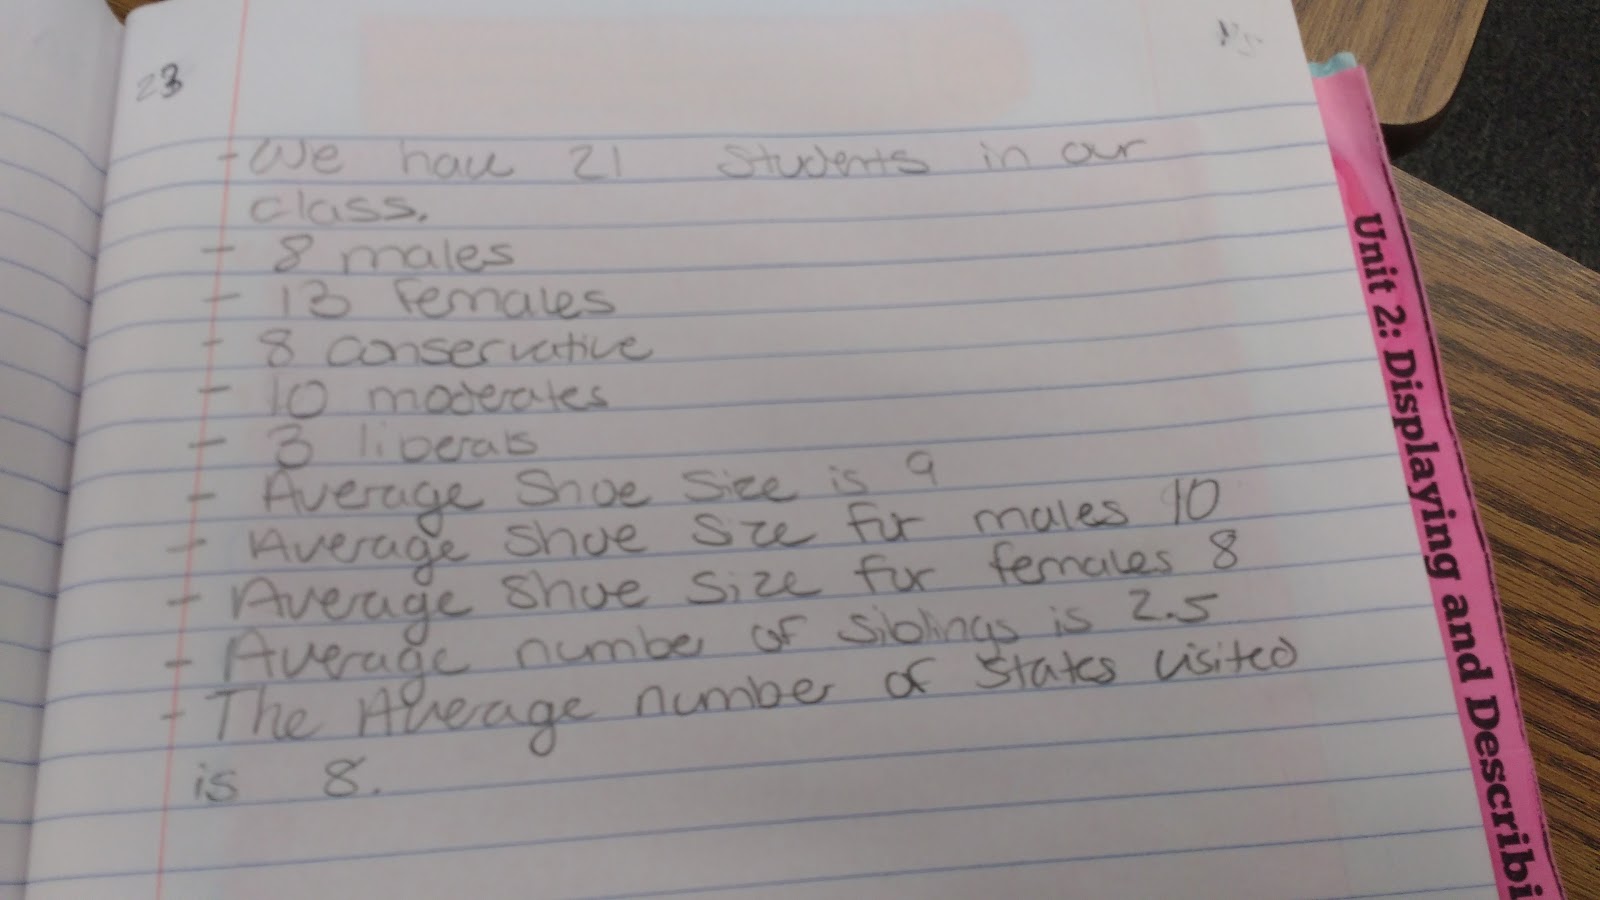
Students had to write down observations from our class results.
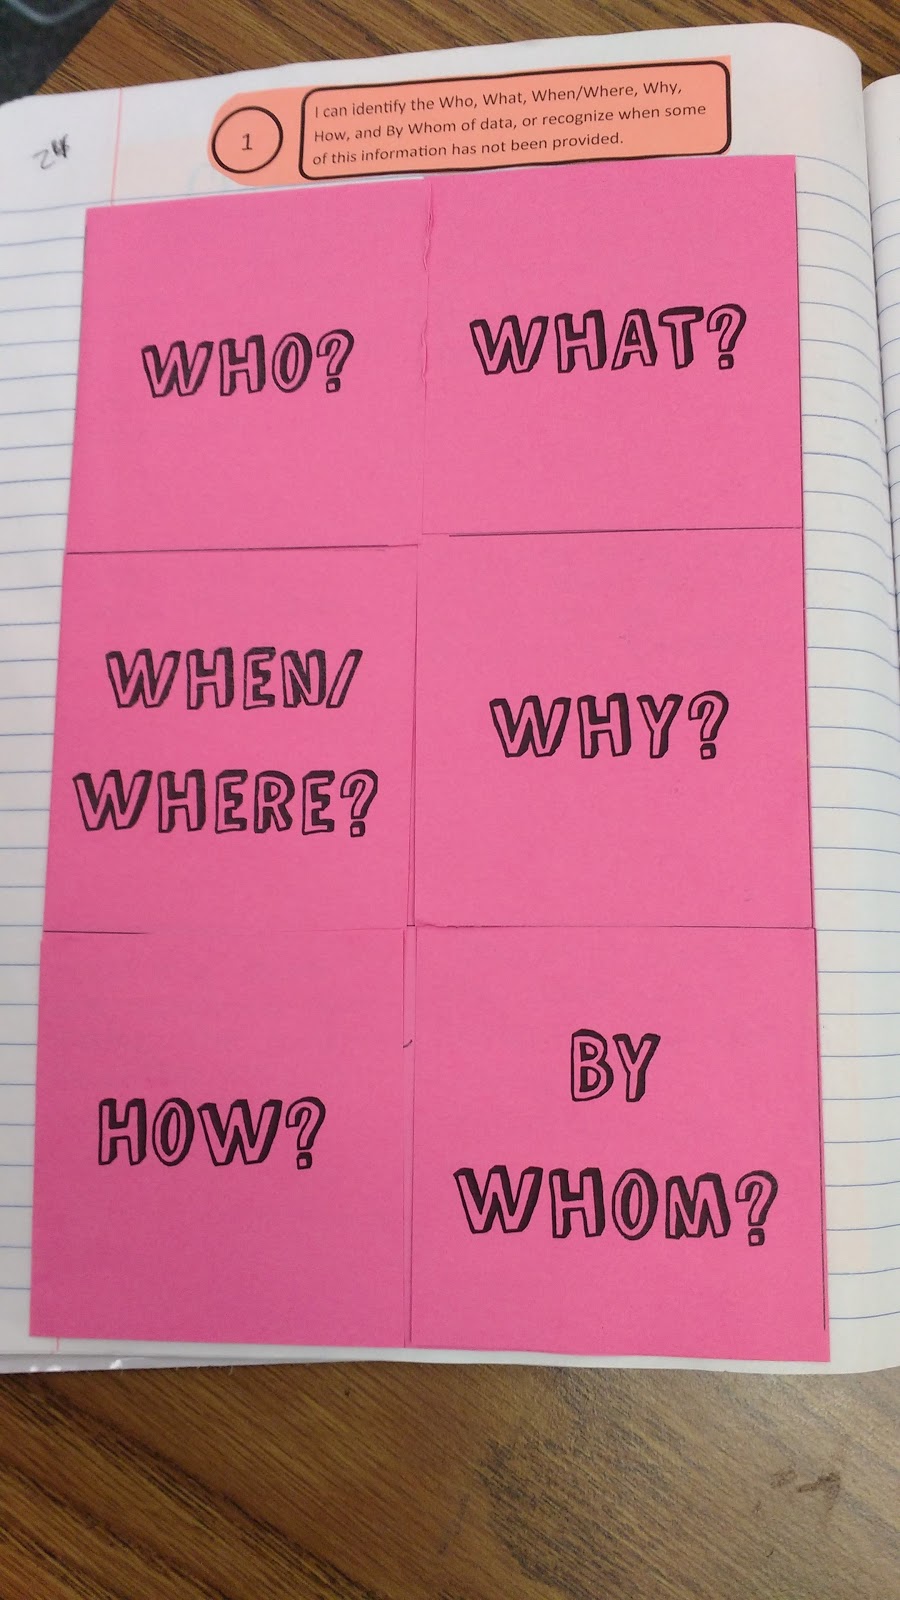
W’s Foldable:
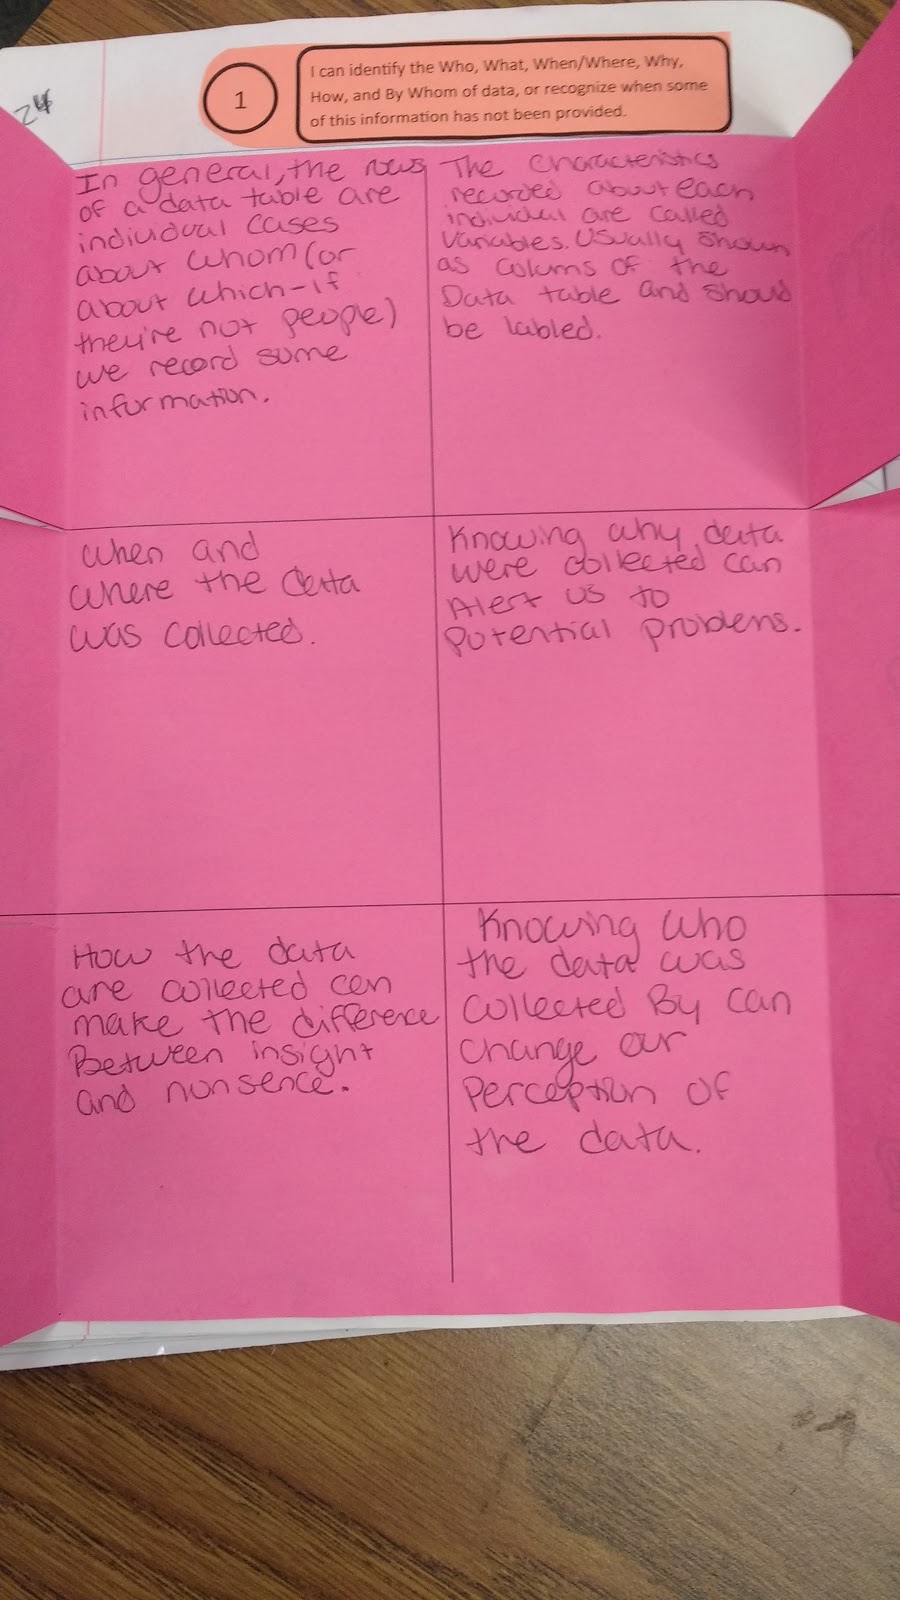
This was another foldable where I asked my students to do too much writing. I should have pre-typed most of that!
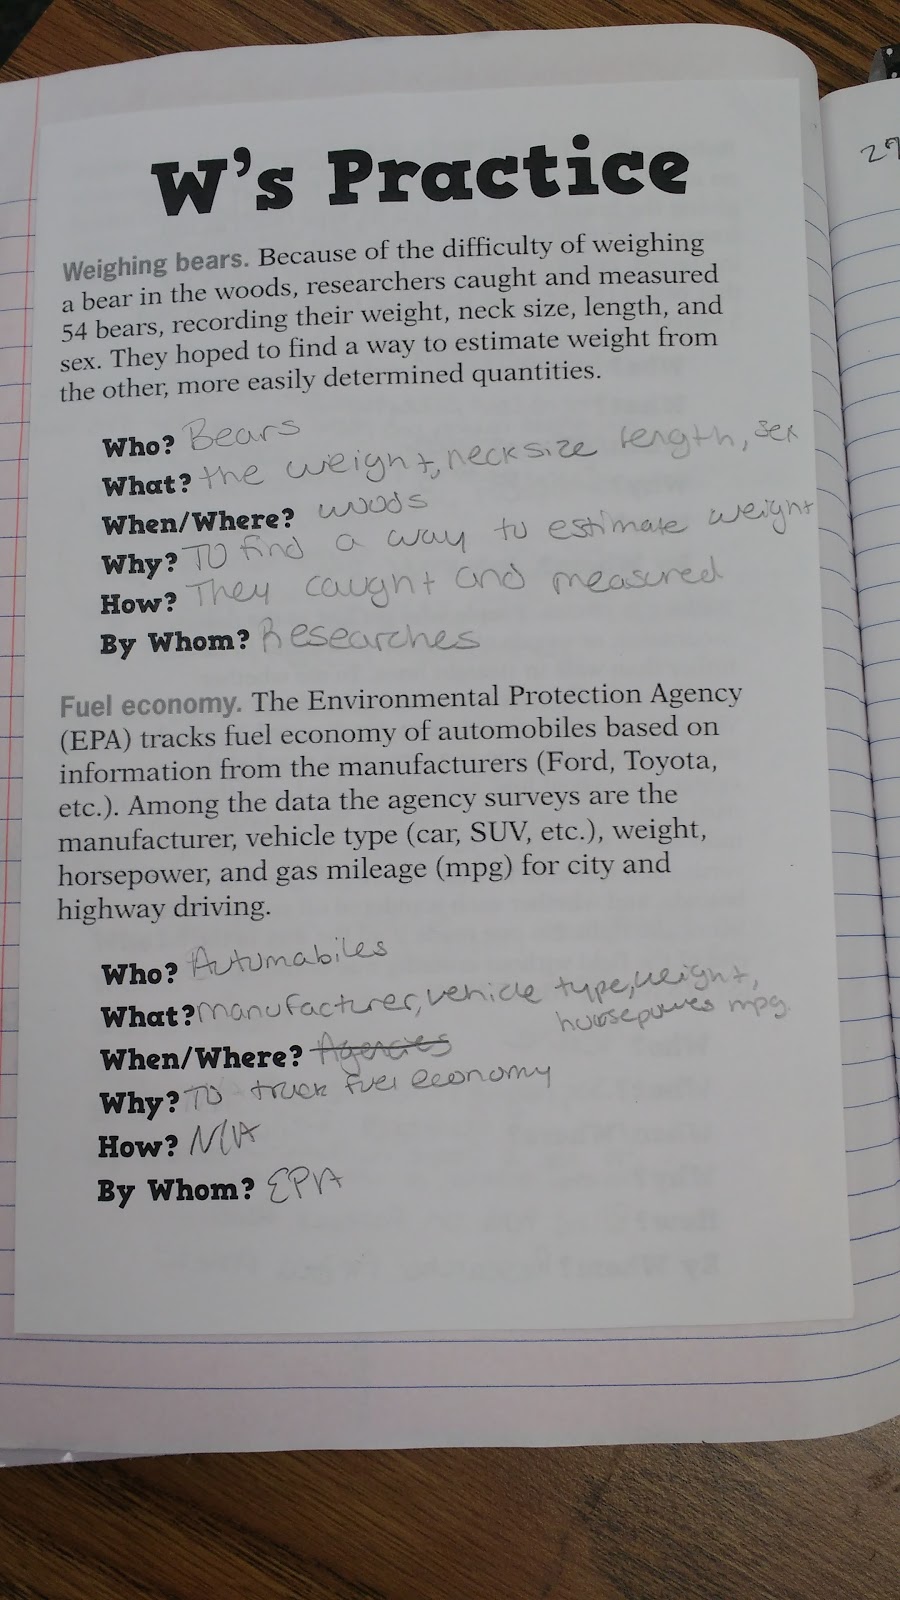
W’s Practice Problems:
Next, students had to design their own survey and label the cases and results. This didn’t go as well as I’d hoped. Next time I teach stats, I’ll make much more structured notes for this lesson!
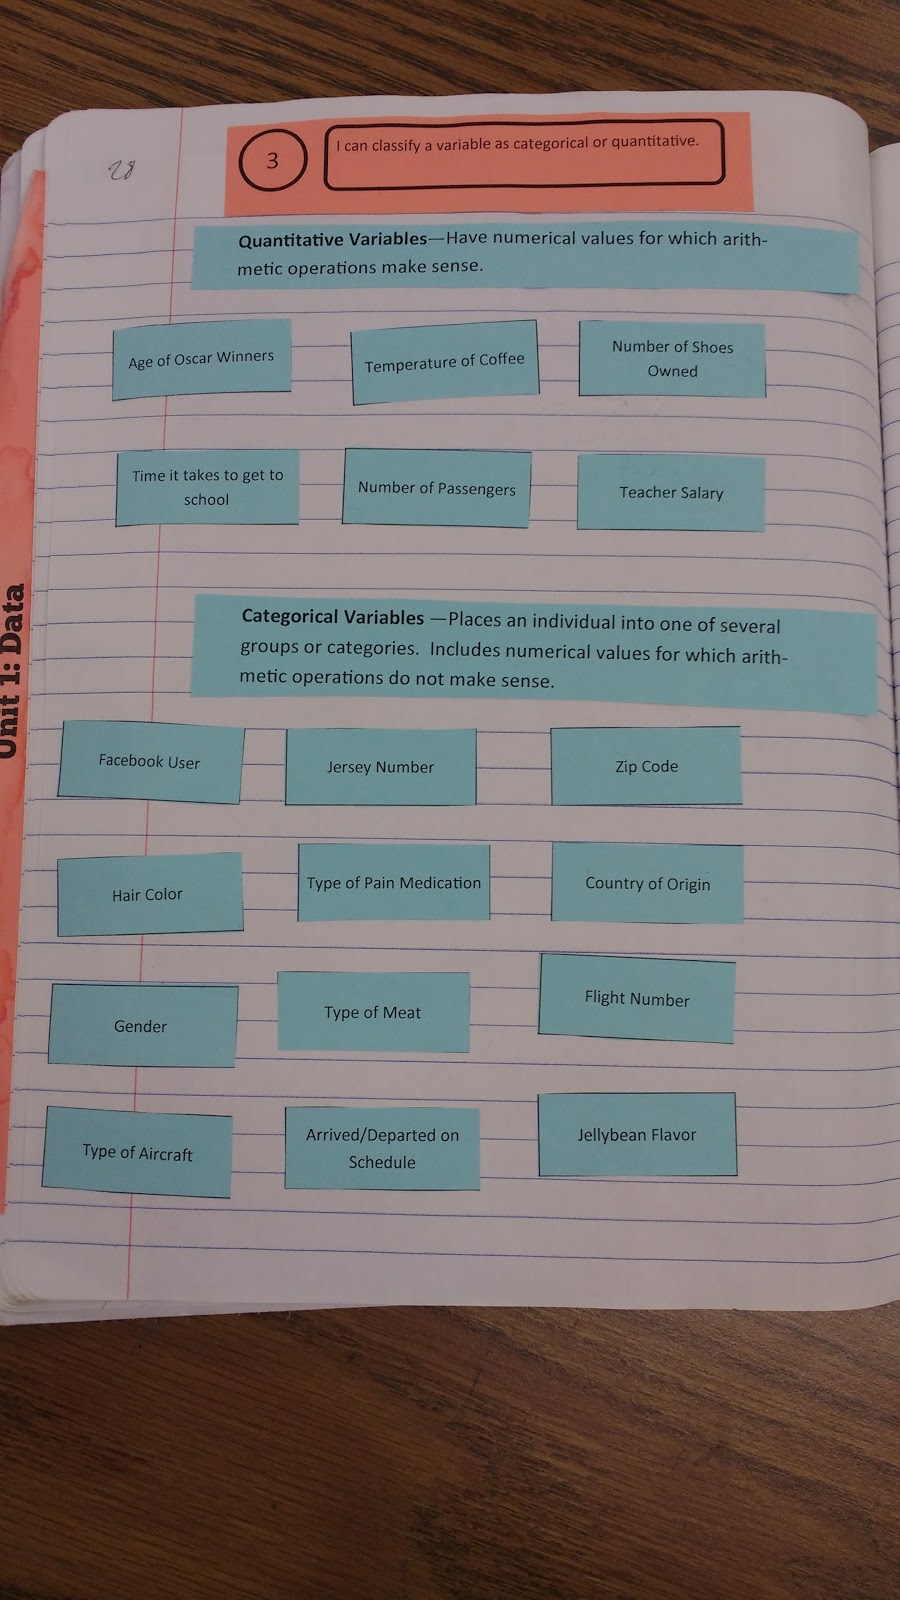
Categorical vs Quantitative Variable Card Sort (Blog Post)
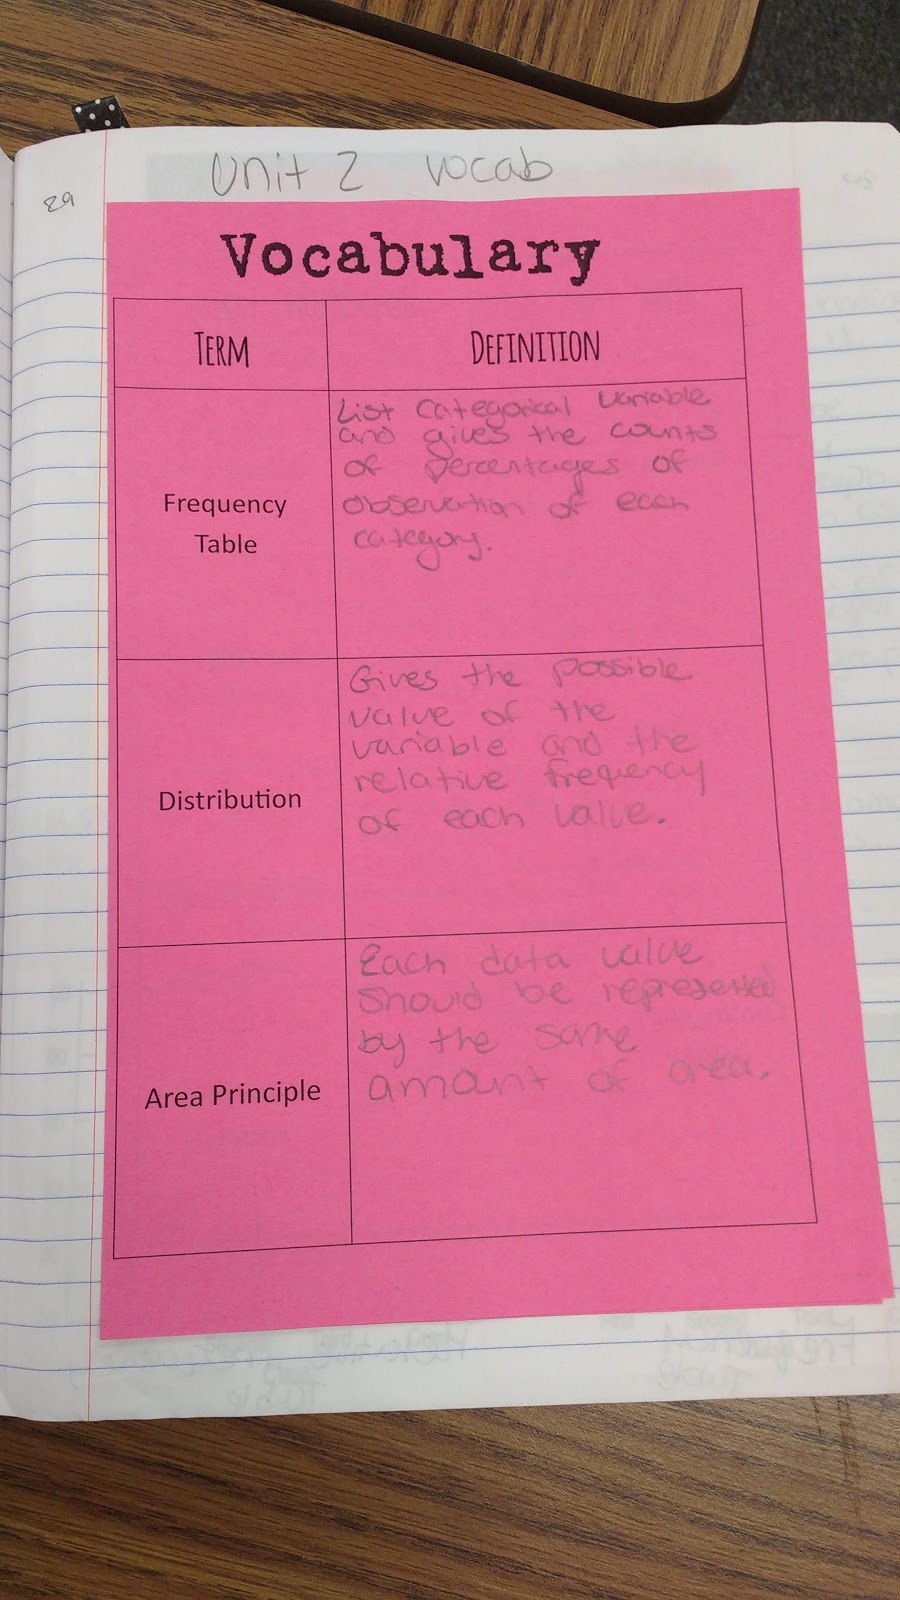
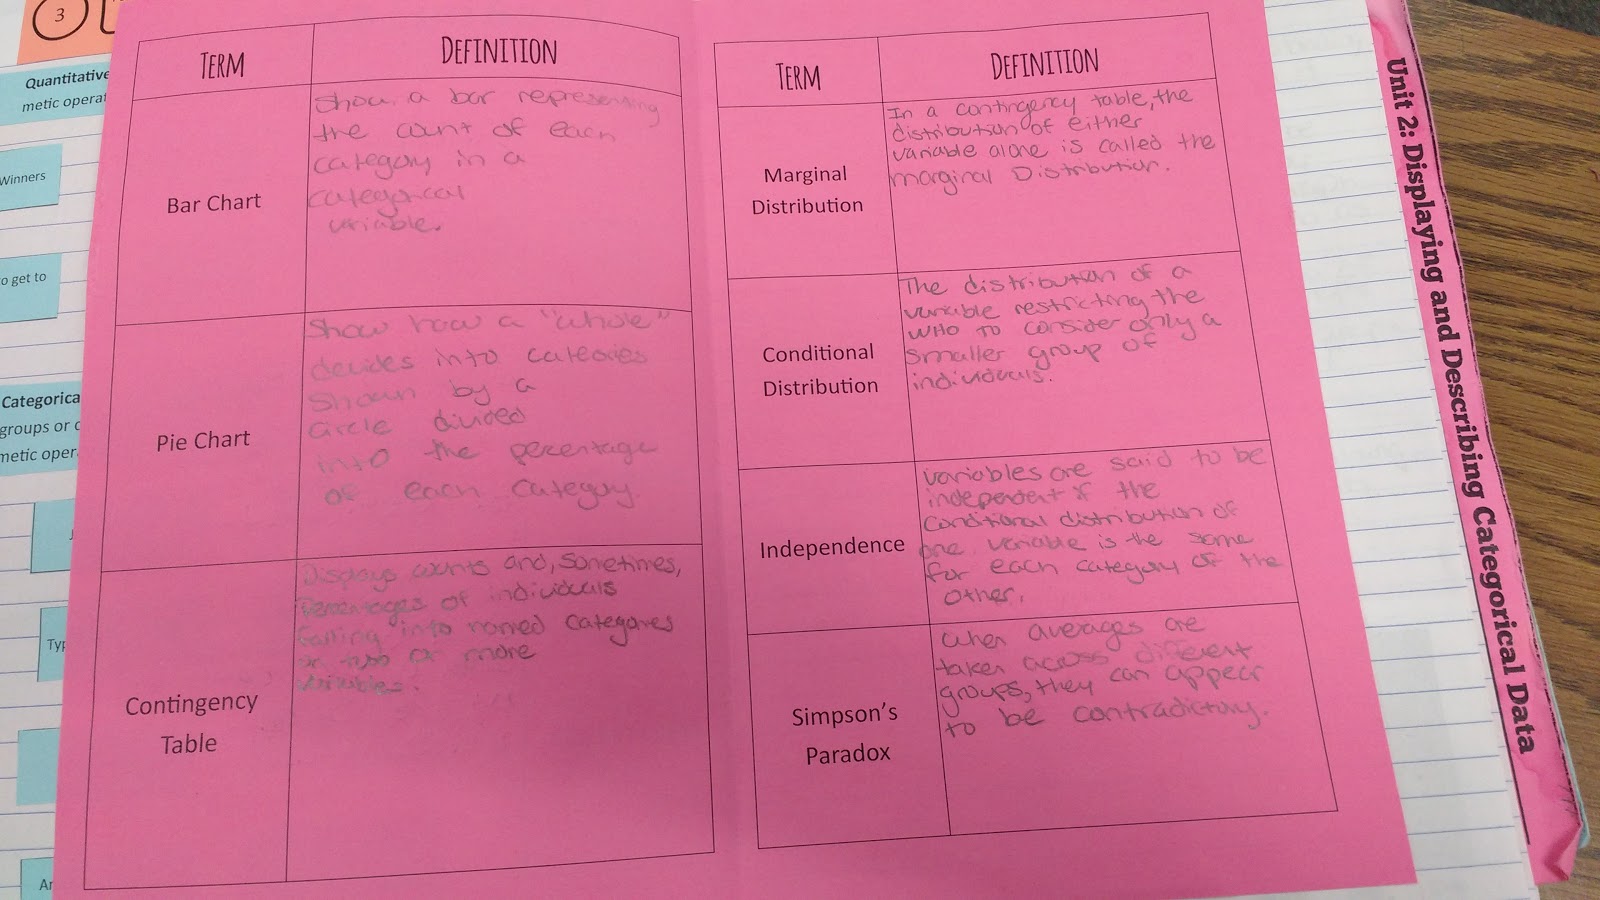
My last attempt at vocabulary for the year.
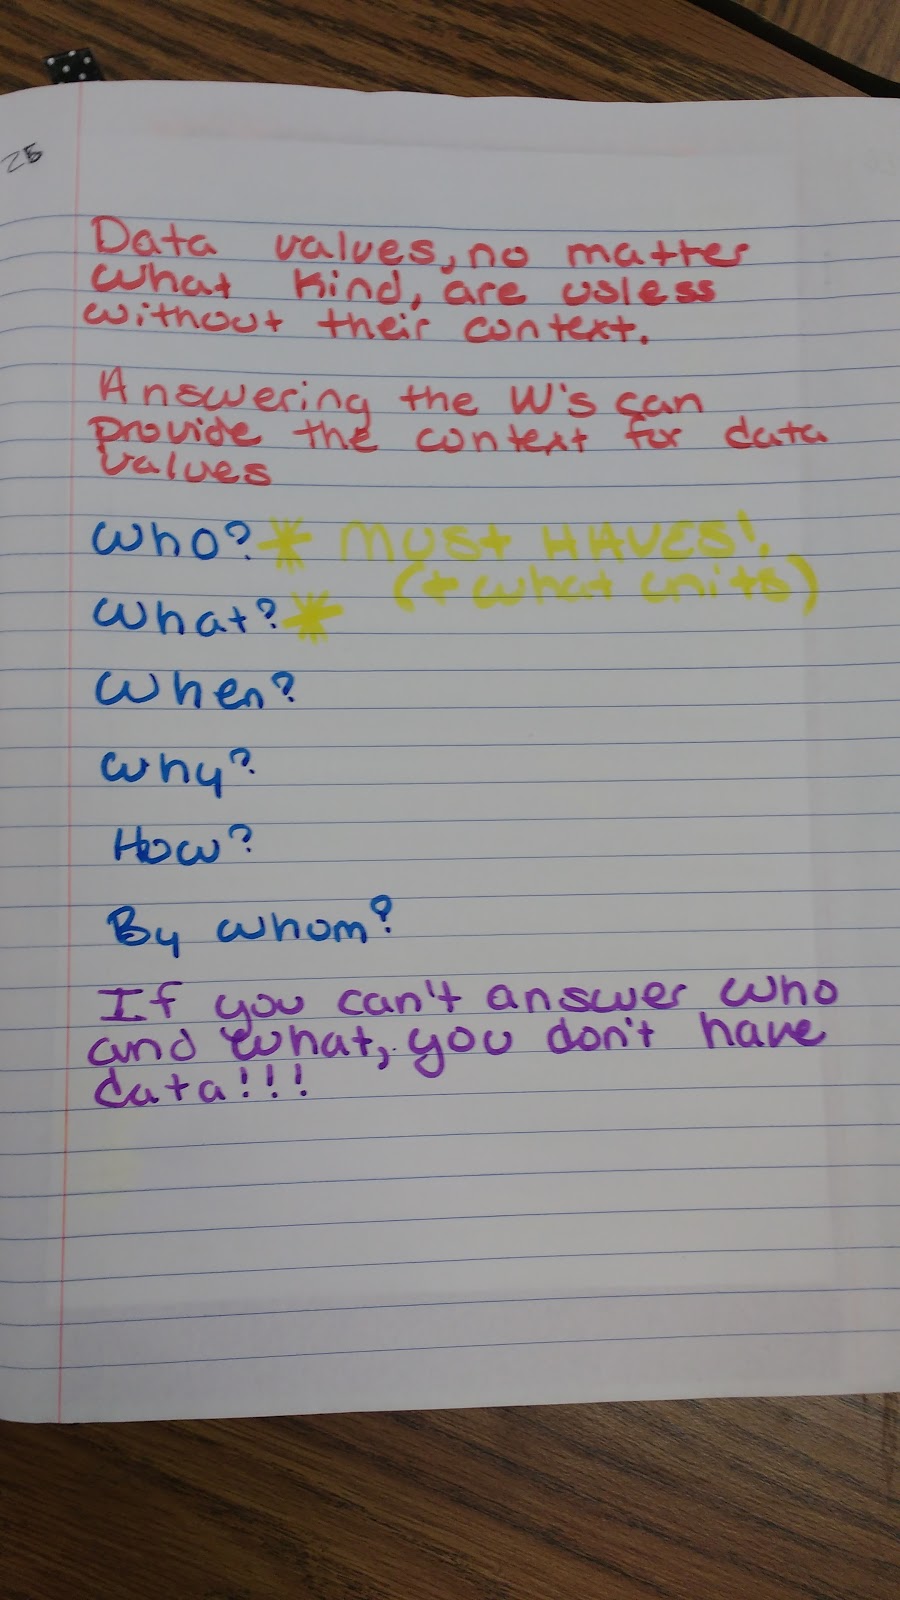
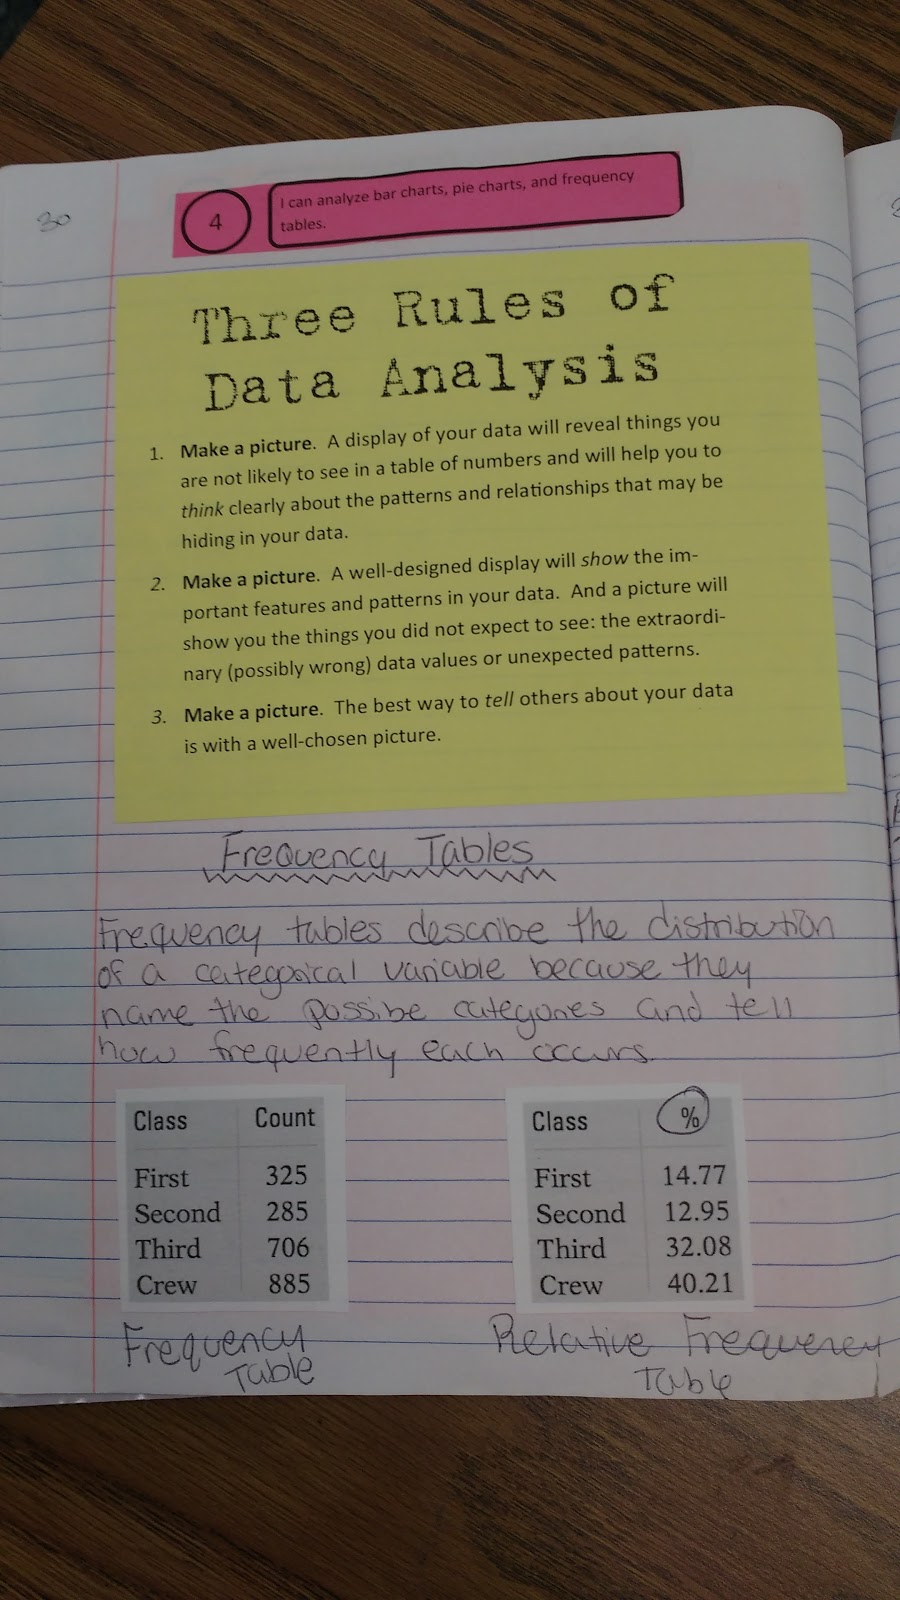
3 Rules of Data Analysis:
Unit 2!
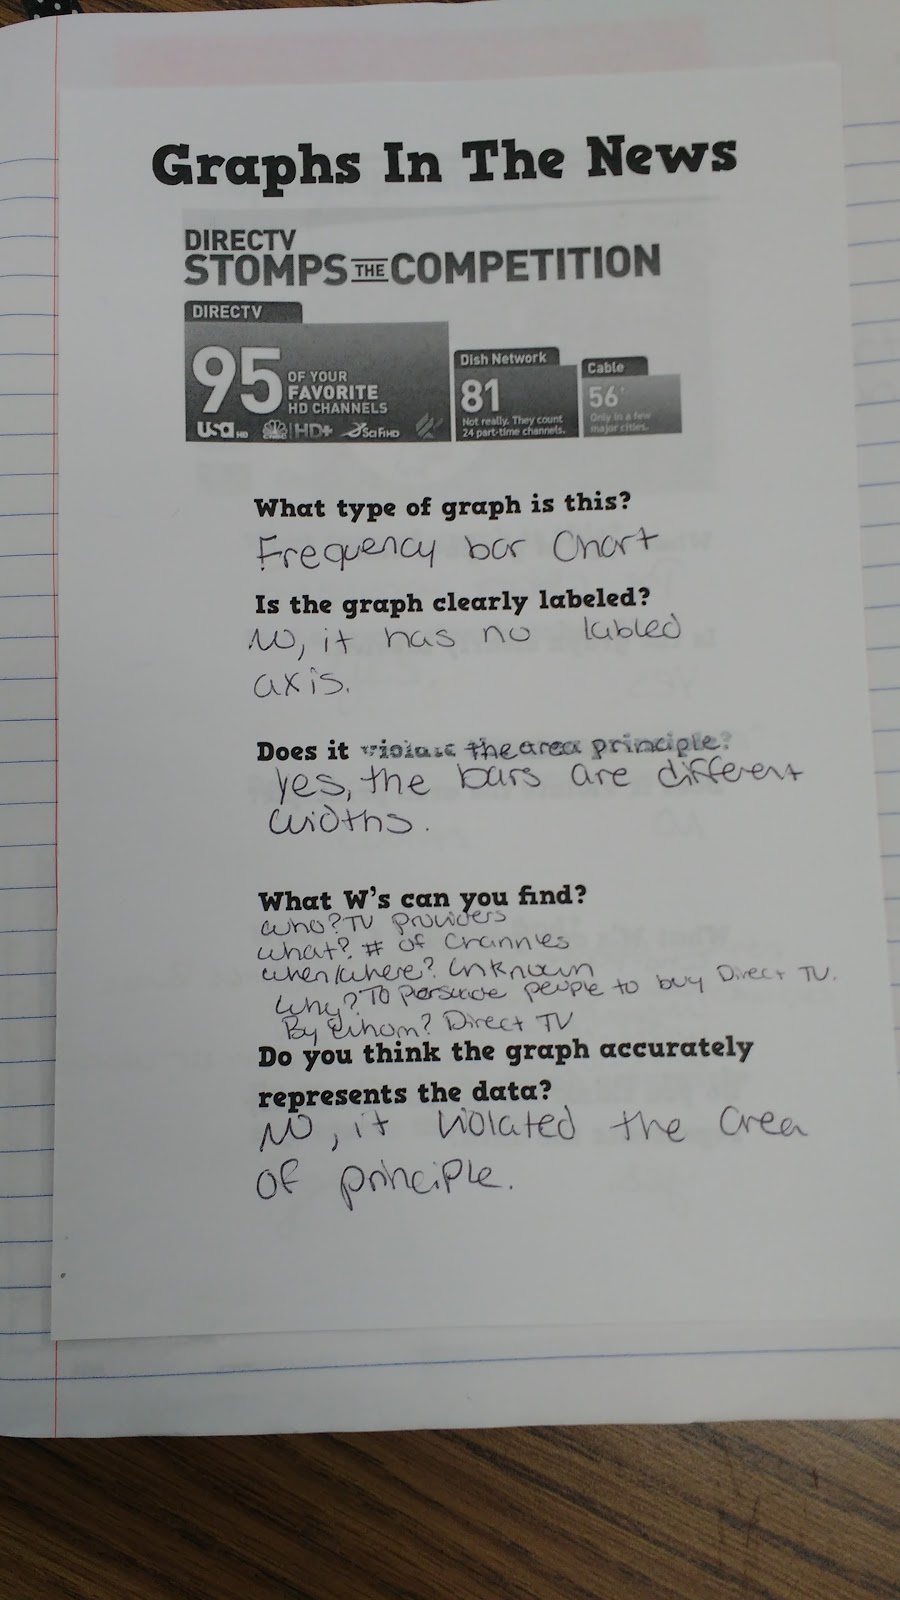
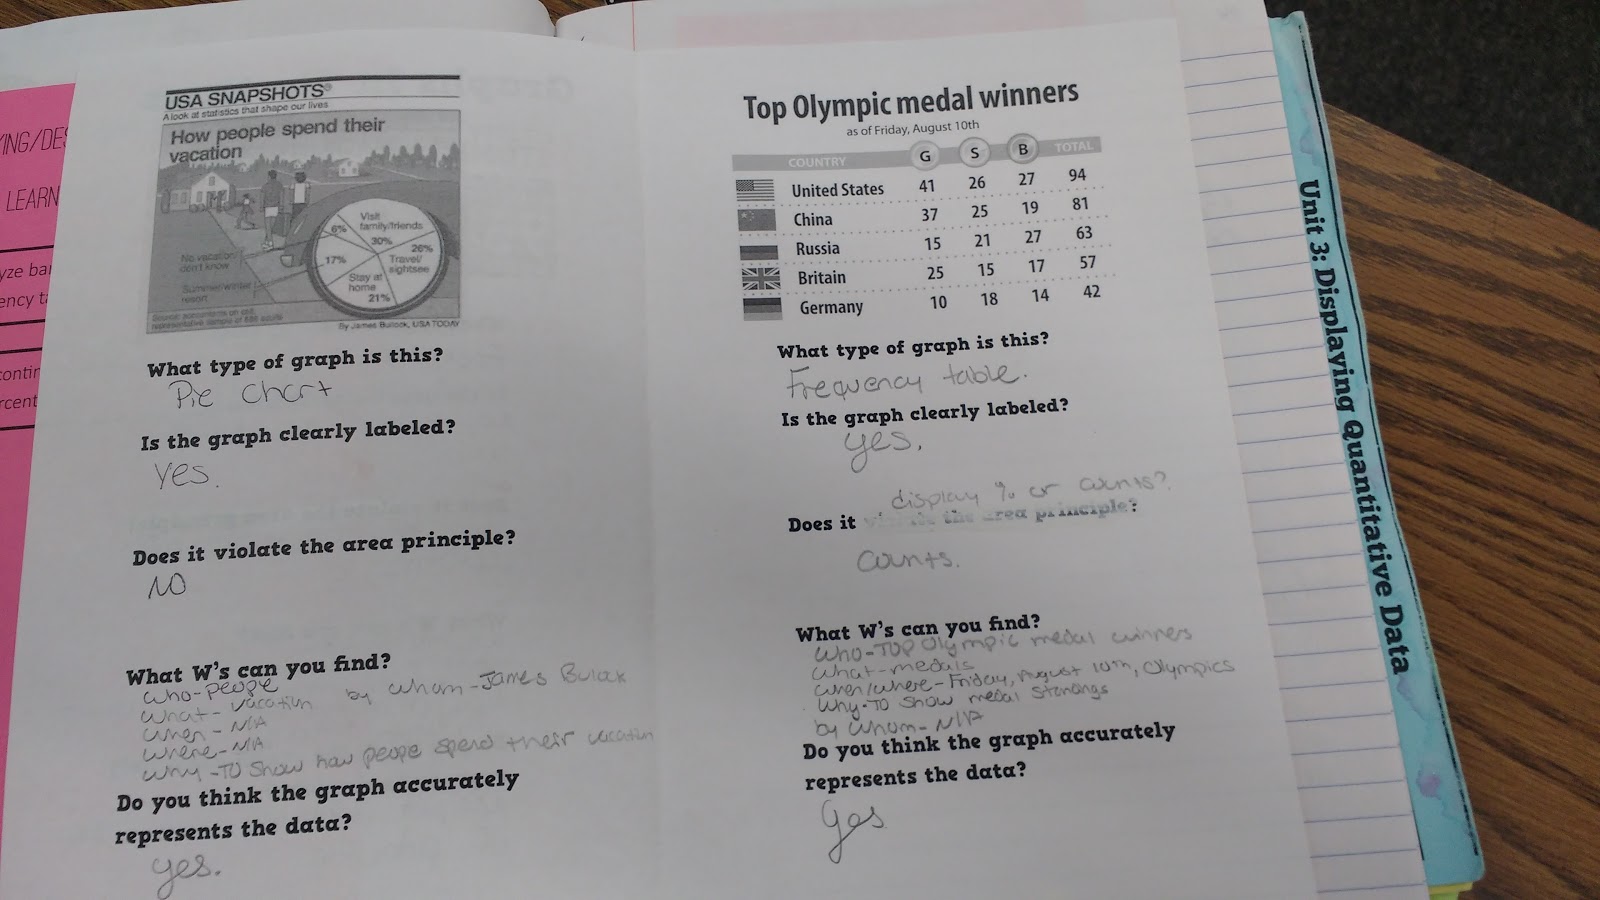
Graphs In The News Foldable. This also became a blog post last year!
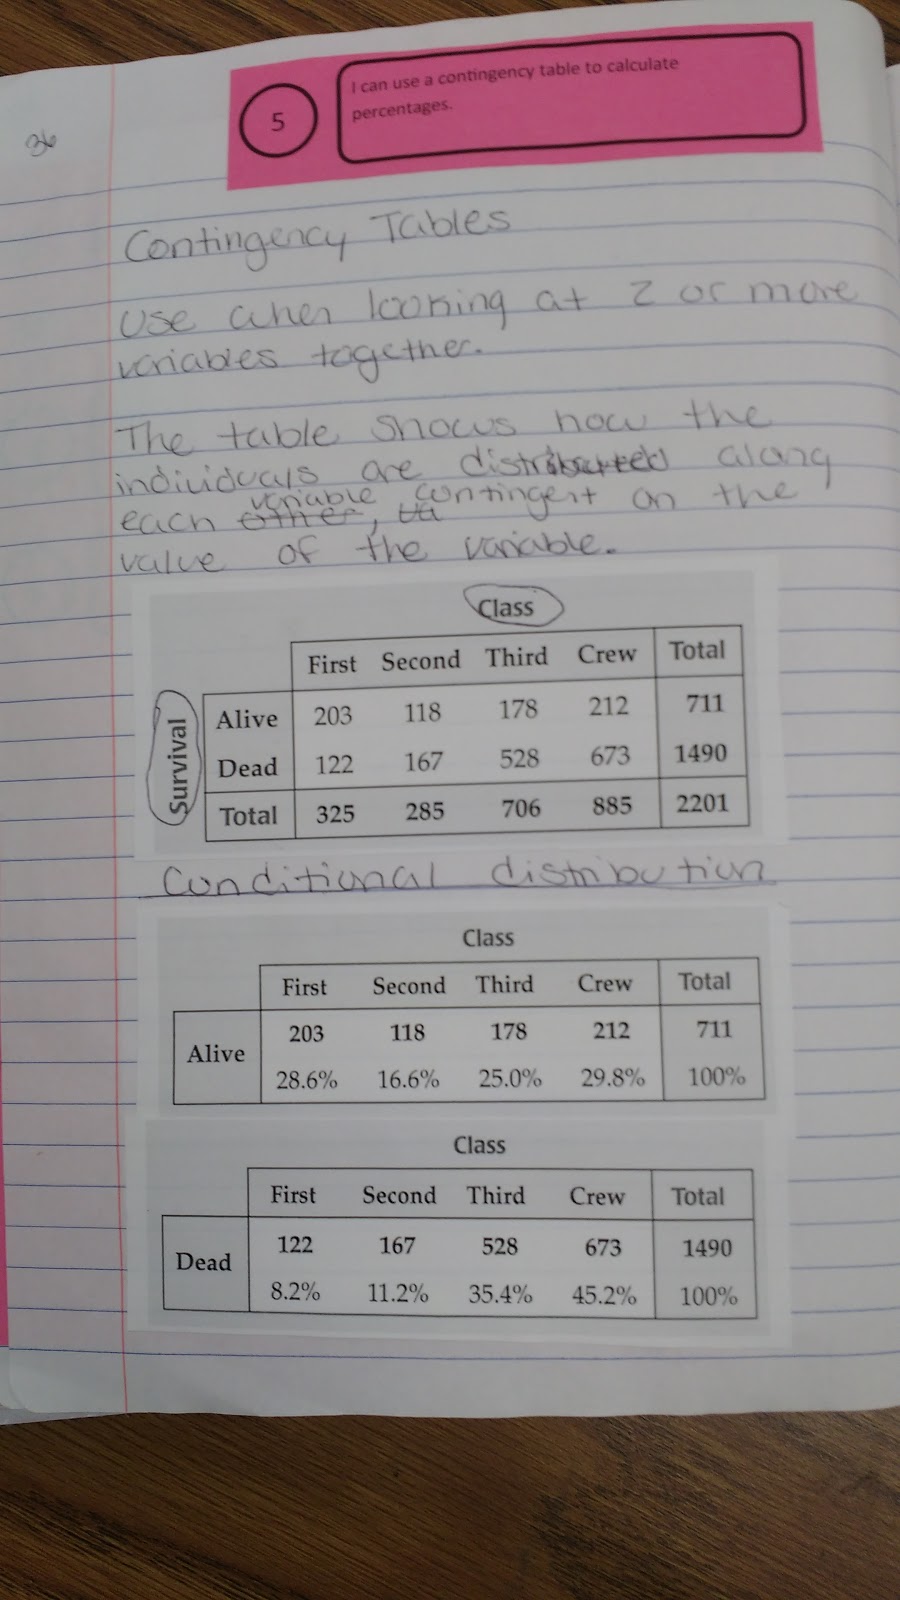
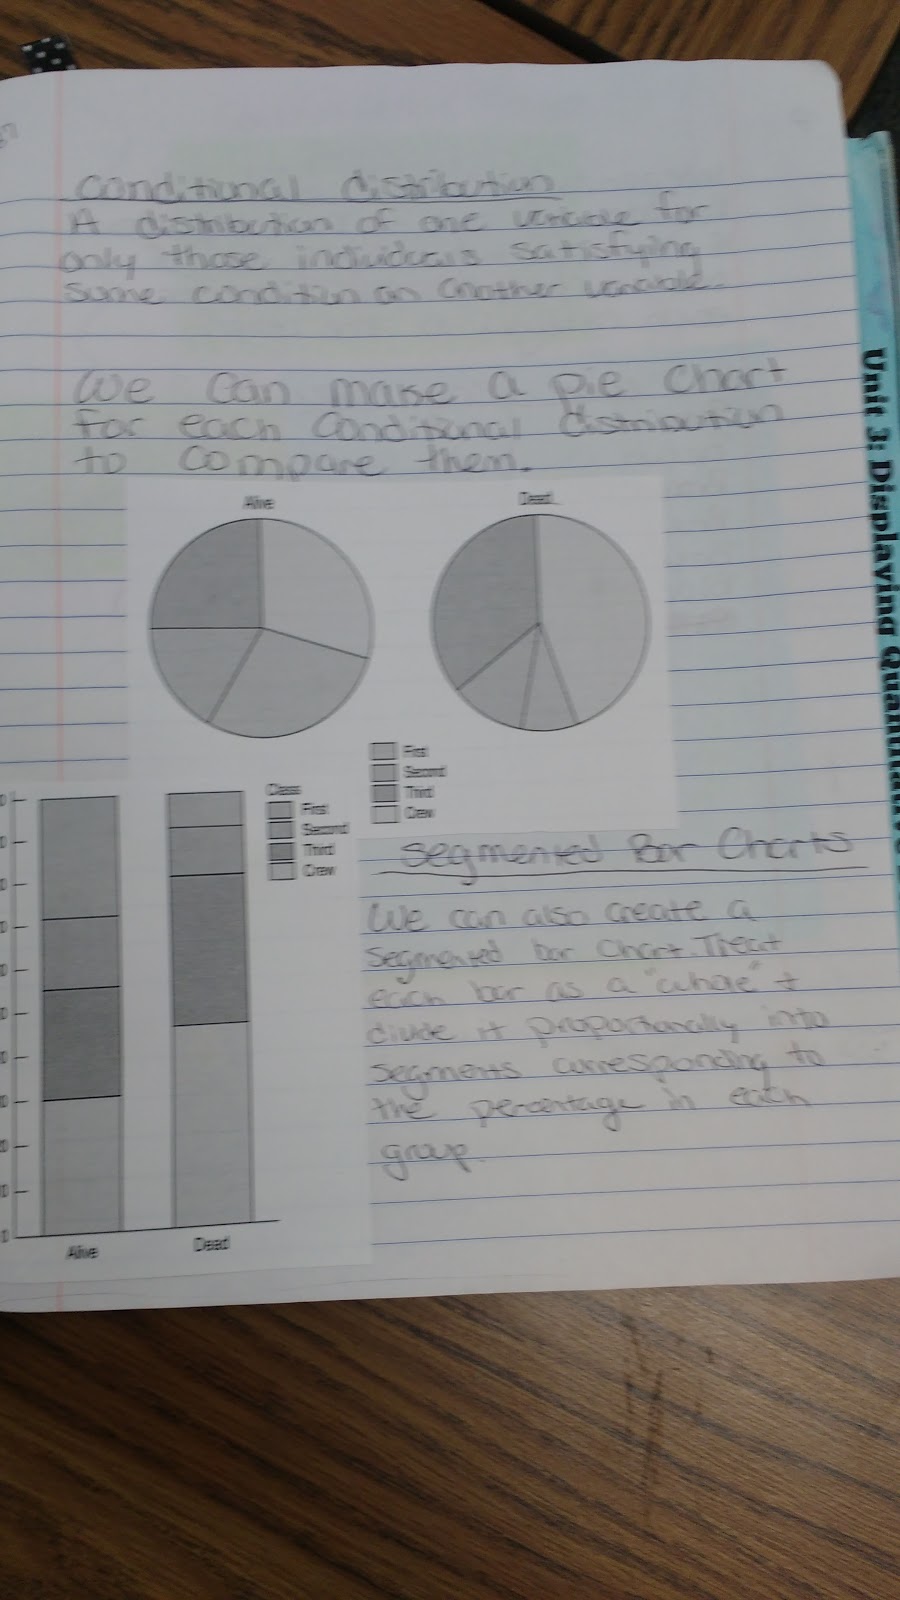
Titanic Contingency Tables:
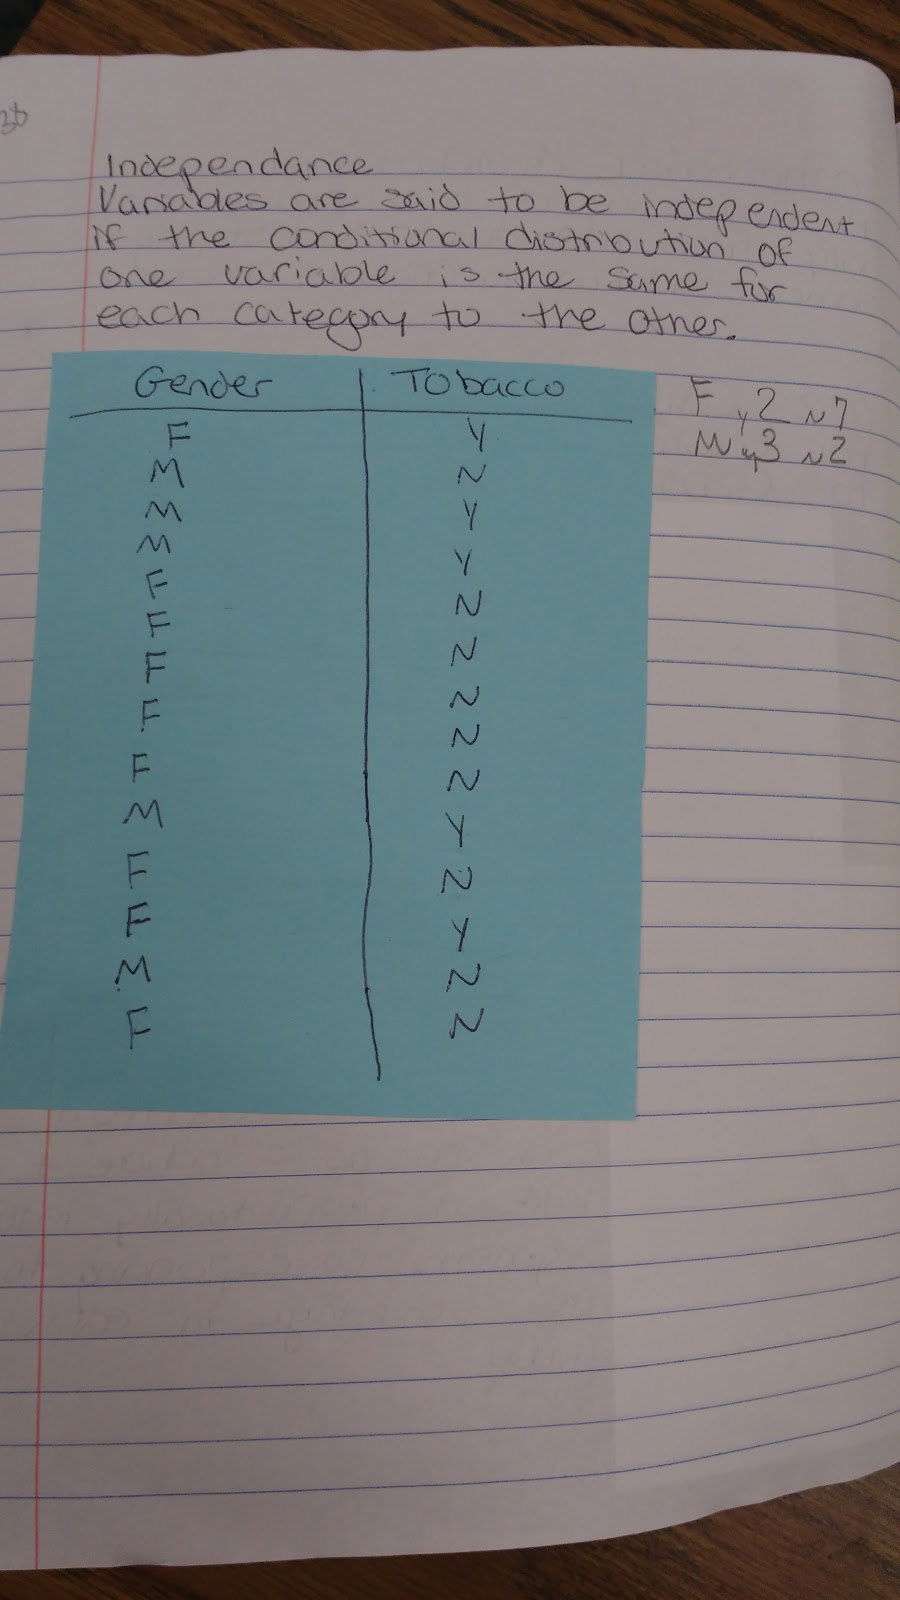
Students had to design a survey to determine if two variables were independent or dependent.
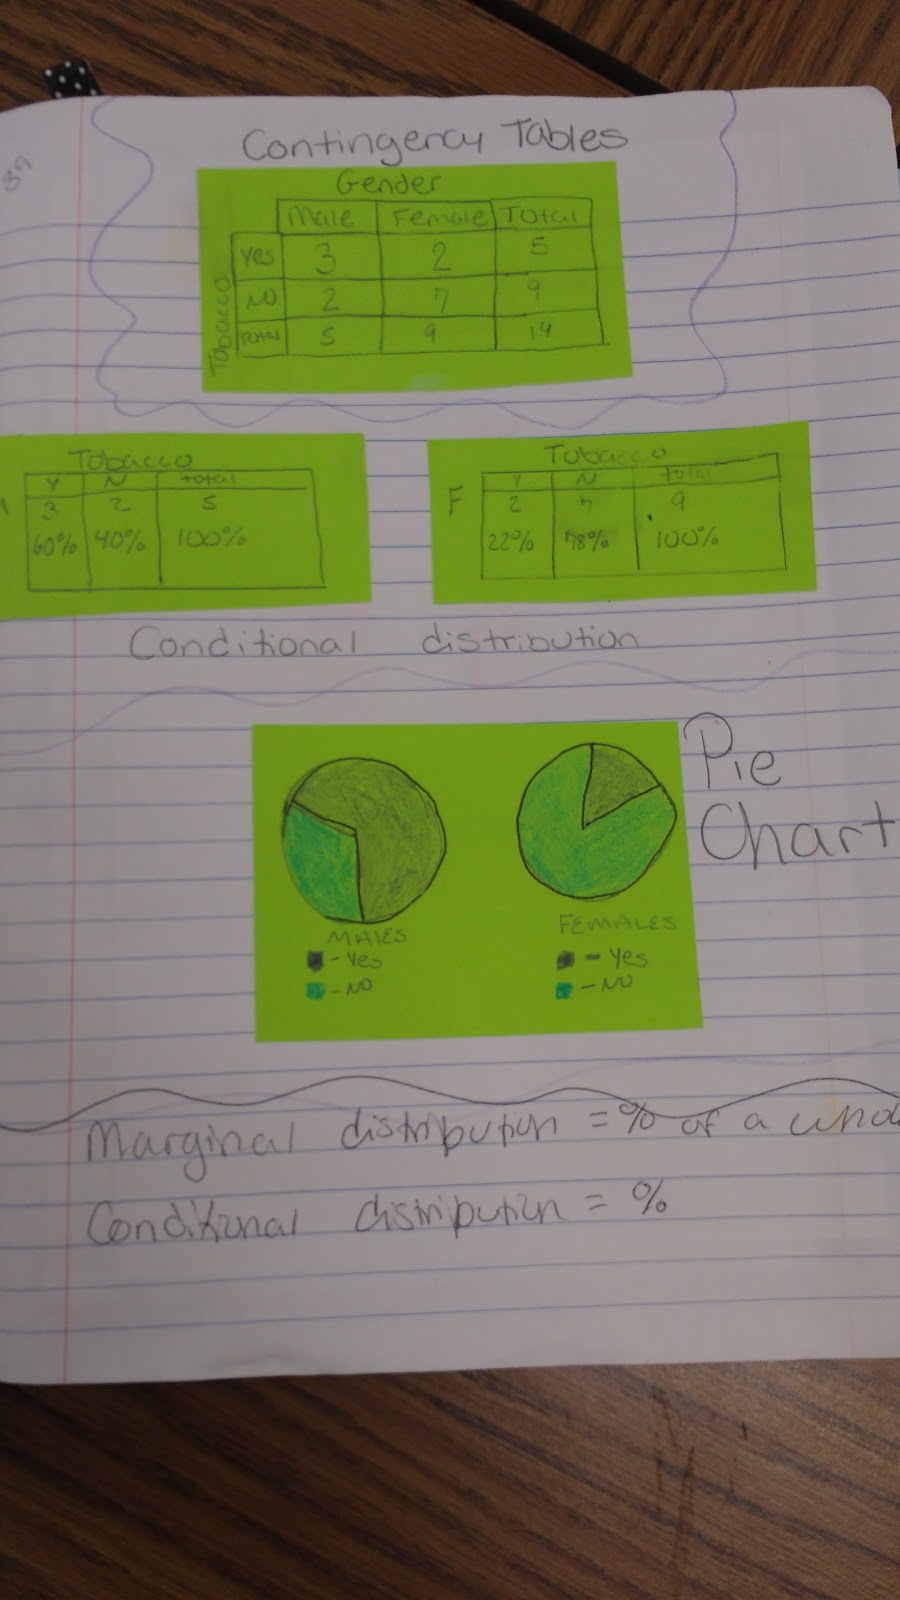
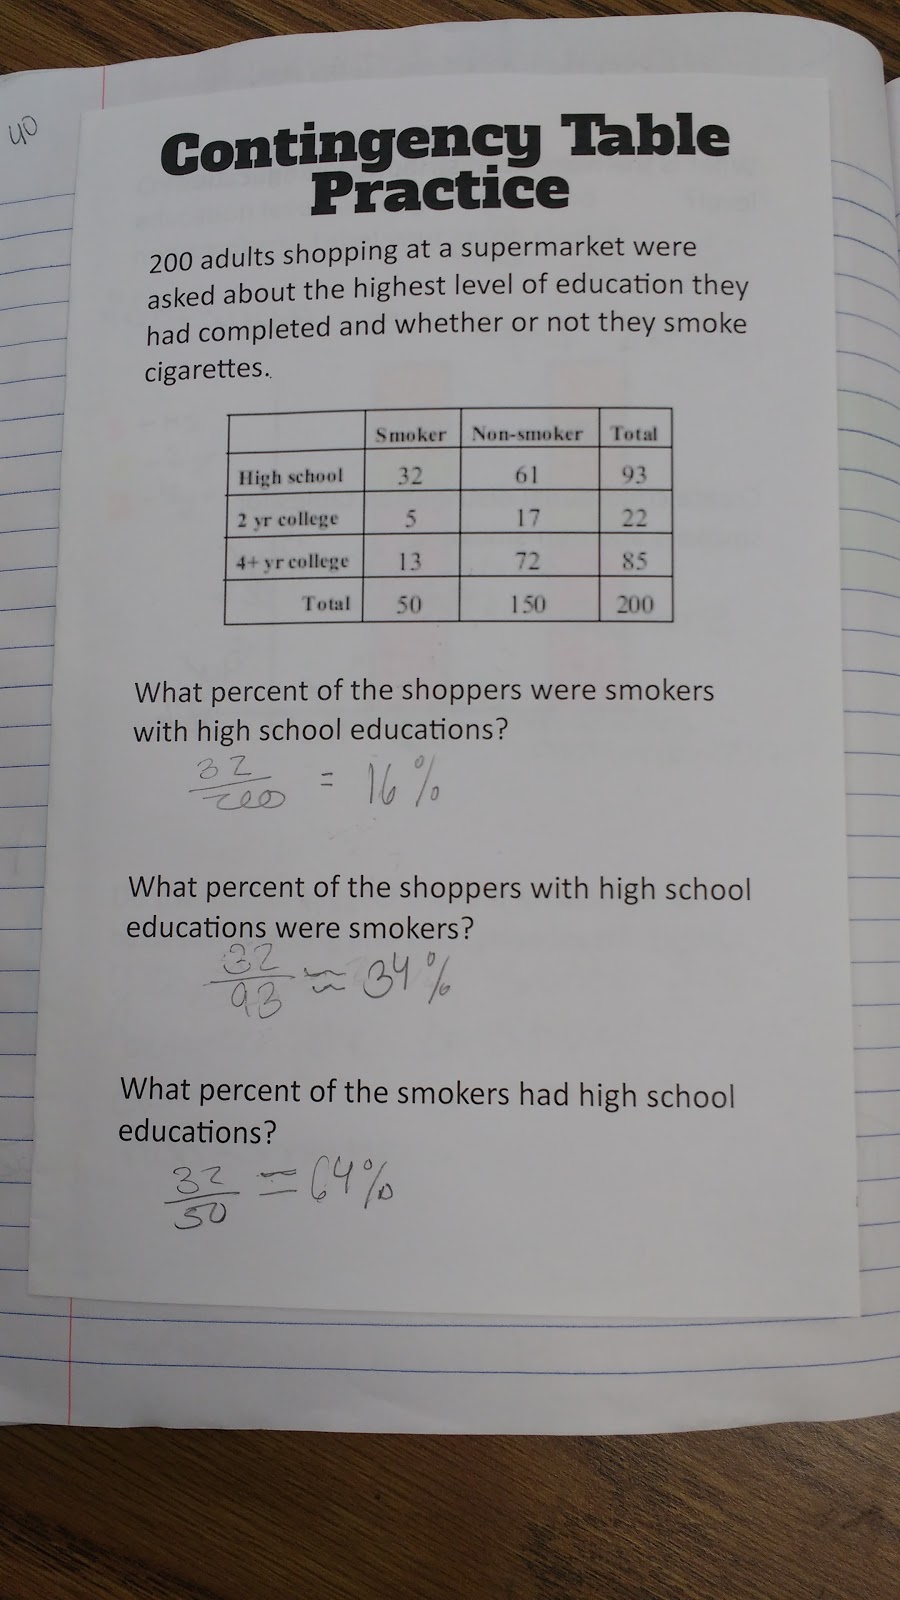
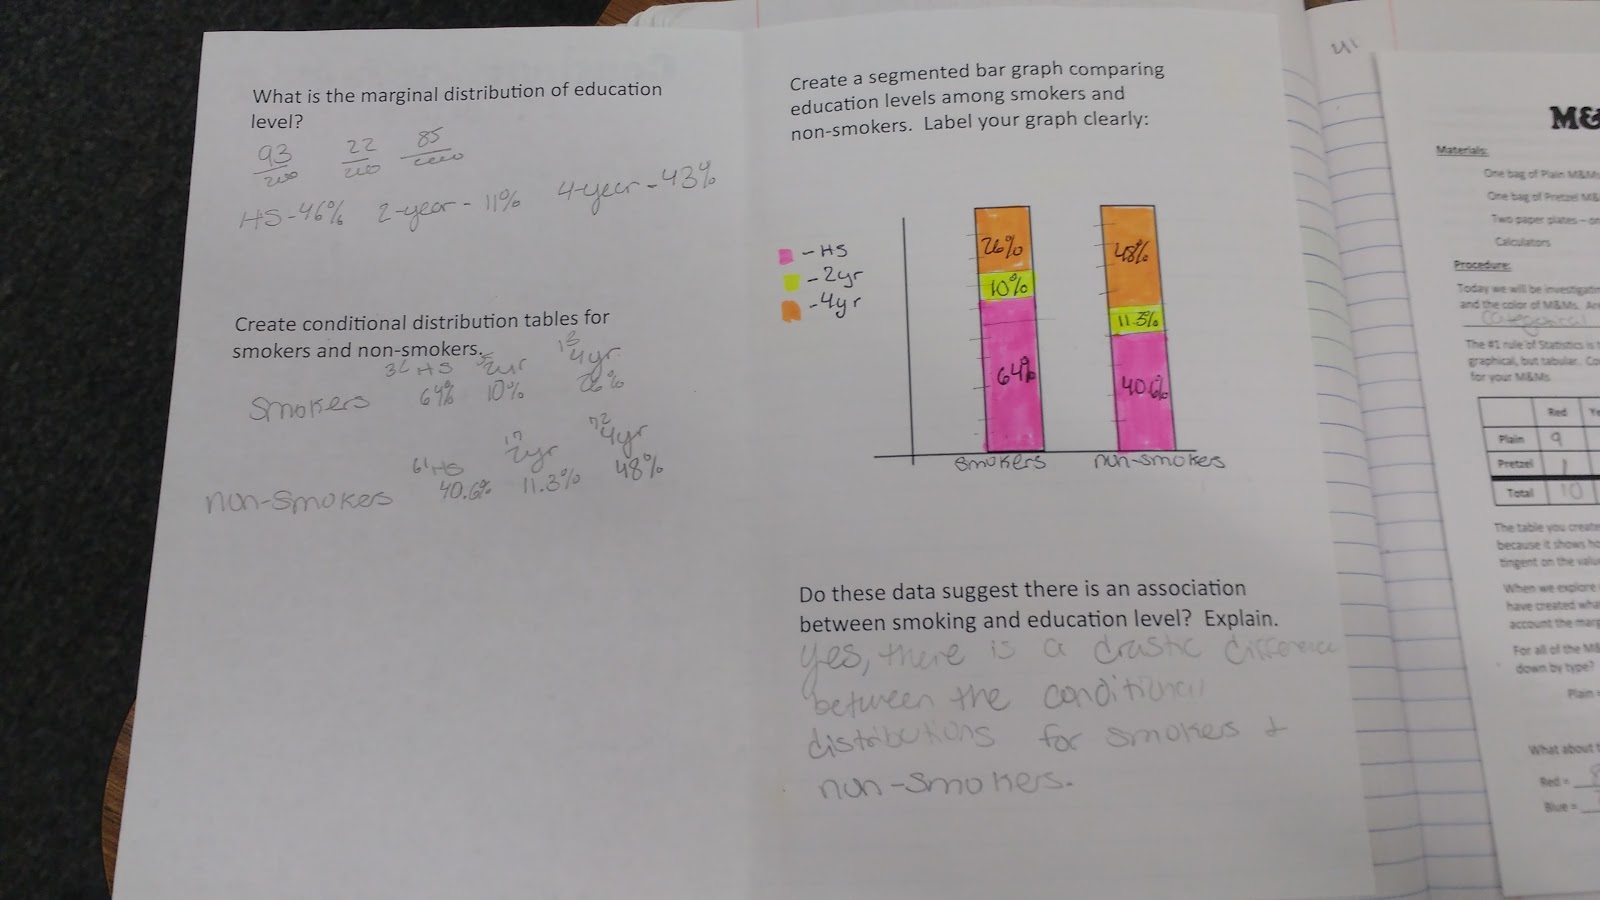
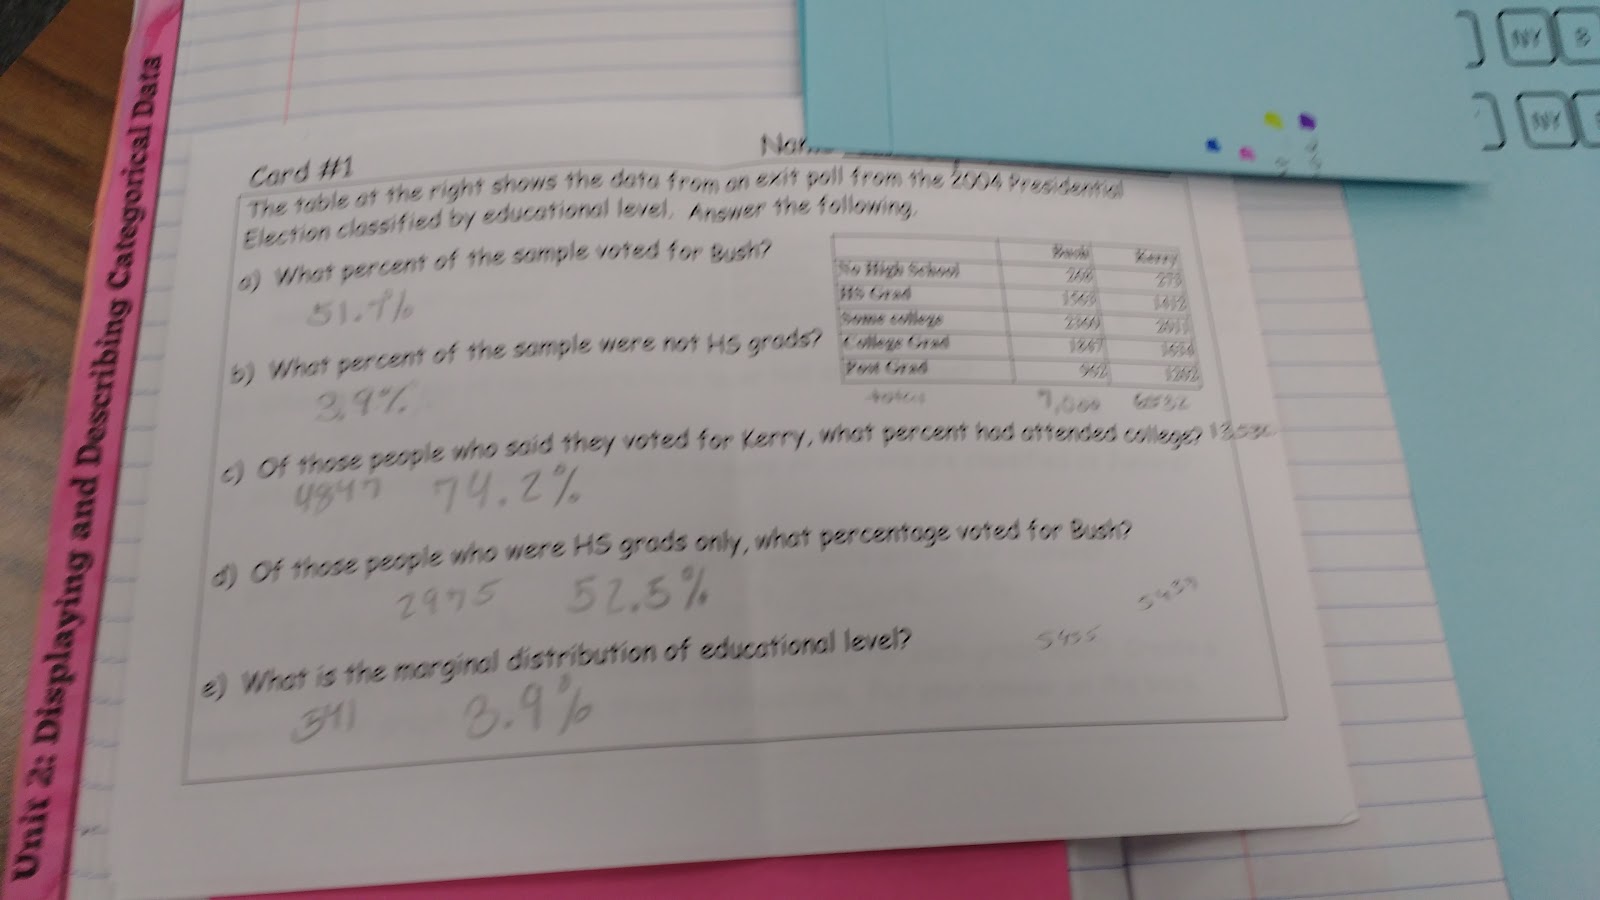
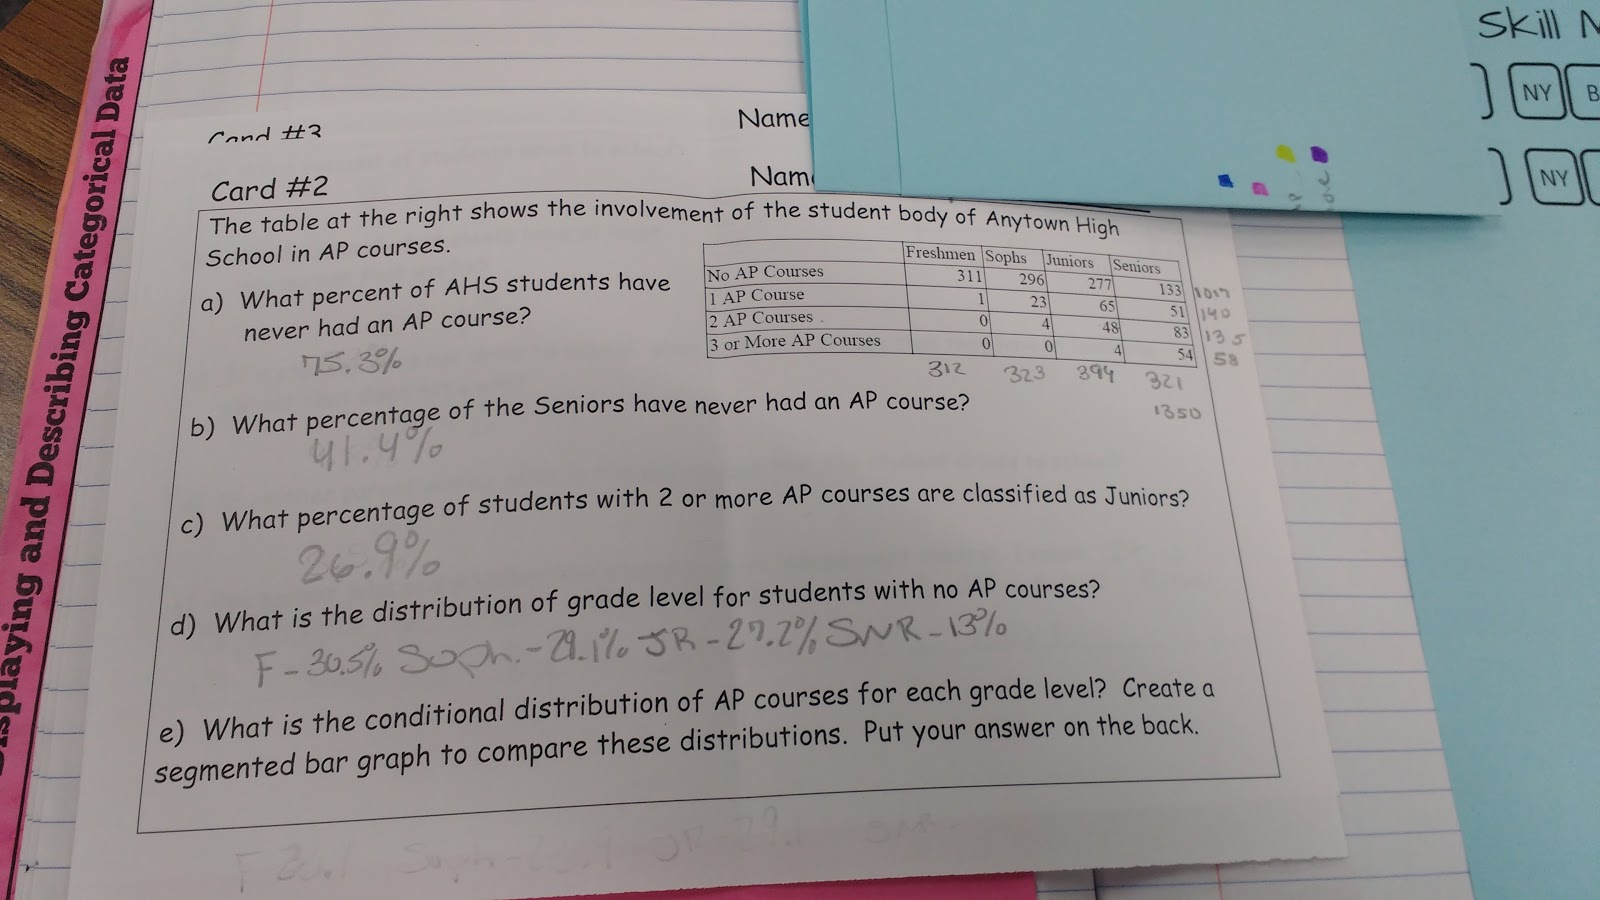
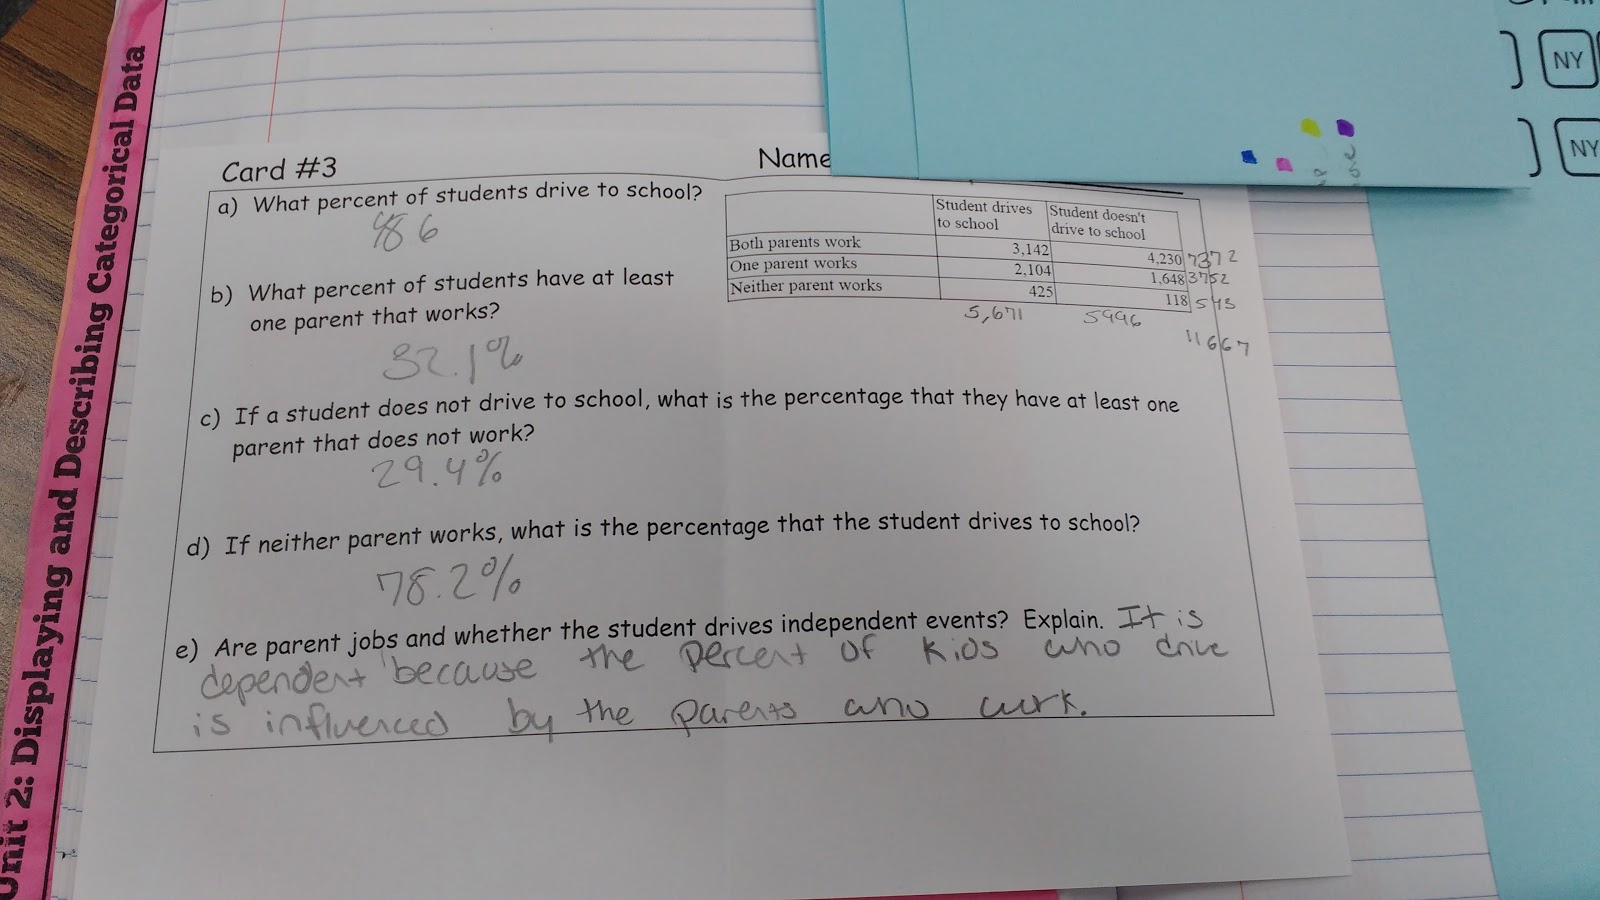
Contingency Table Practice:
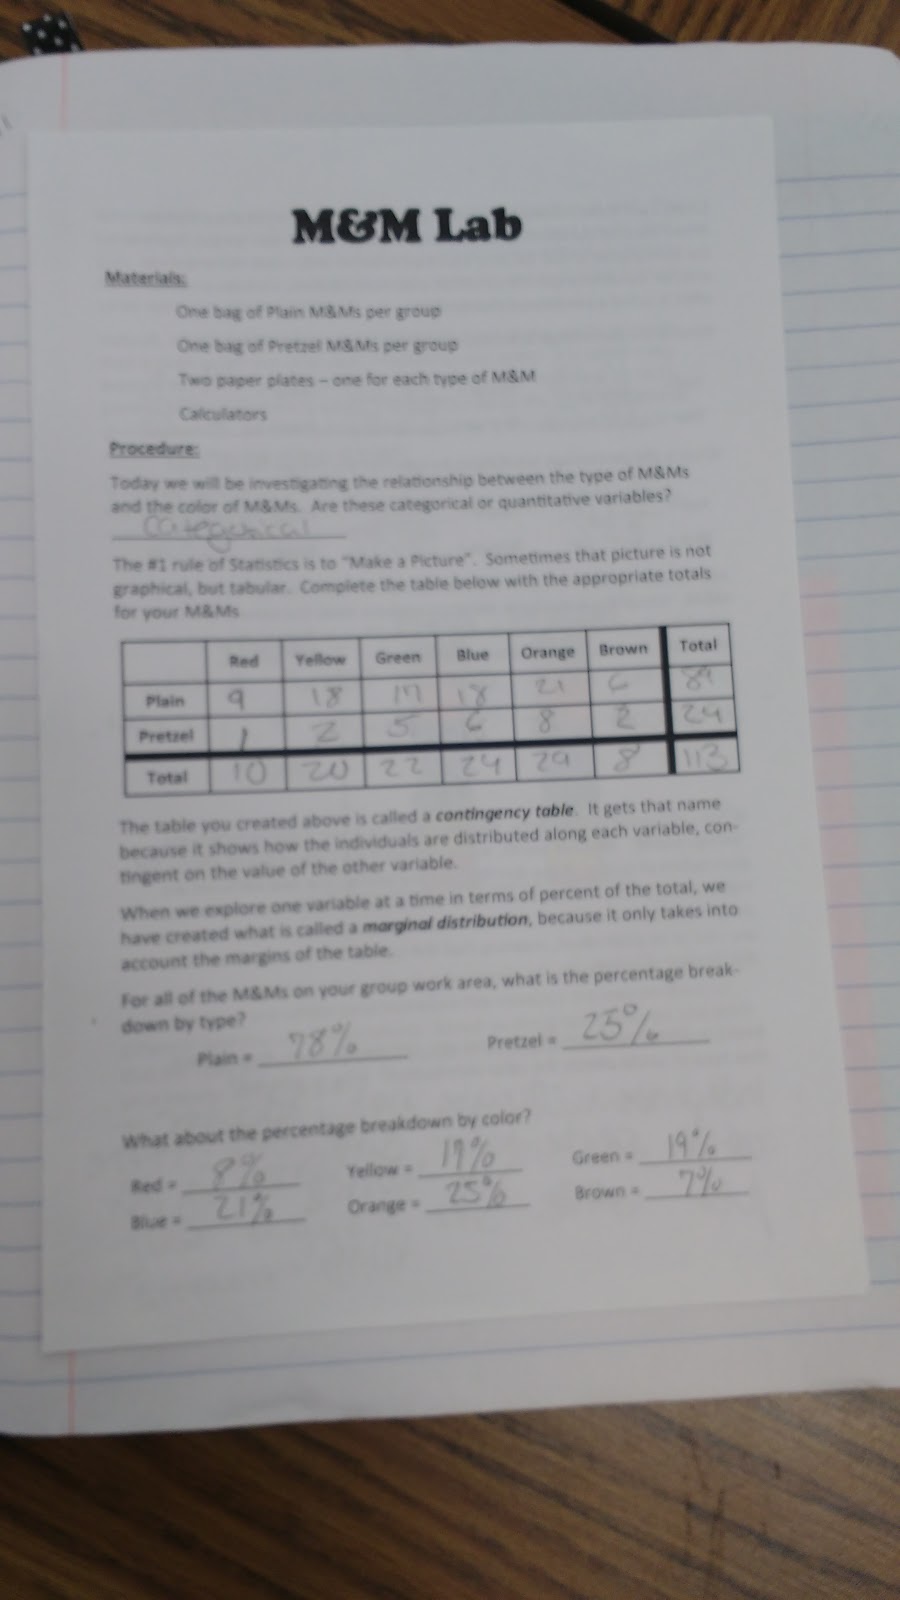
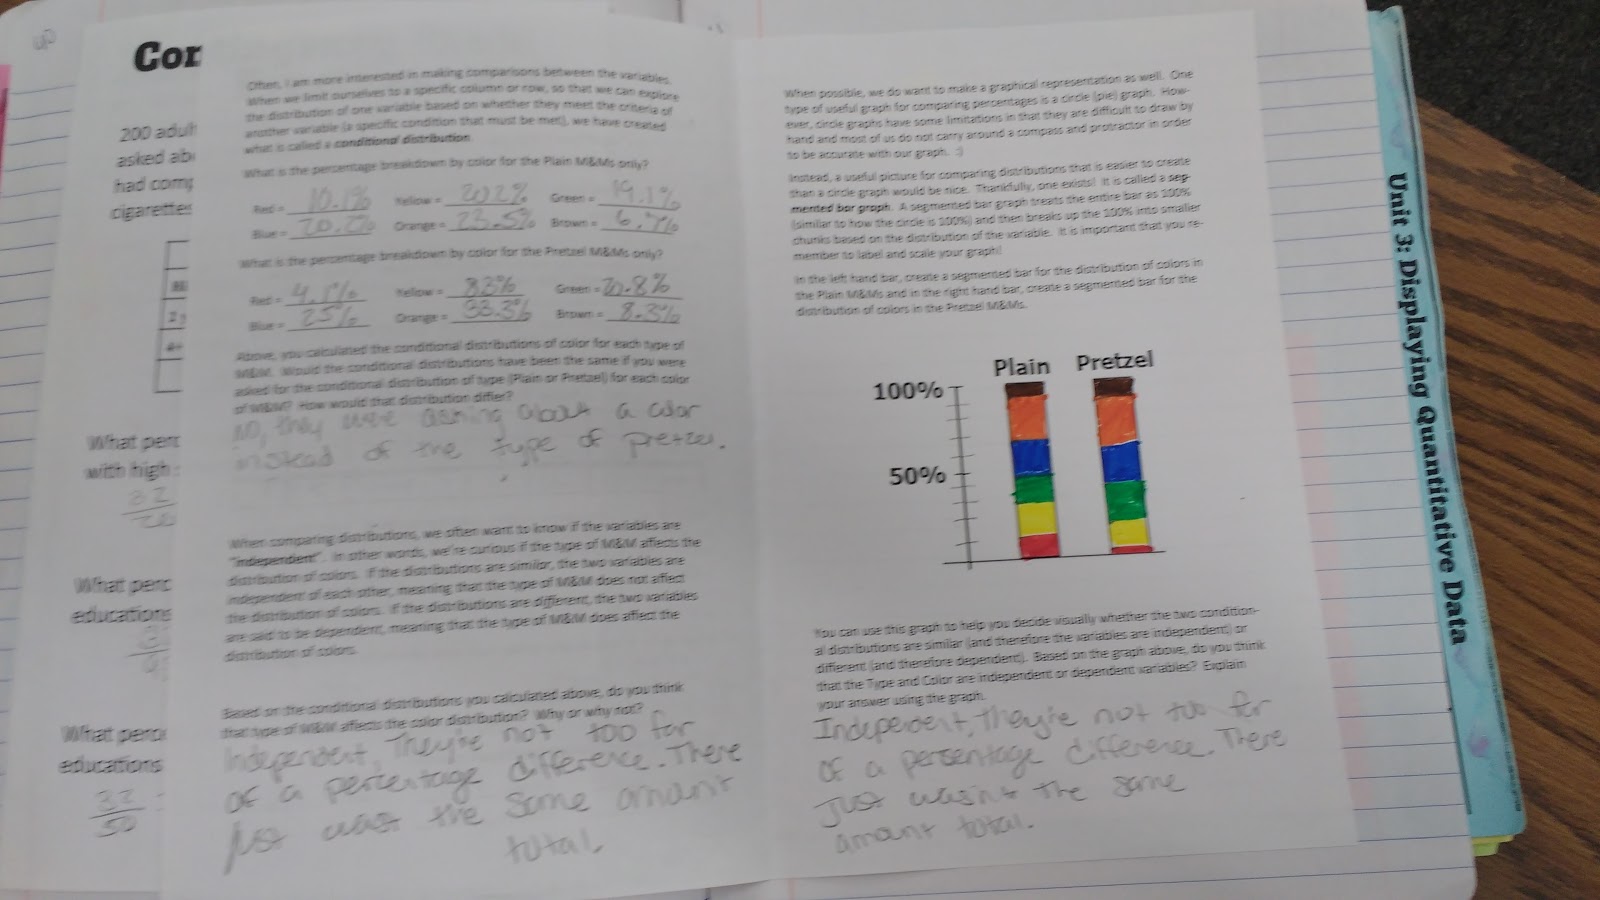
M&M Lab – This was modified from @druinok. Almost all of what I have is thanks to her and her willingness to share resources!
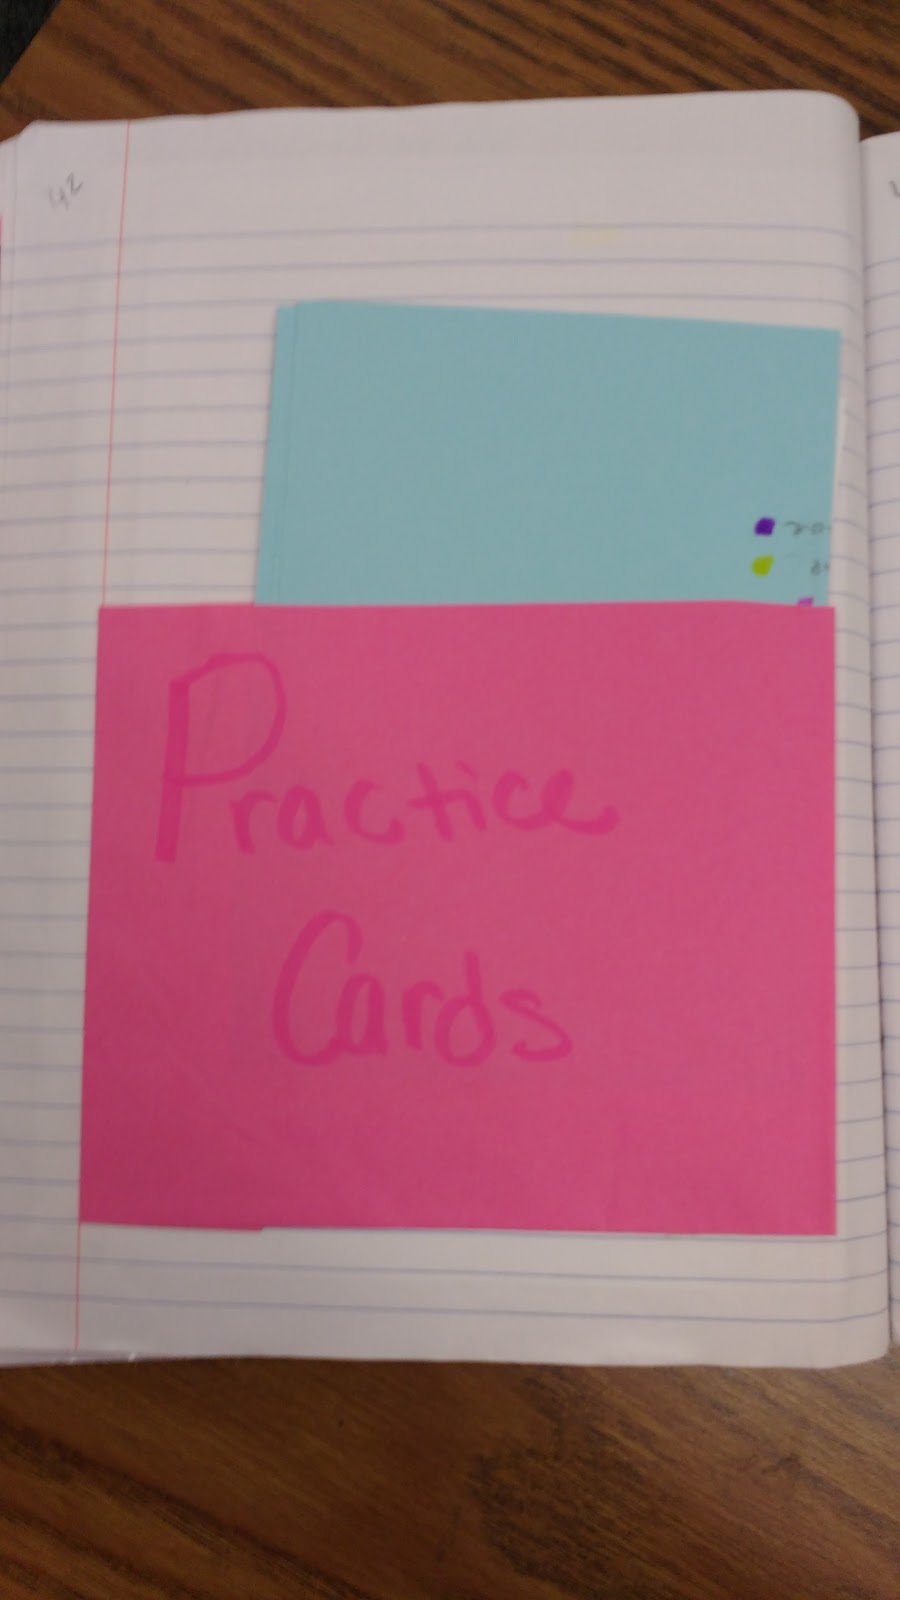
We made a pocket to hold our practice cards:
Unit 3!
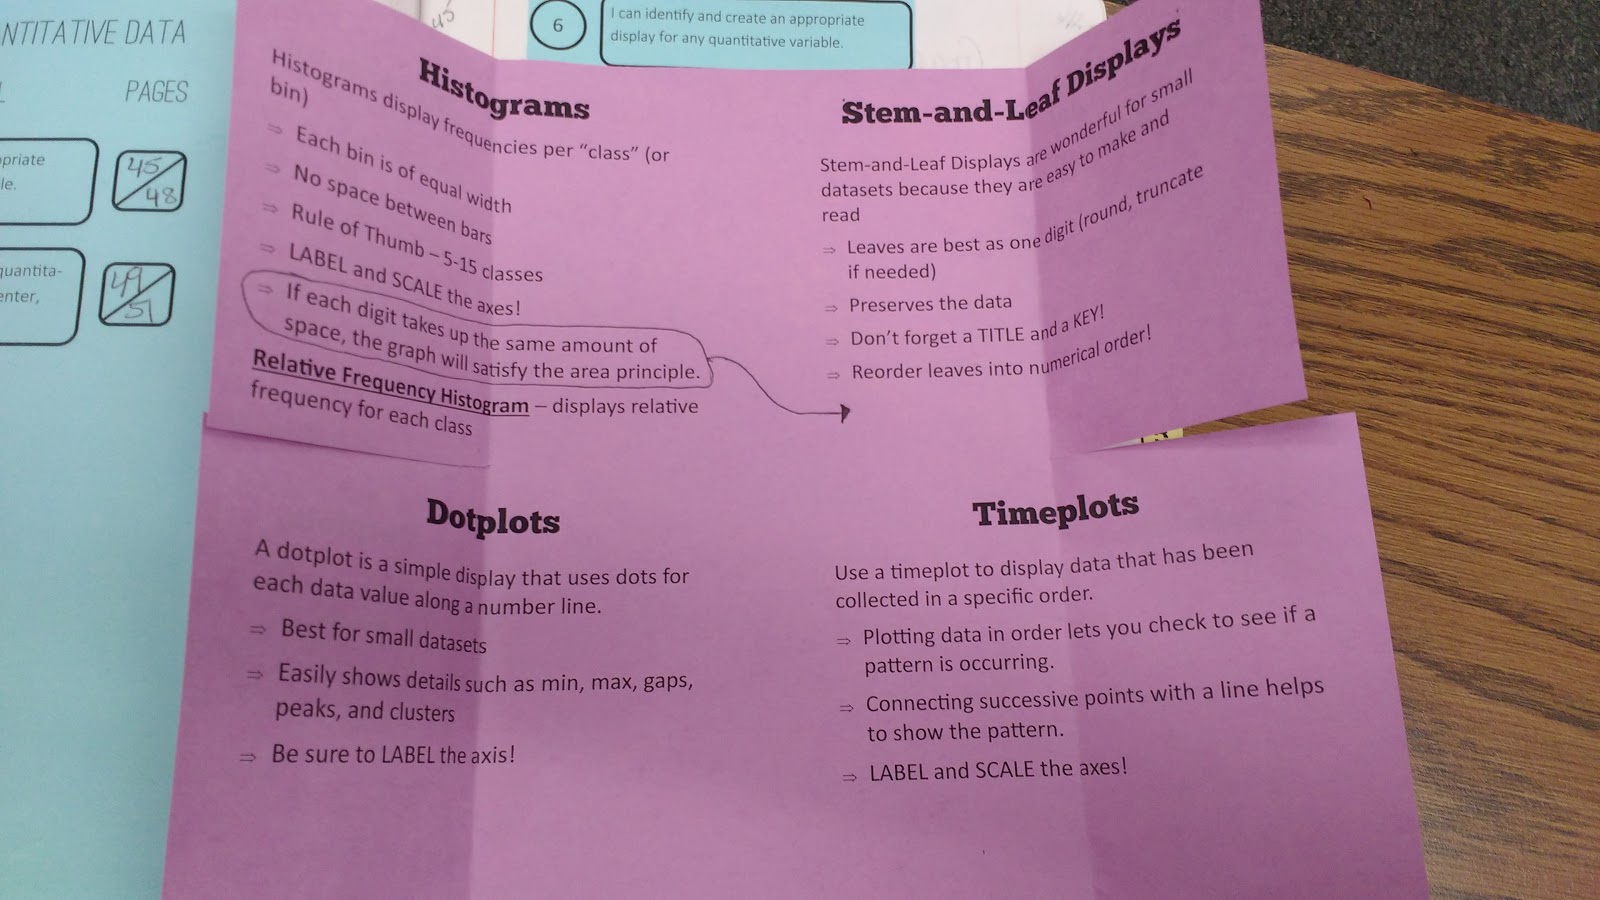
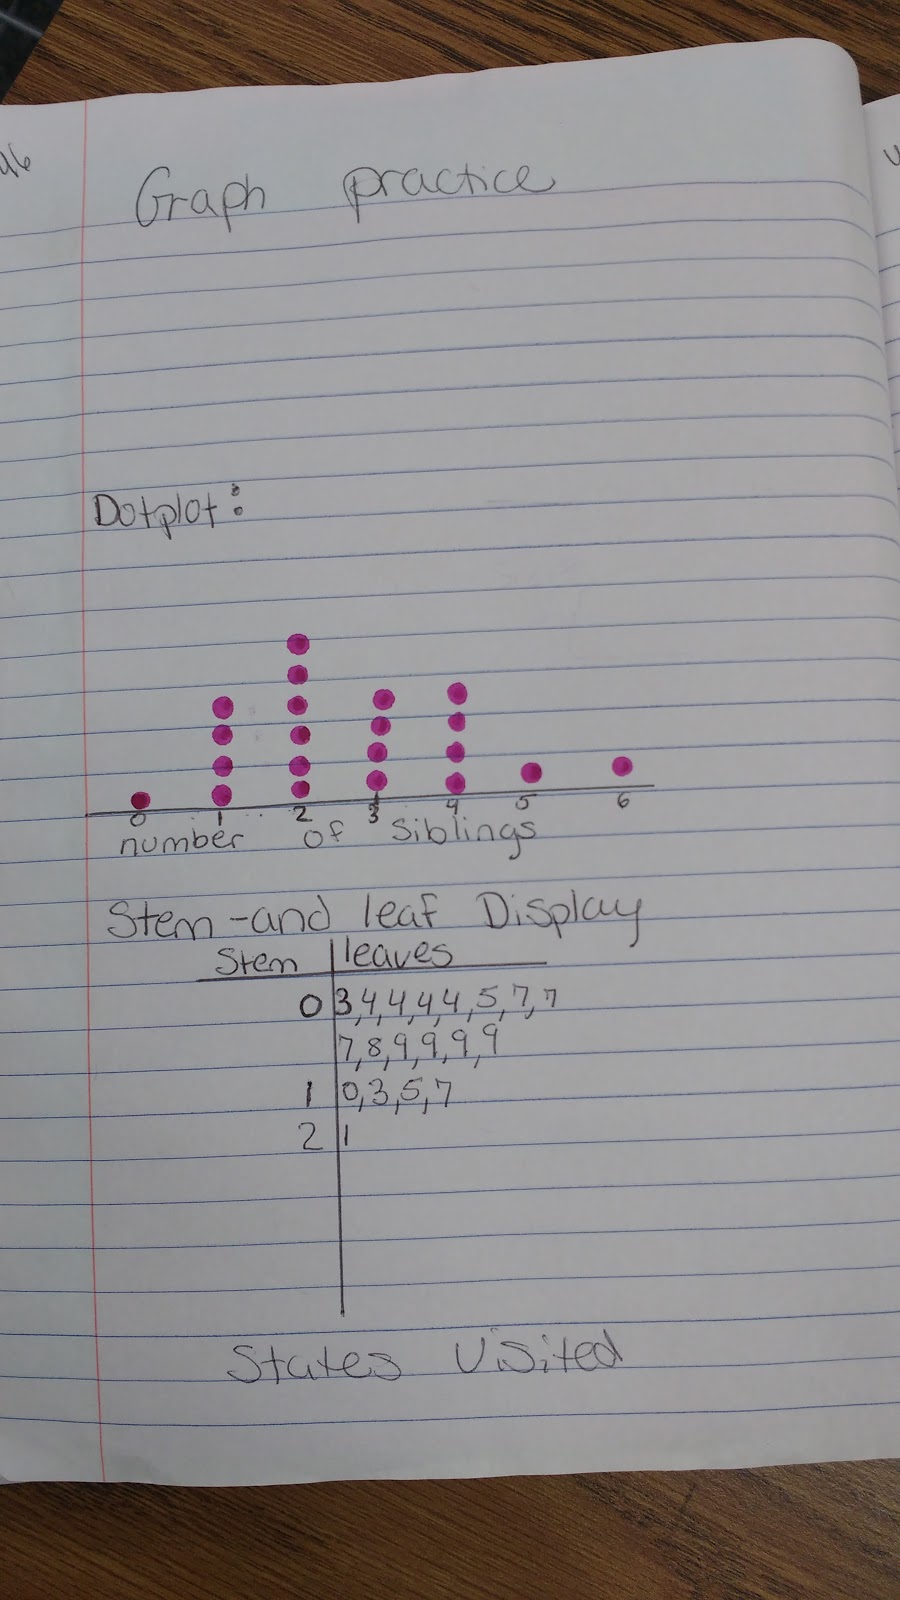
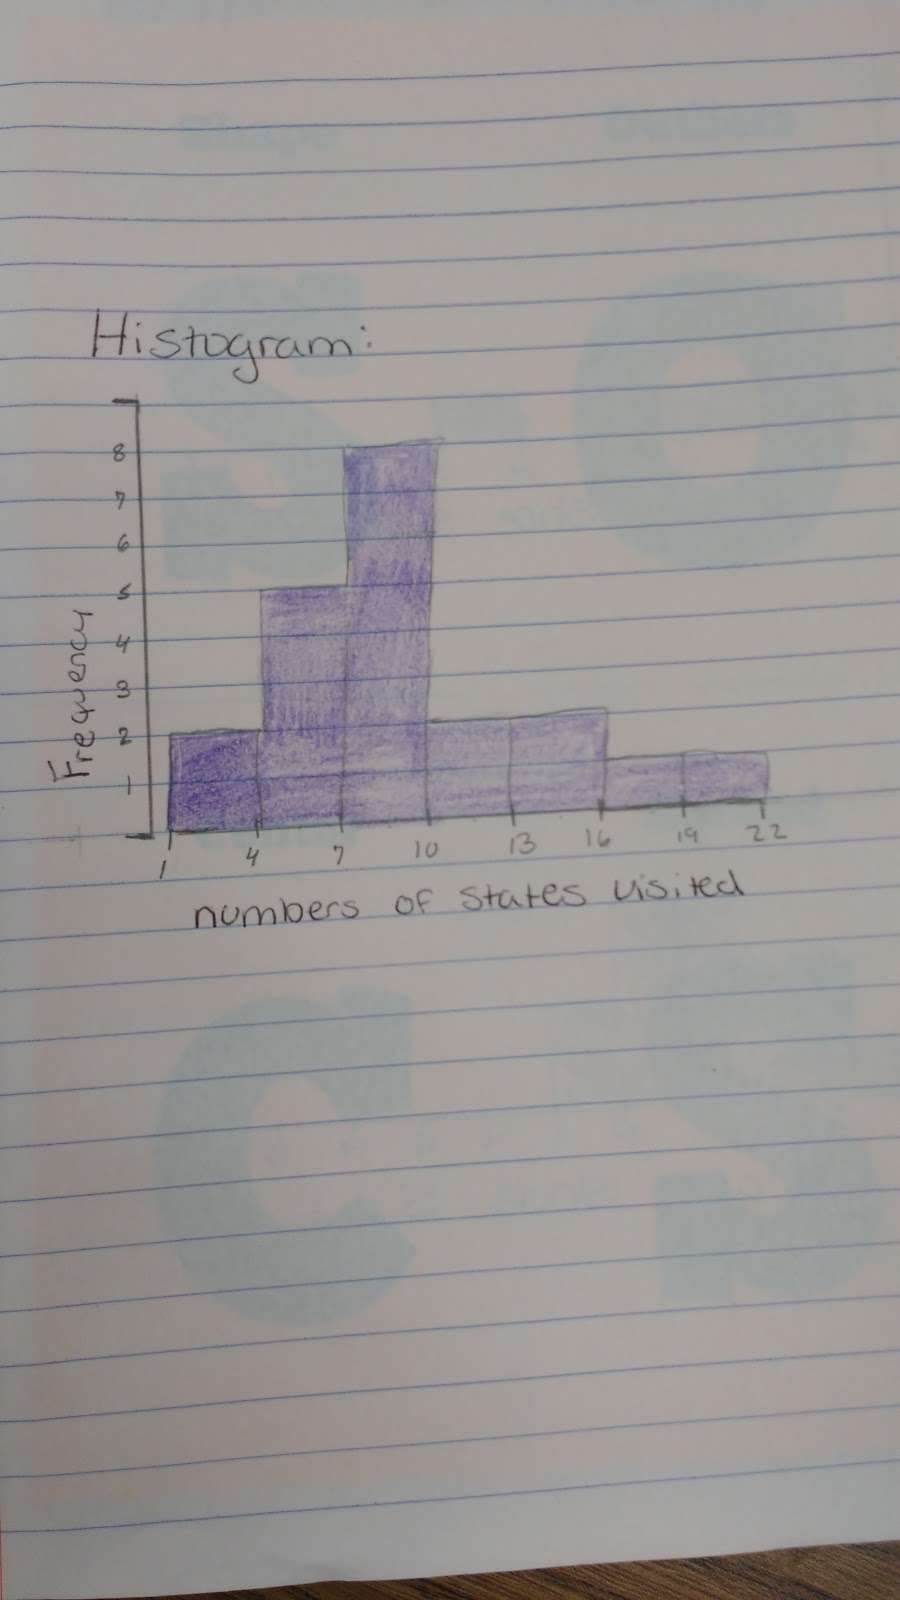
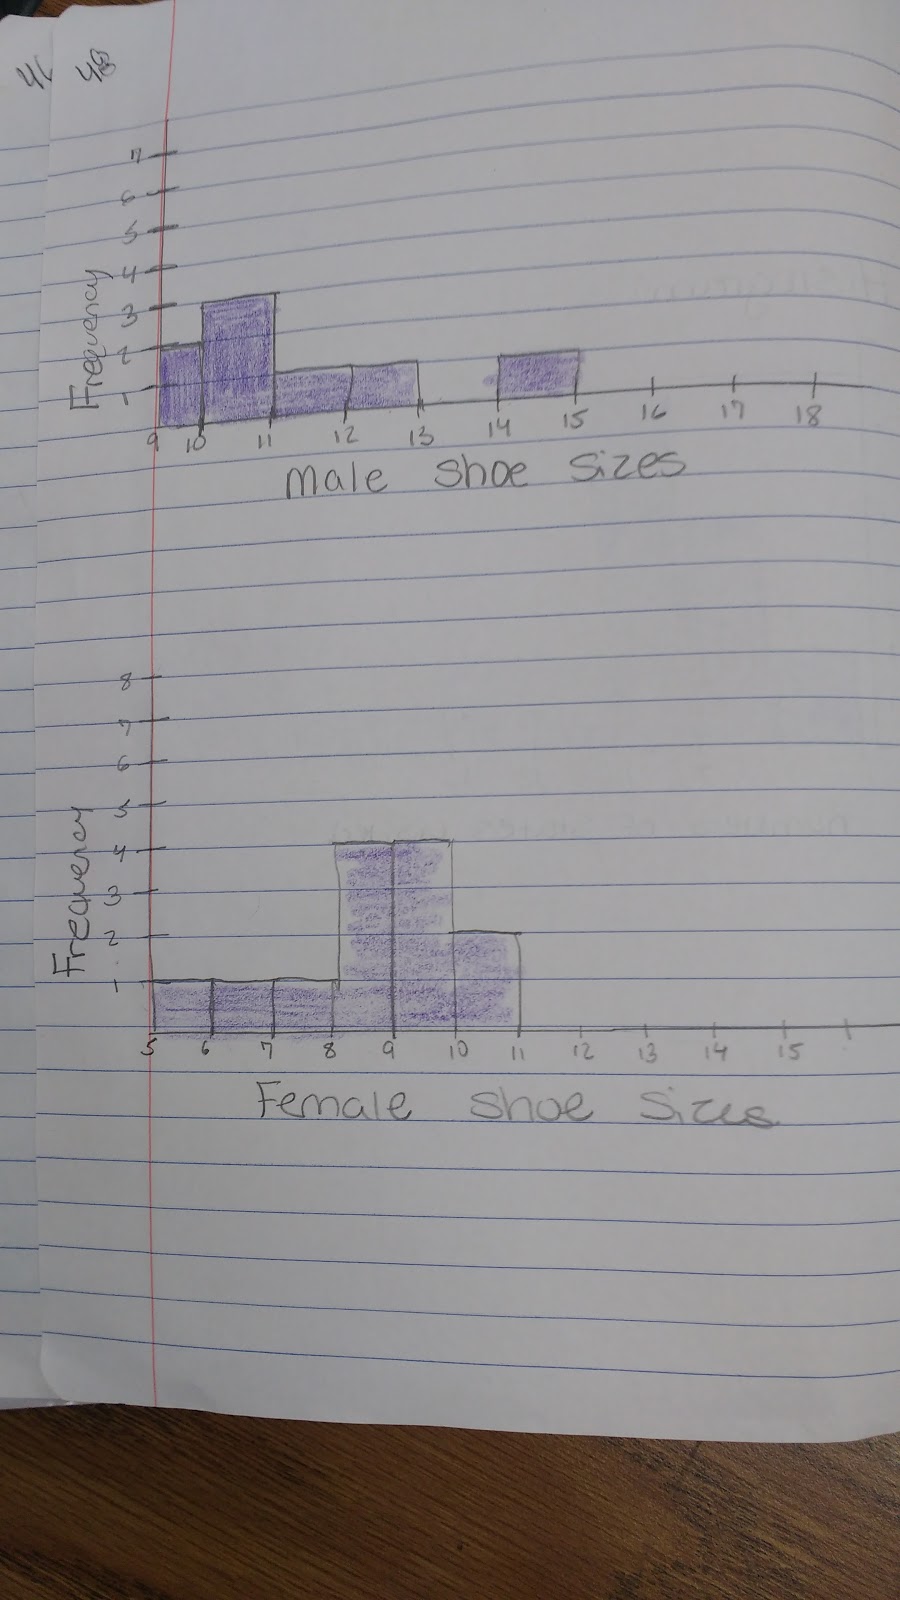
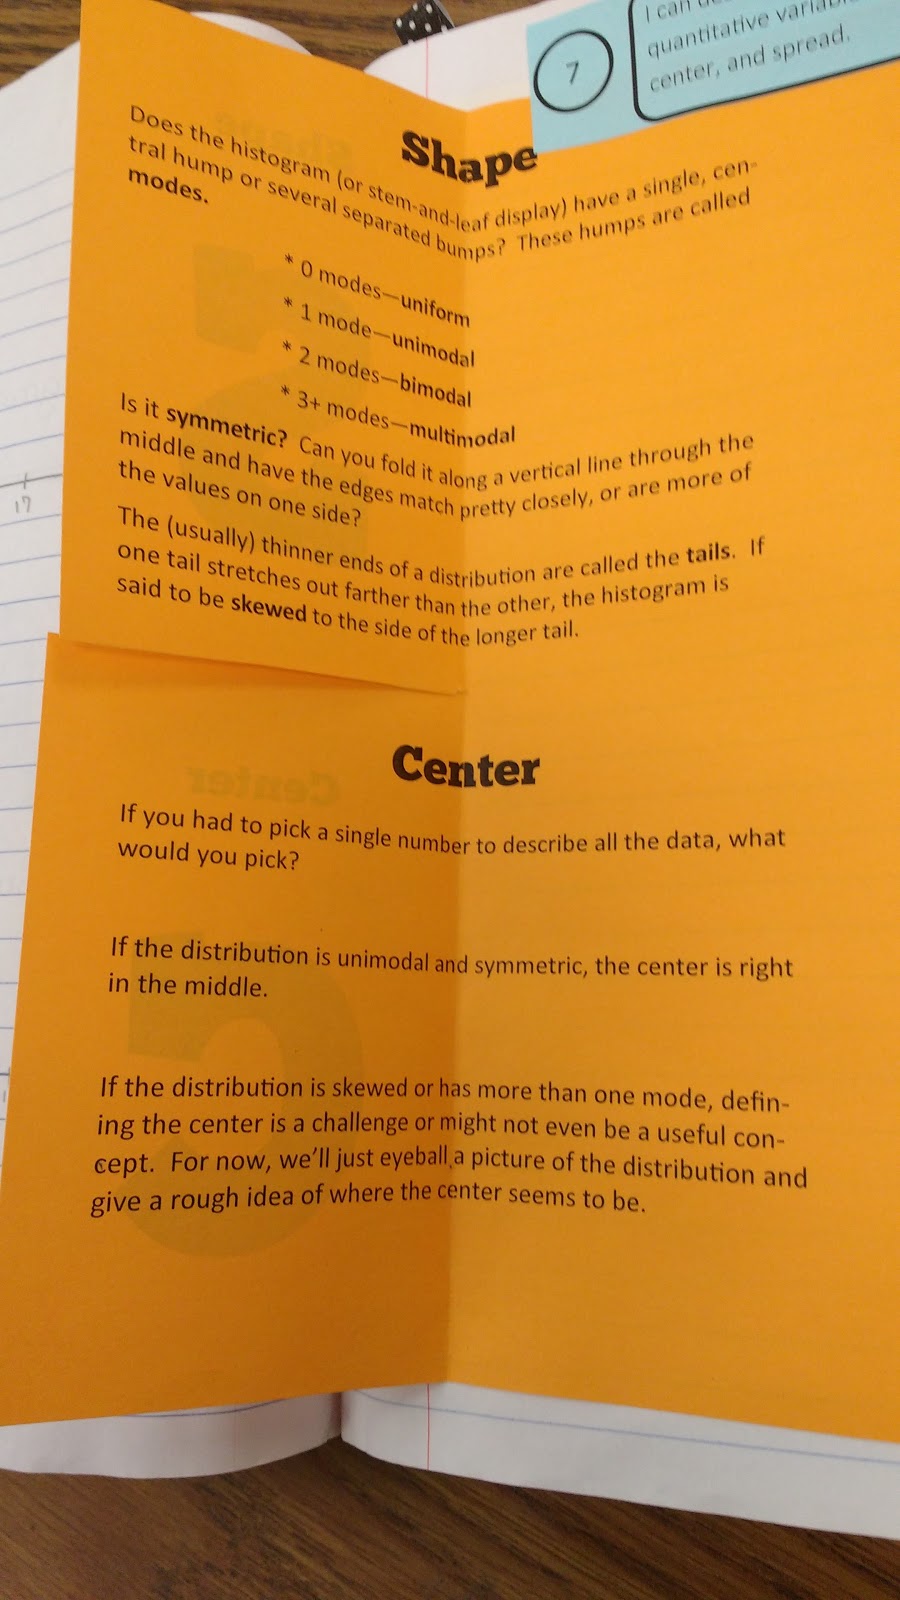
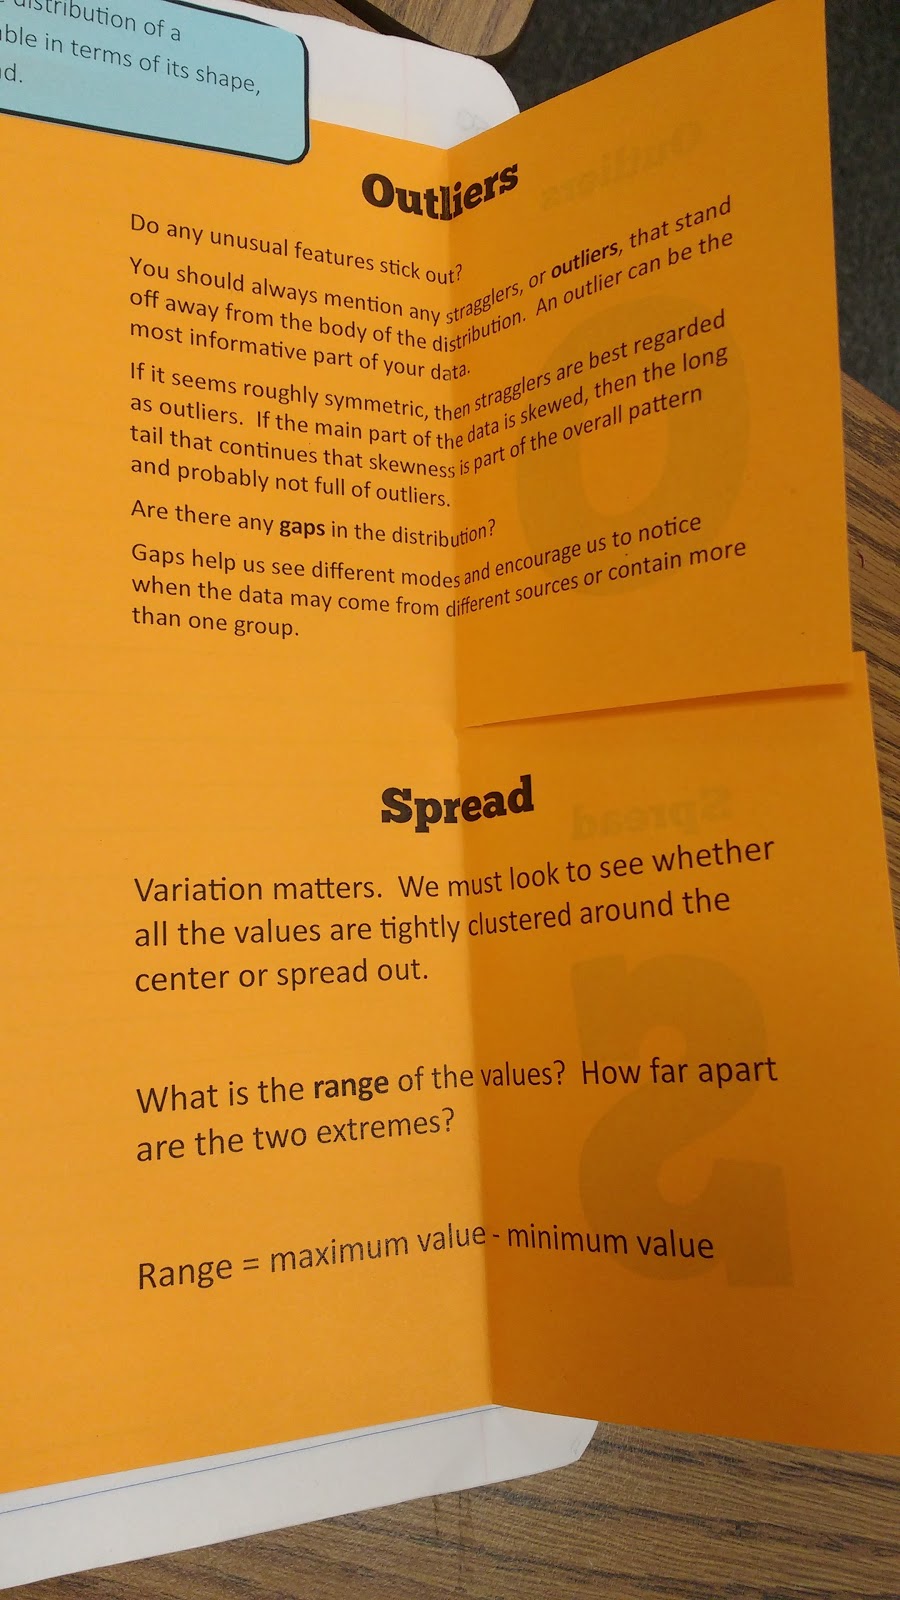
Quantitative Data Displays Foldable:
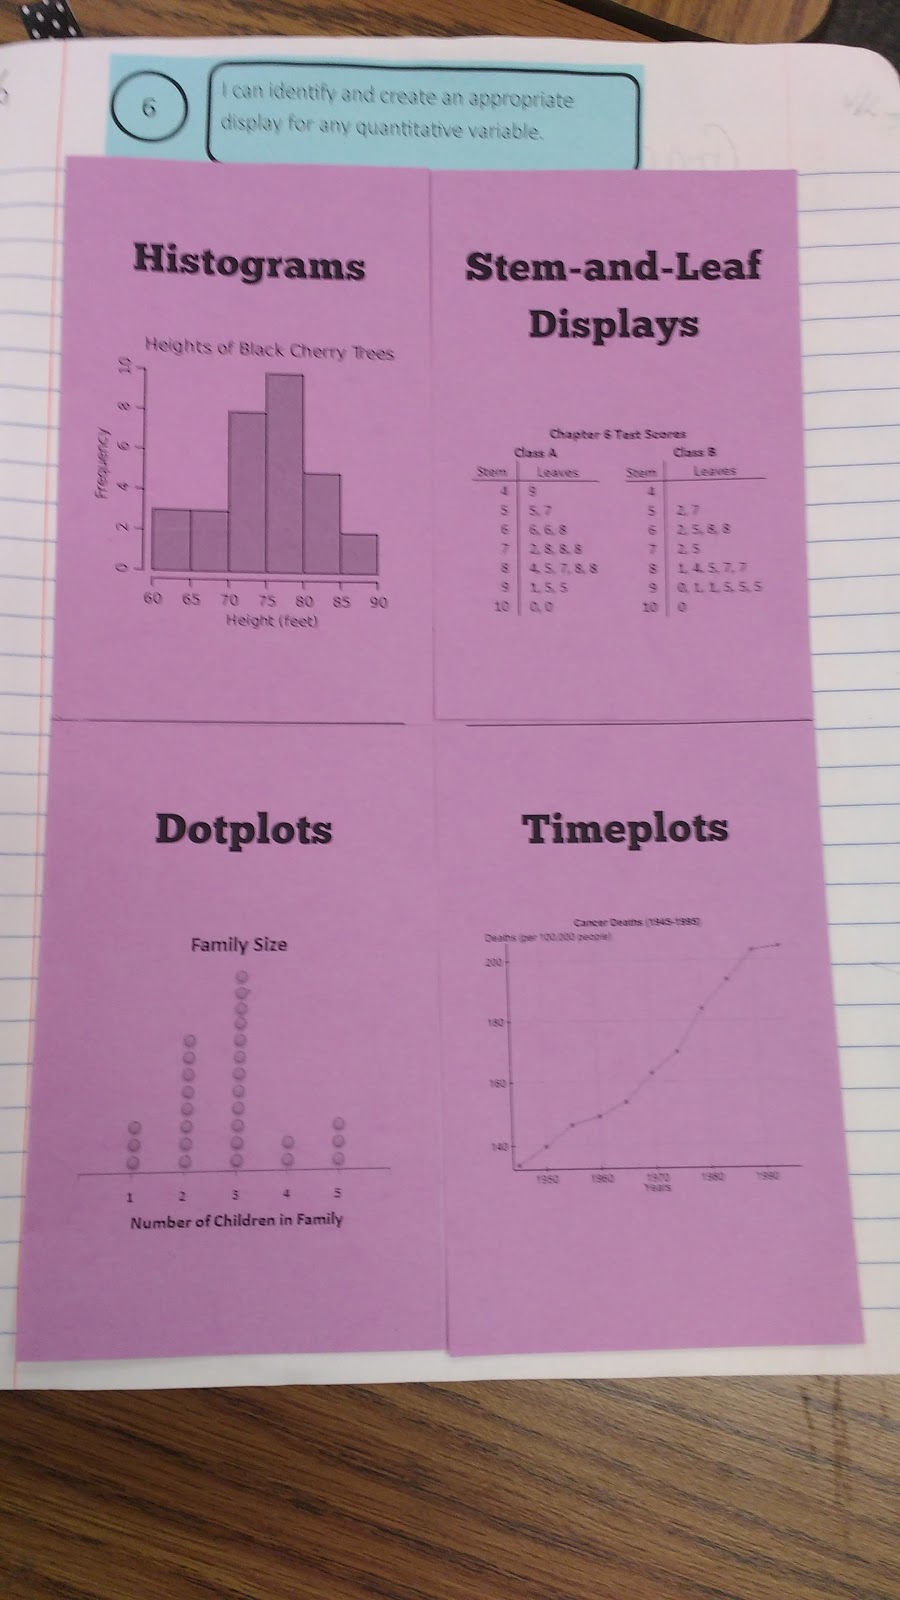
You can see that I accidentally typed something under the wrong section. Oops!
We practiced making graphs from our class survey results.
I love the SOCS acronym that @druinok shared with me. I blogged about this foldable here.
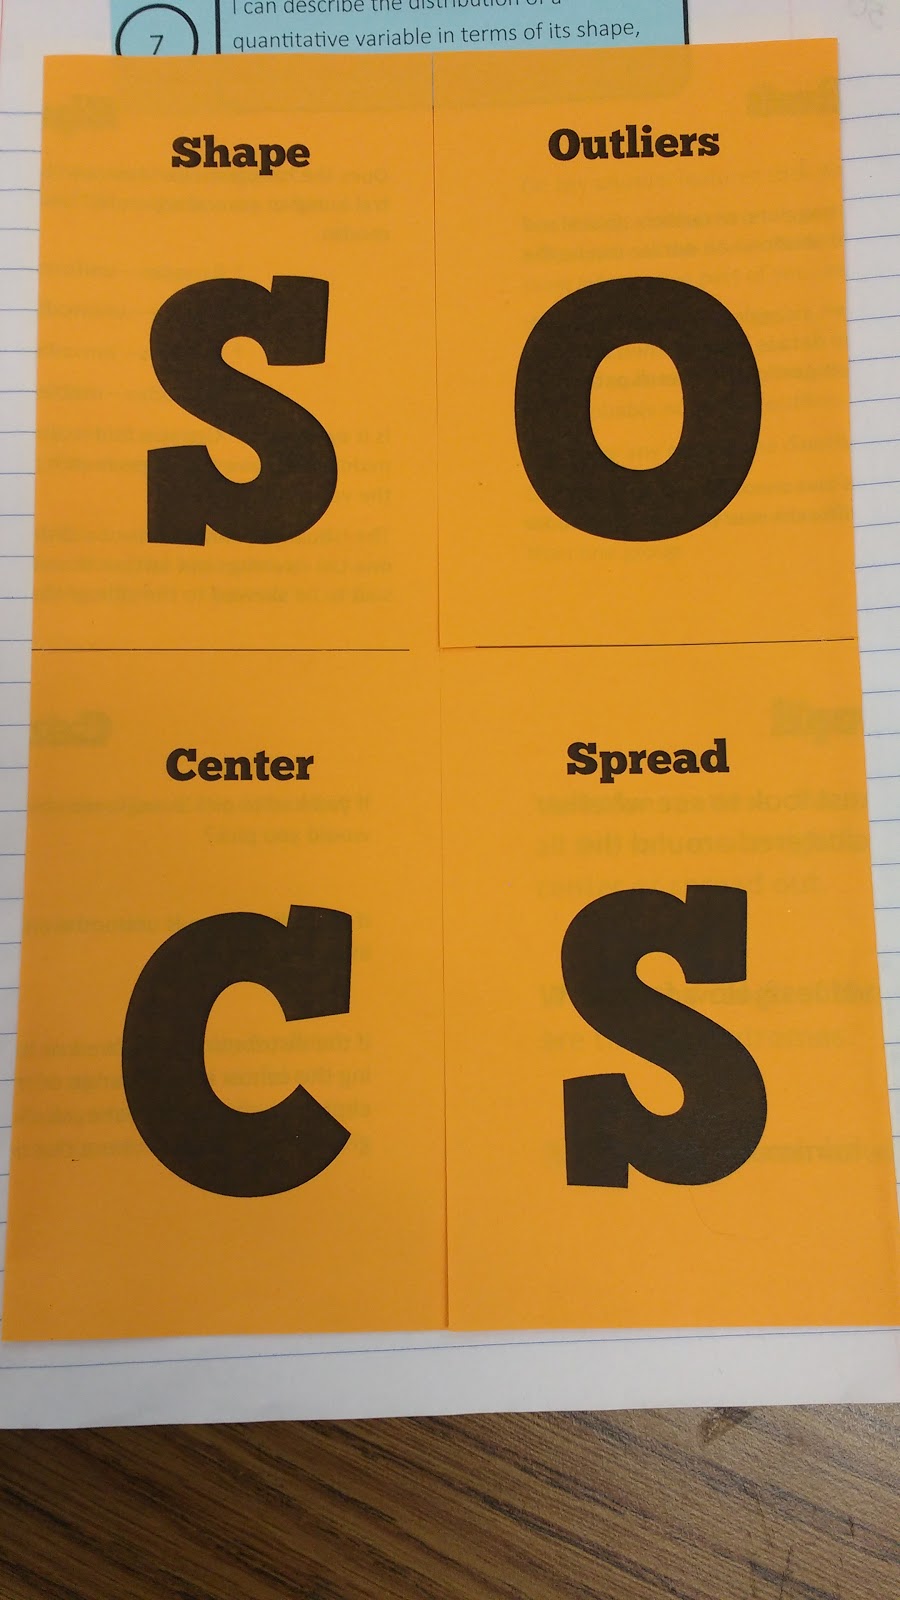
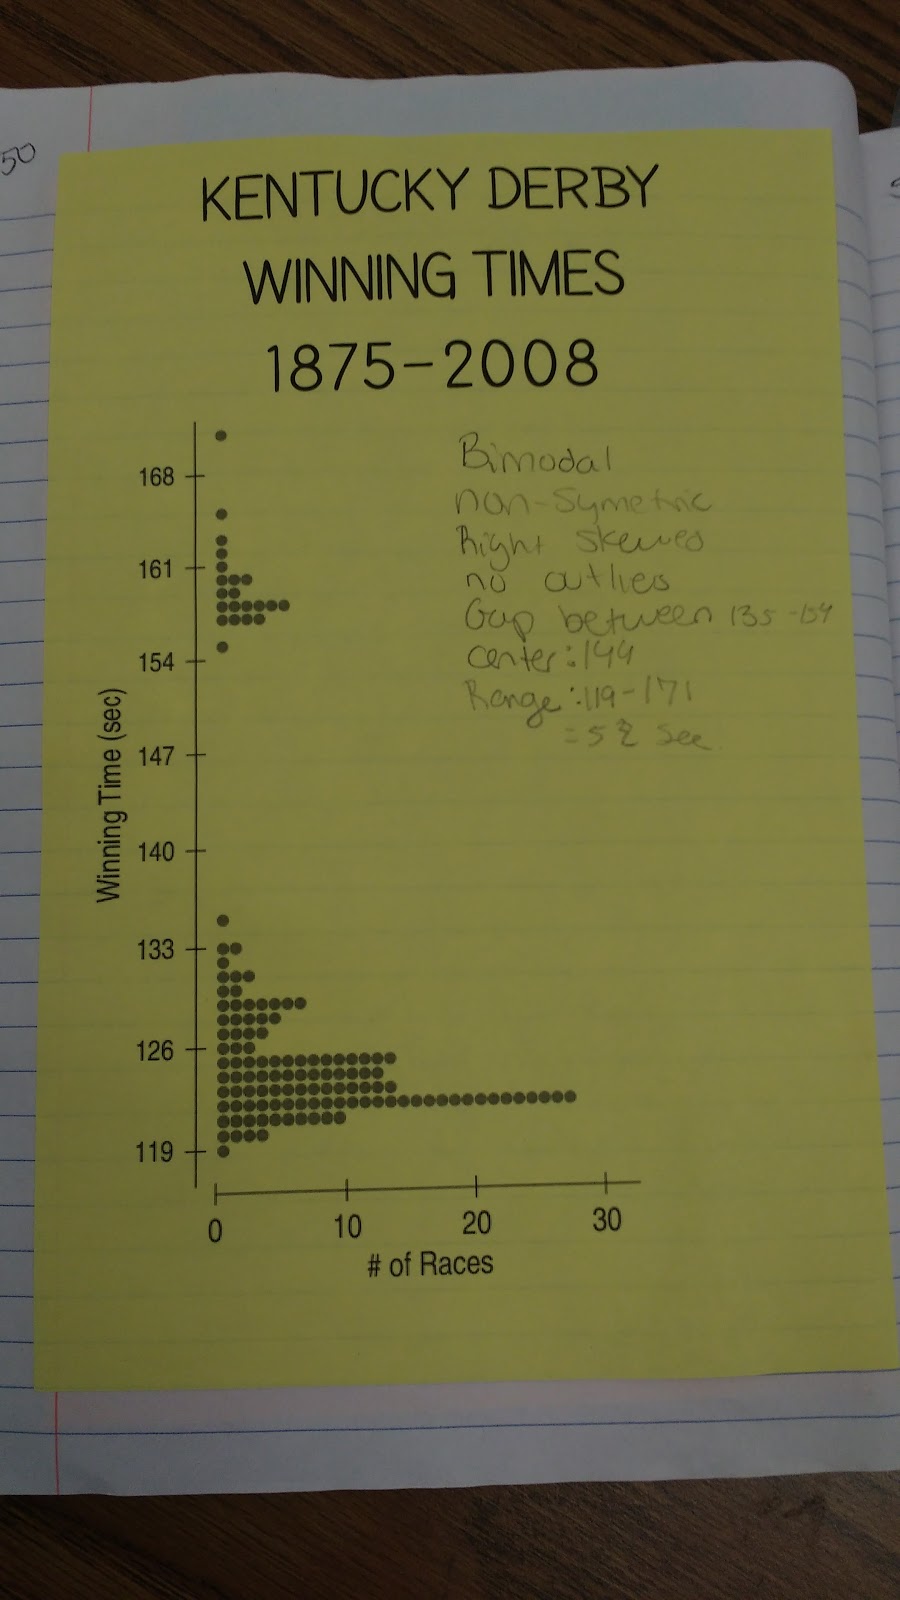
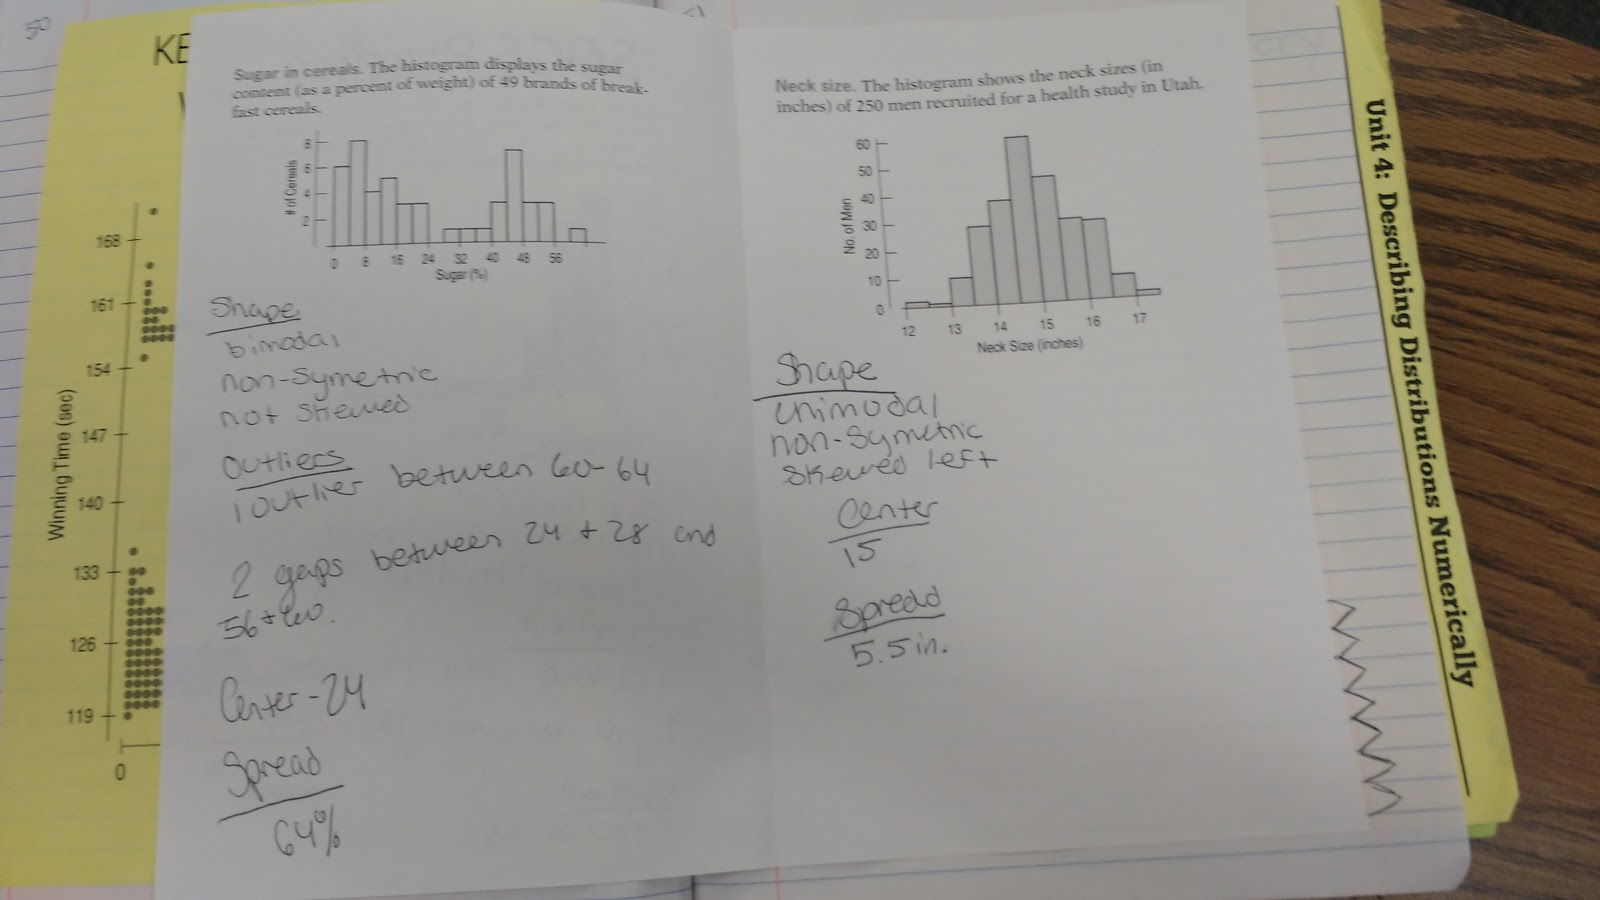
We looked at the shape, outliers, center, and spread of the Kentucky Derby Winning Times from 1875 to 2008.
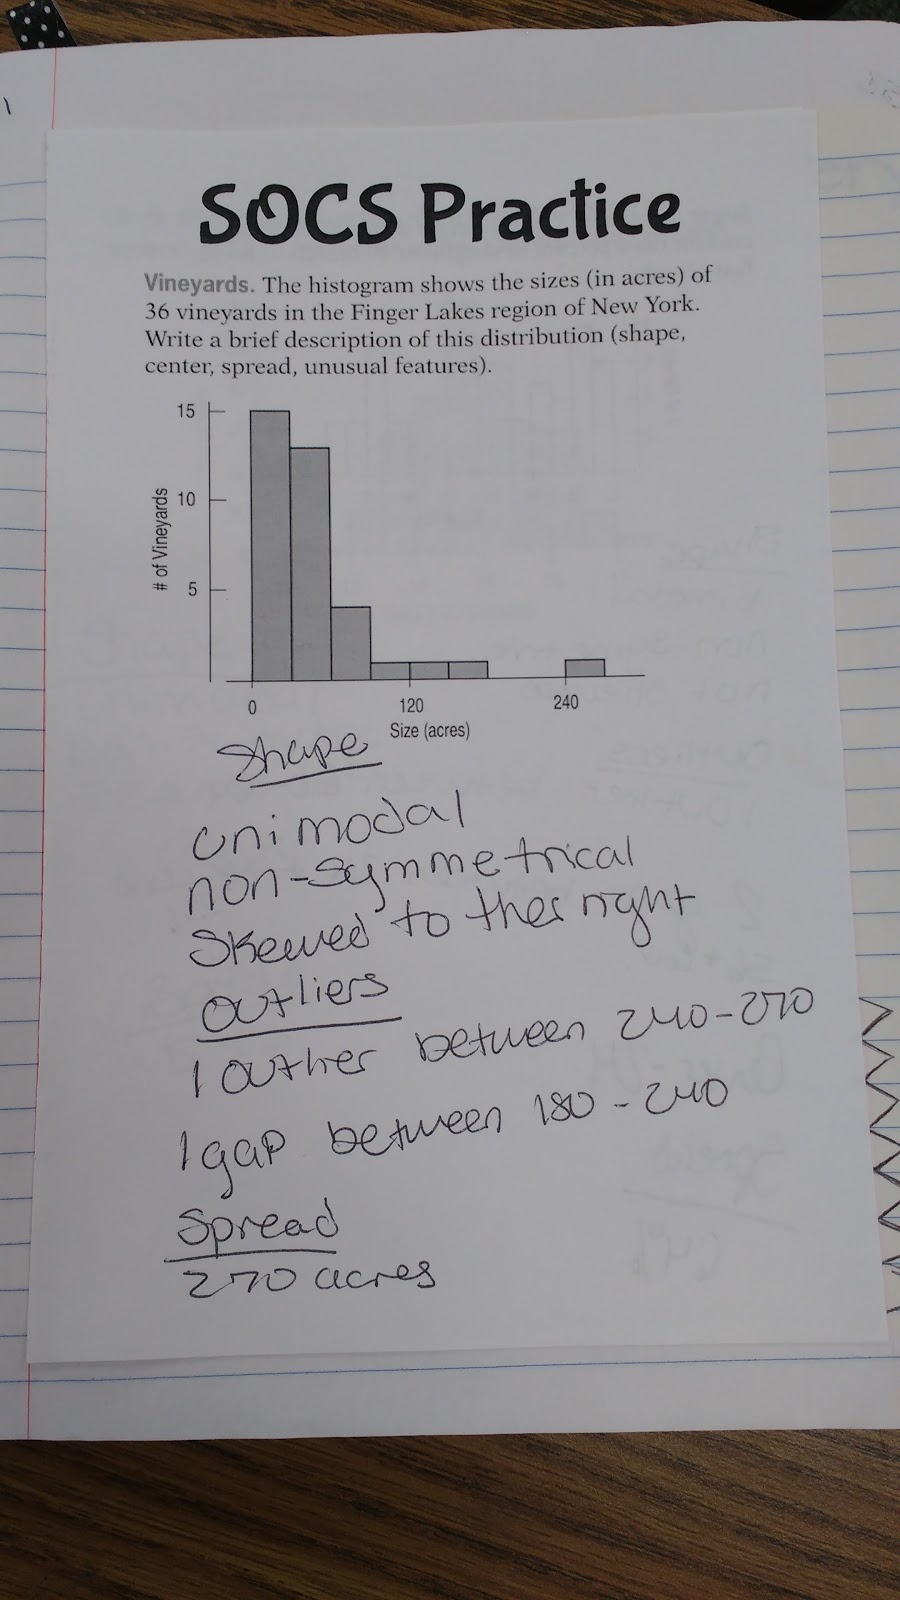
And, then we did even more SOCS practice!
Unit 4!
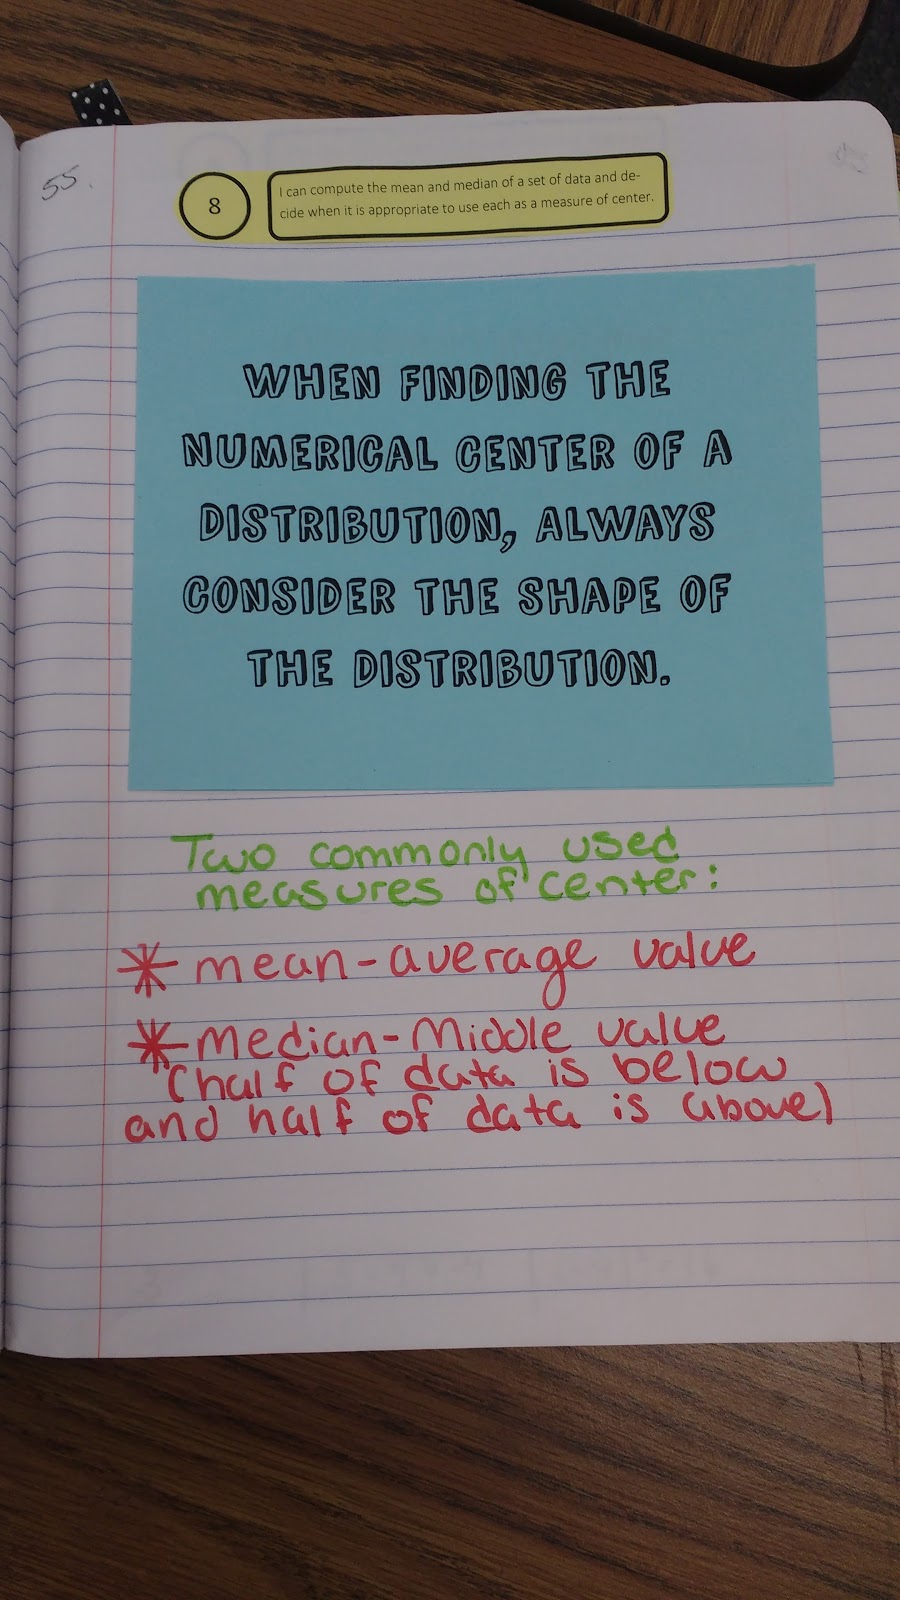
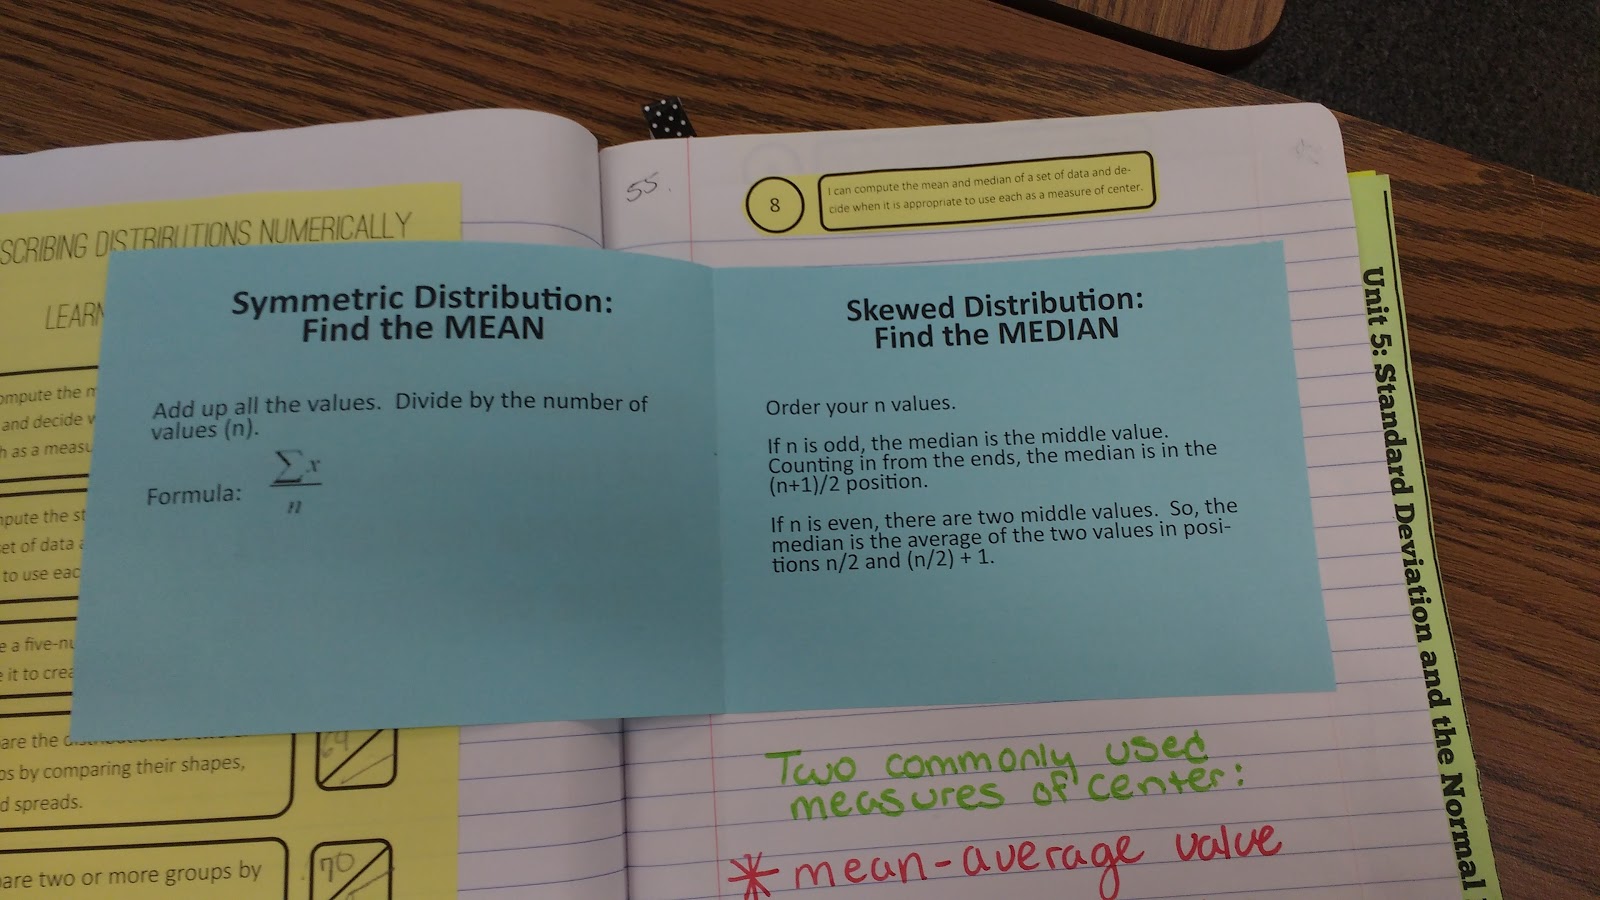
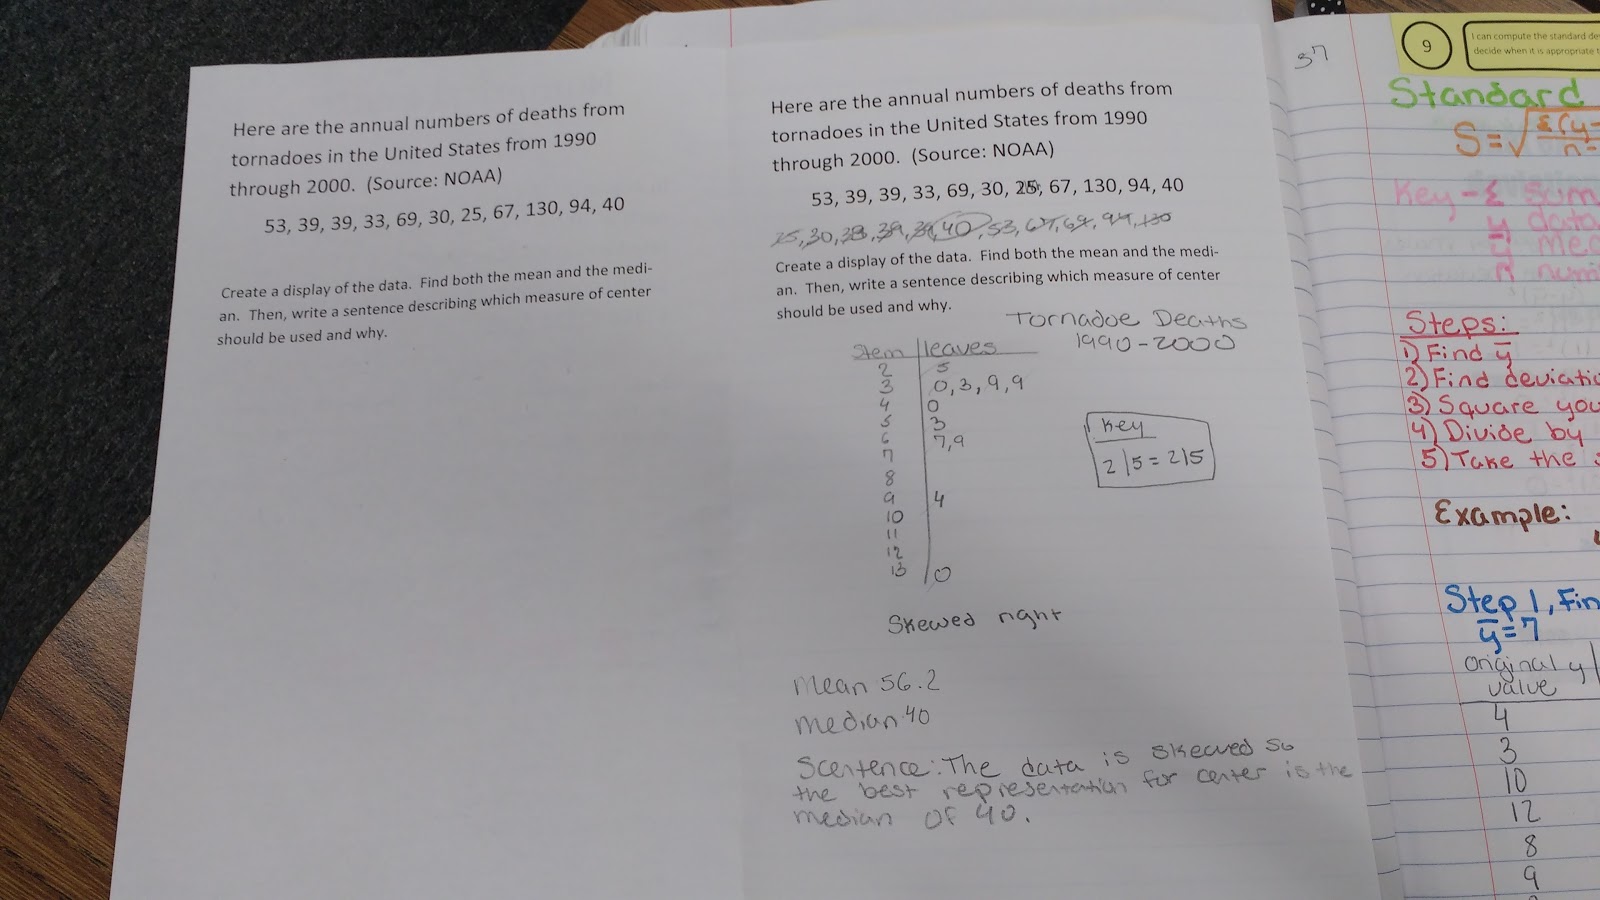
Numerical Center Practice:
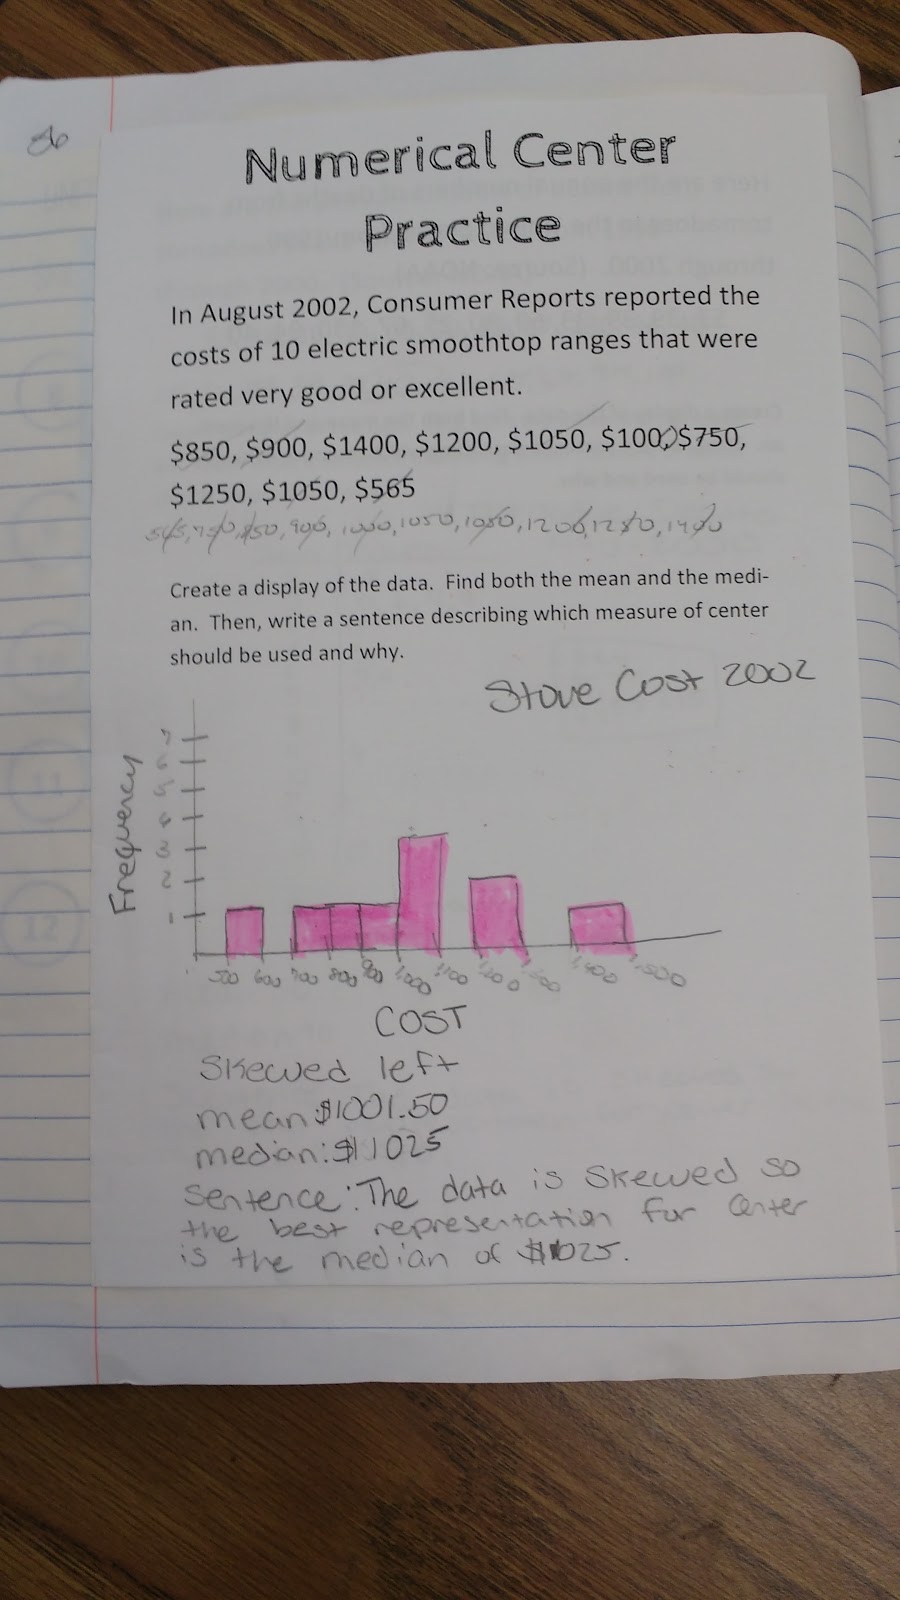
Silly me accidentally put the same problem twice inside this foldable. Another oops moment!
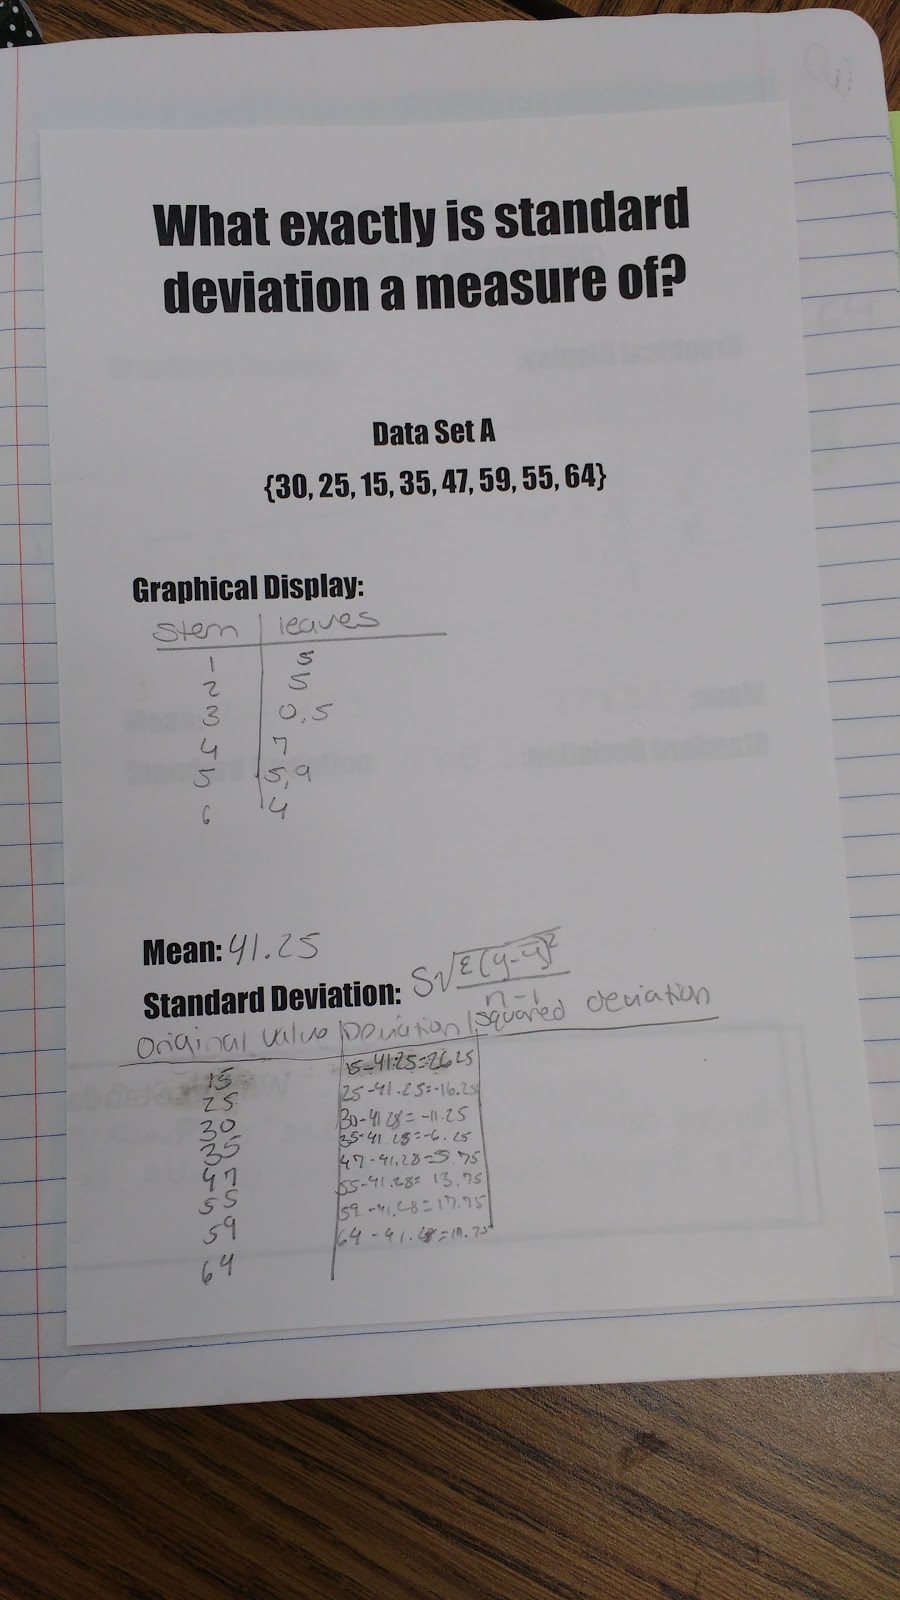
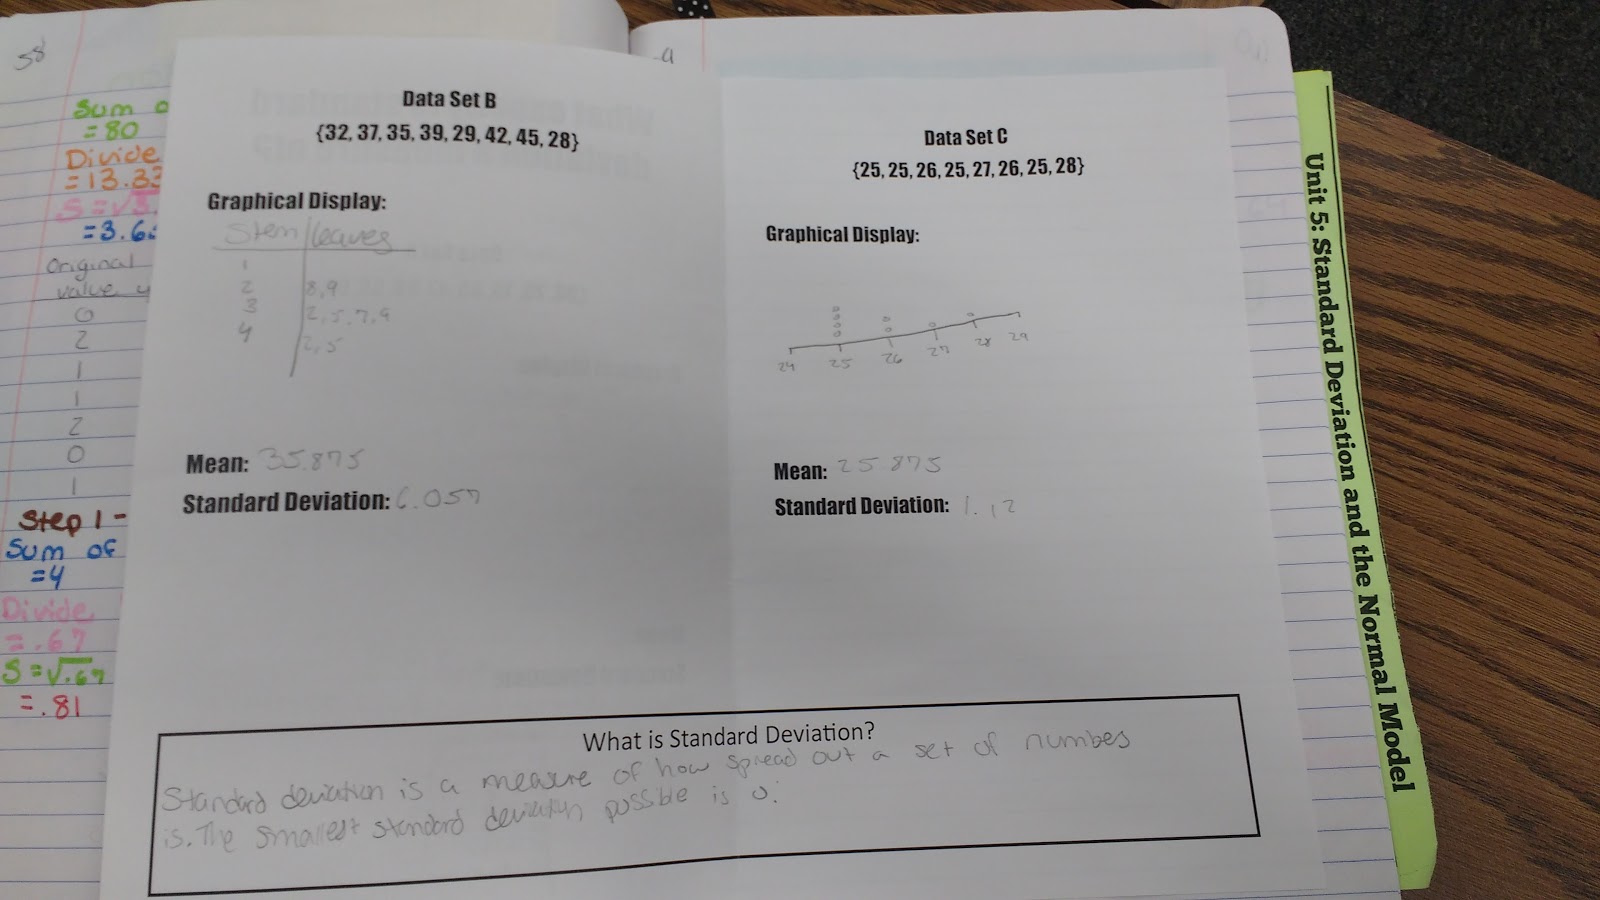
I made them go through the process of finding standard deviation by hand before showing them how to do it on their calculators.
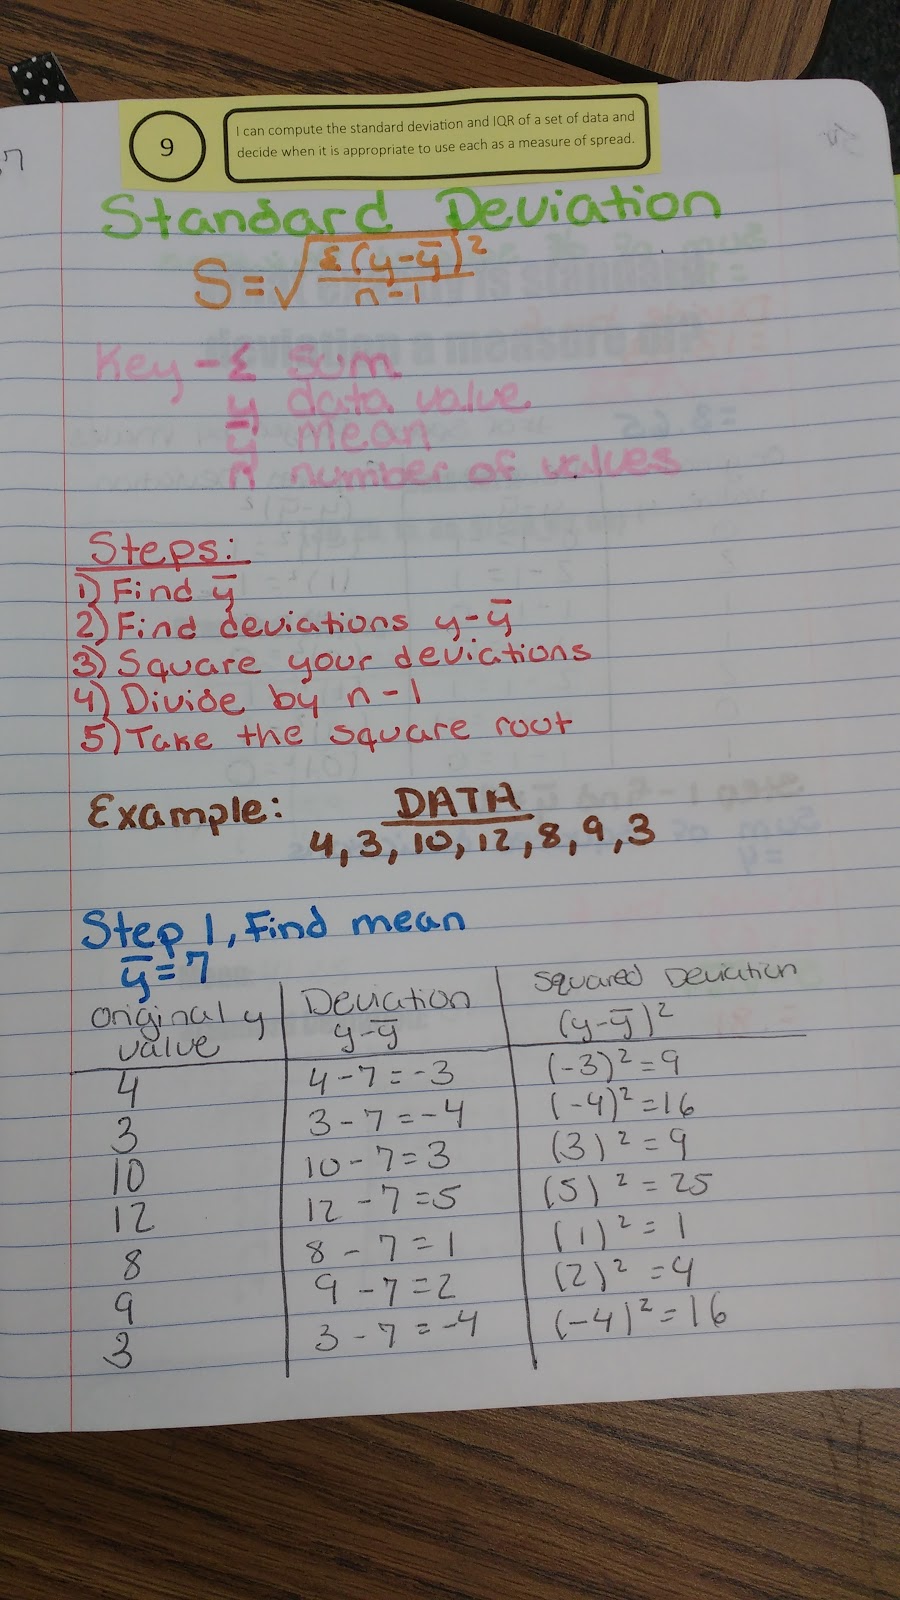
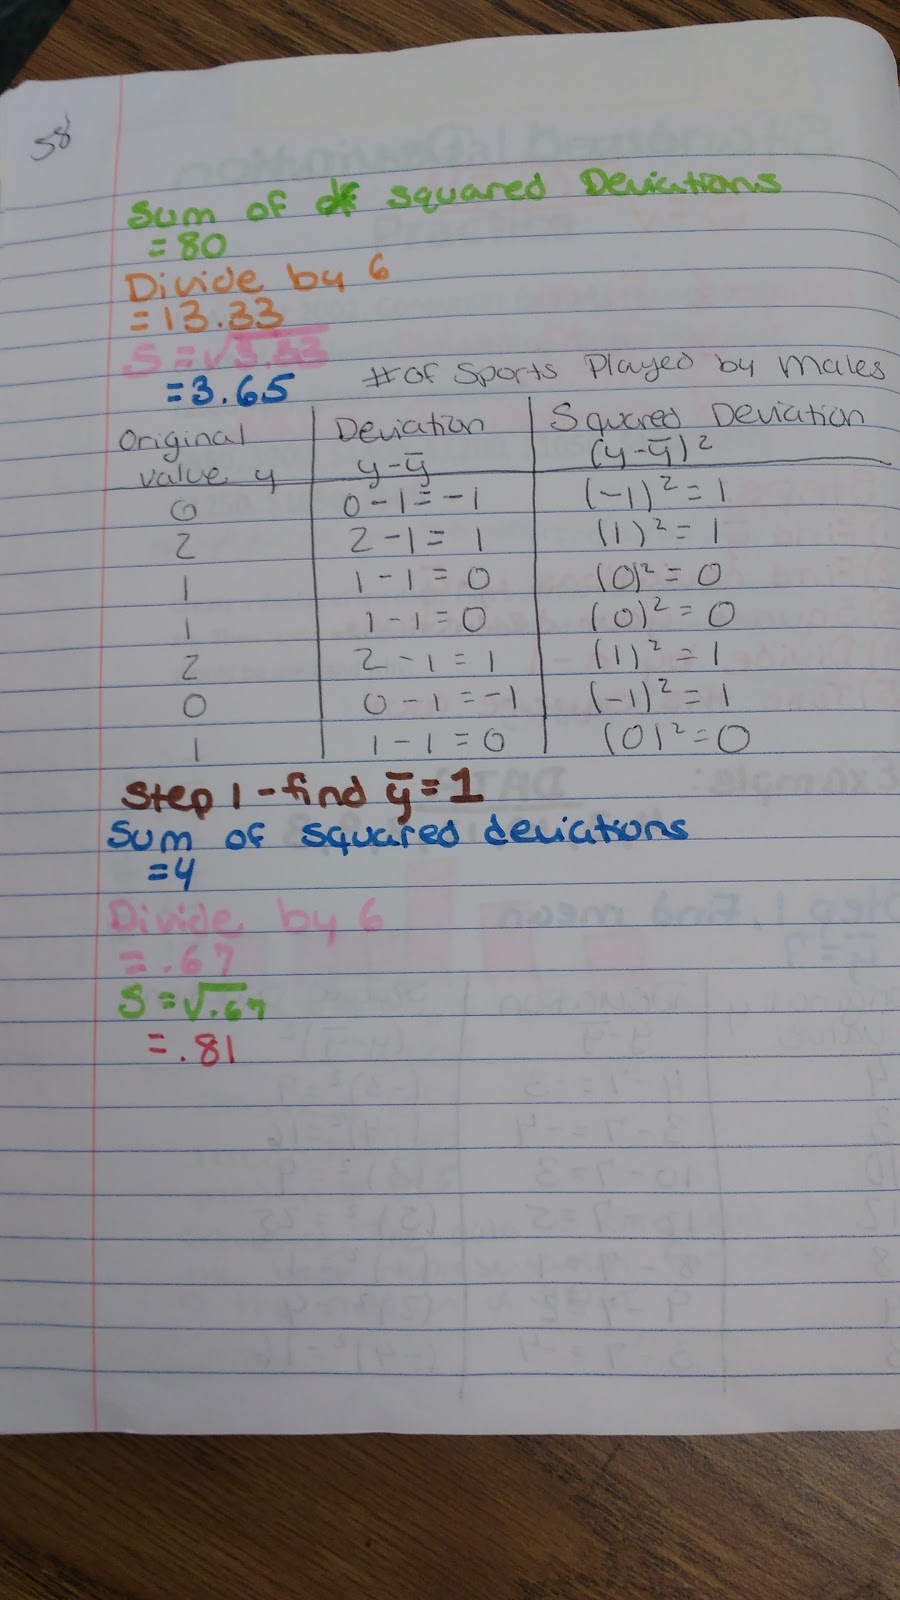
Standard Deviation Practice:
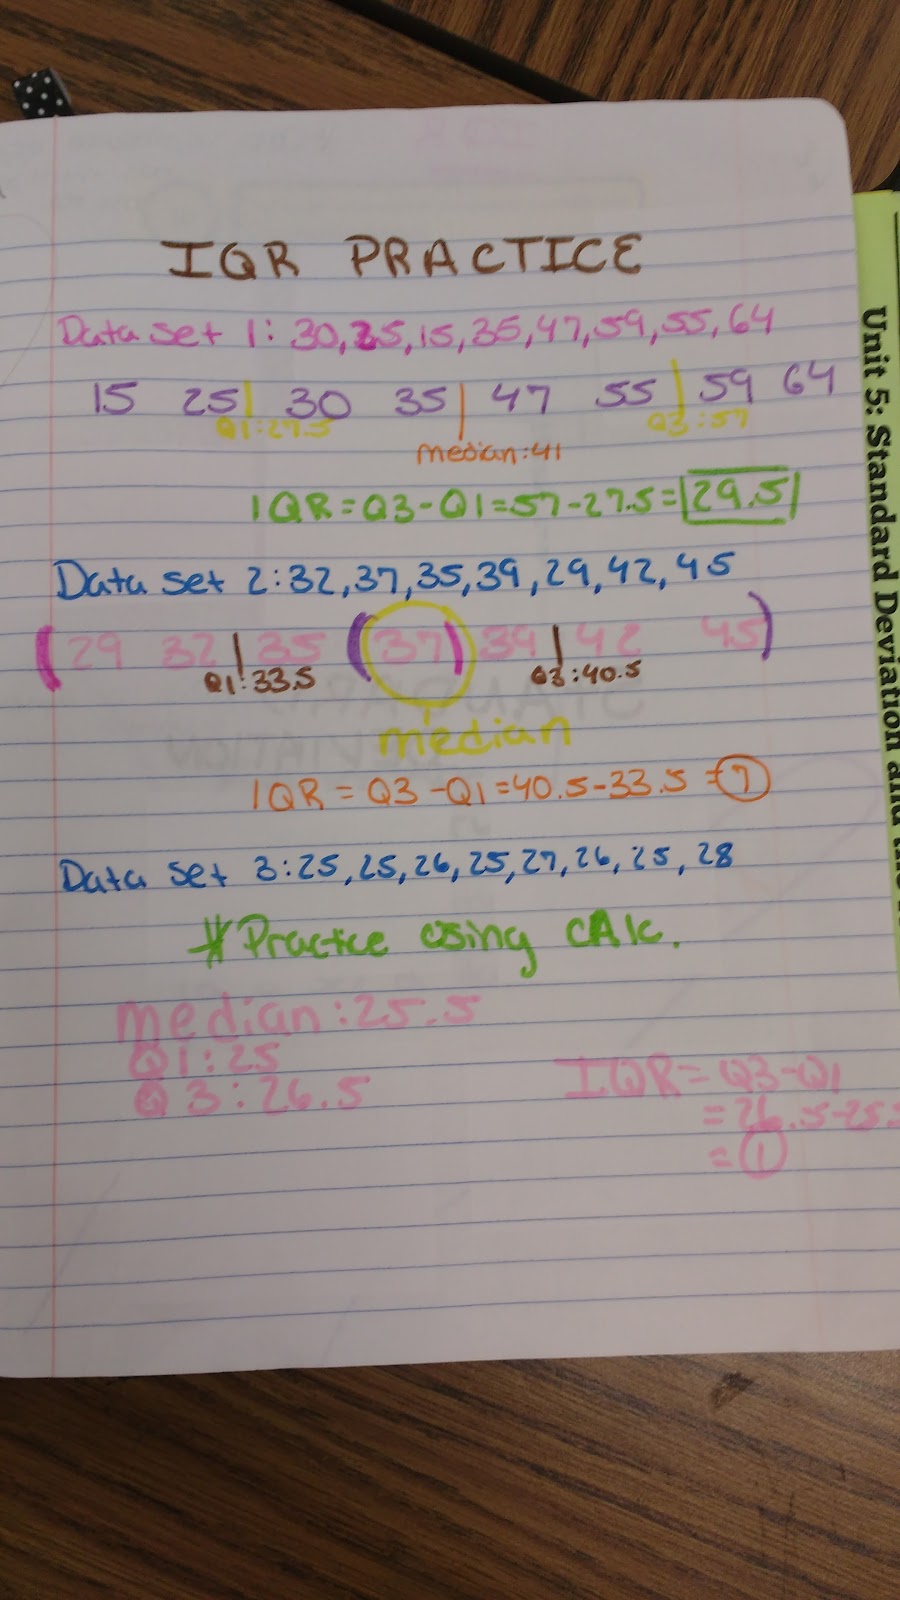
Interquartile Range Notes:
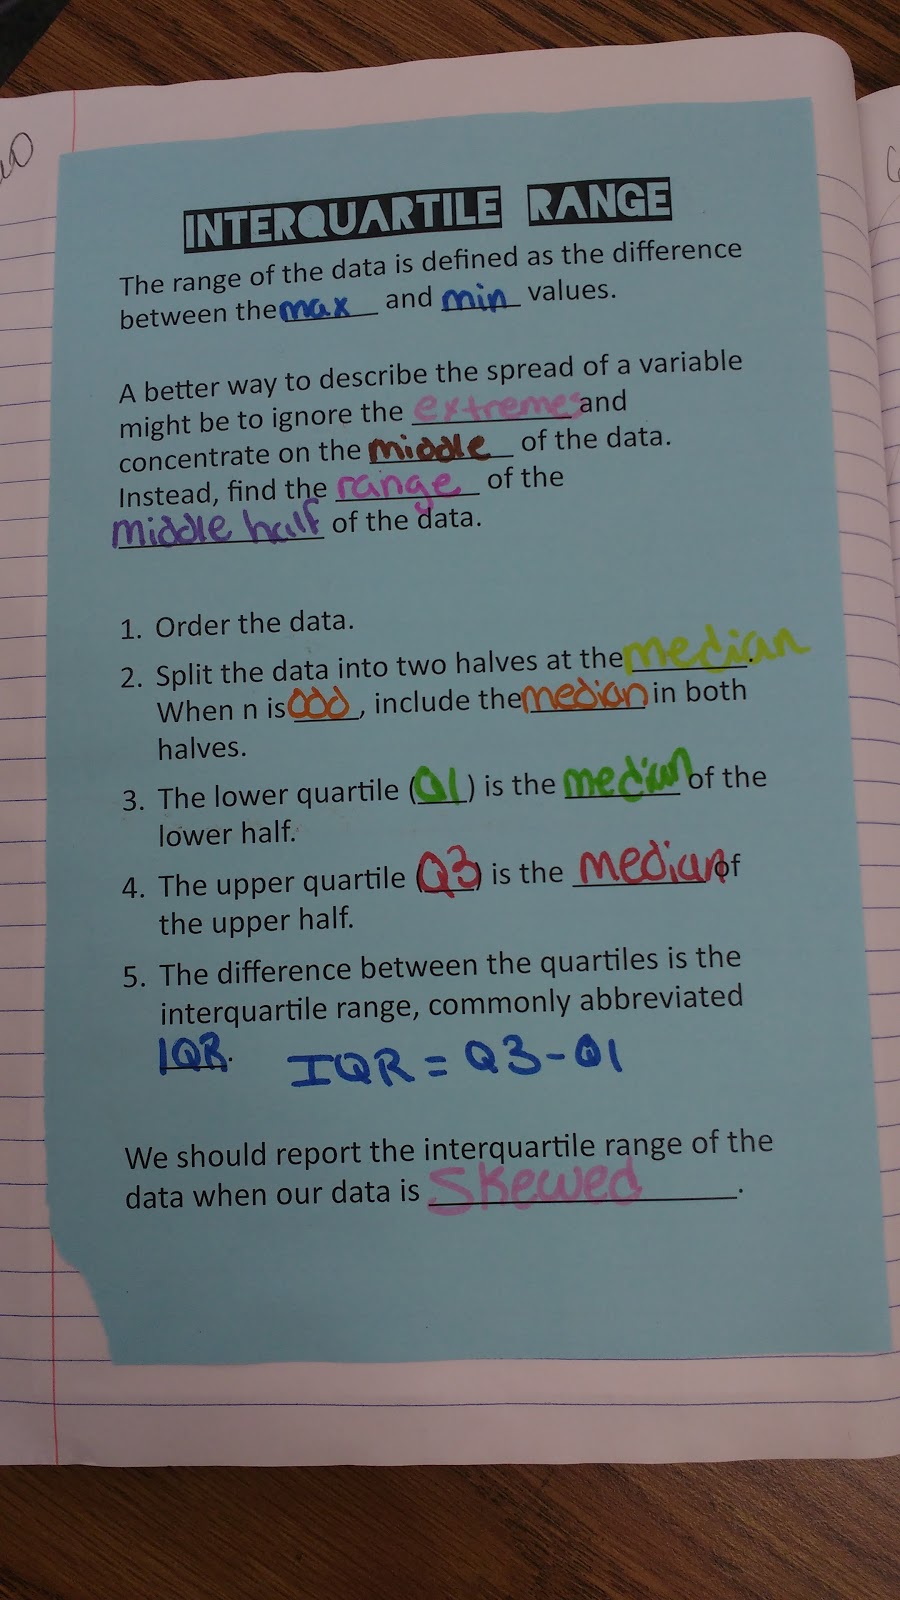
We did some basic IQR practice:
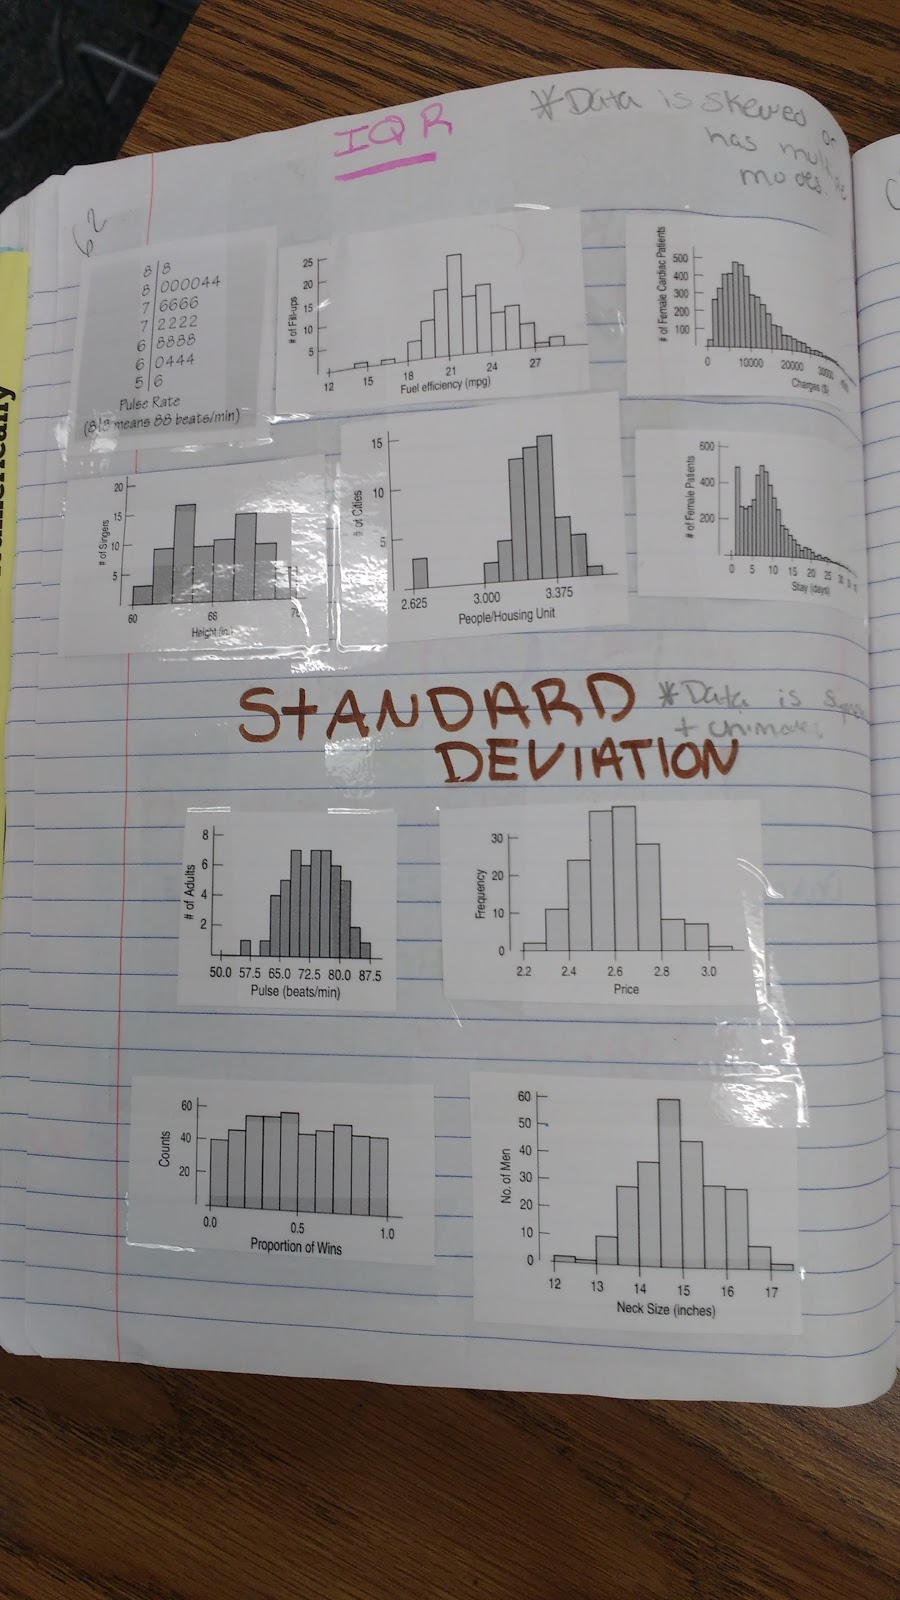
Then, we did an IQR vs. Standard Deviation Card Sort. I blogged about this card sort here.
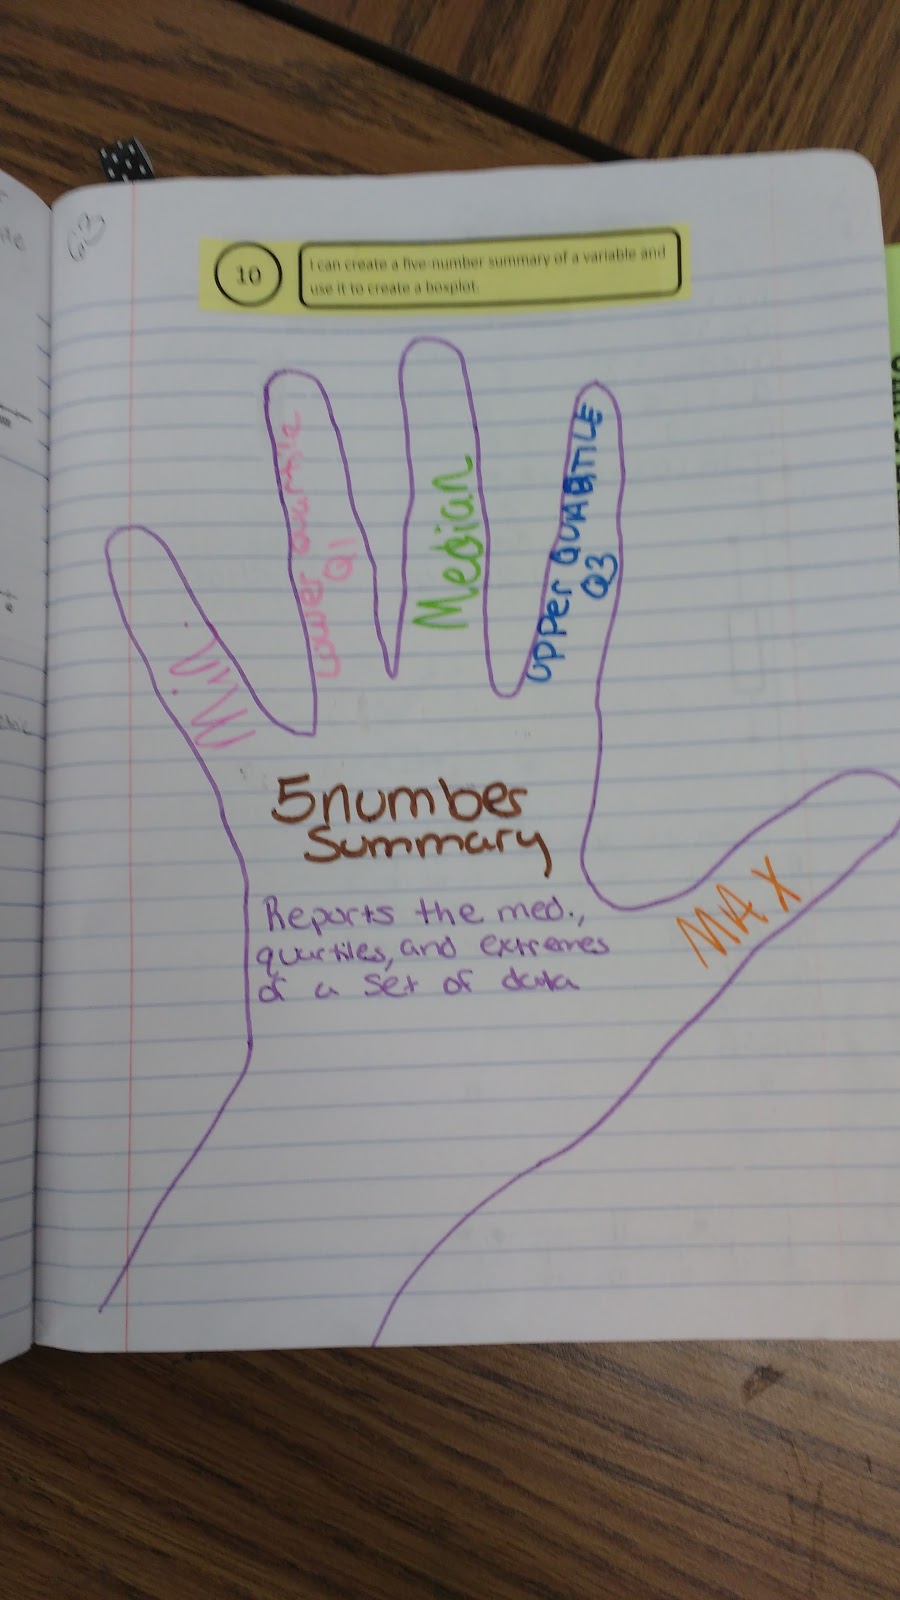
We traced our hands and wrote out the 5 facts that should be reported in a 5 number summary. I blogged about this lesson here.
Remember that class survey data? We used it to make our own five number summaries!
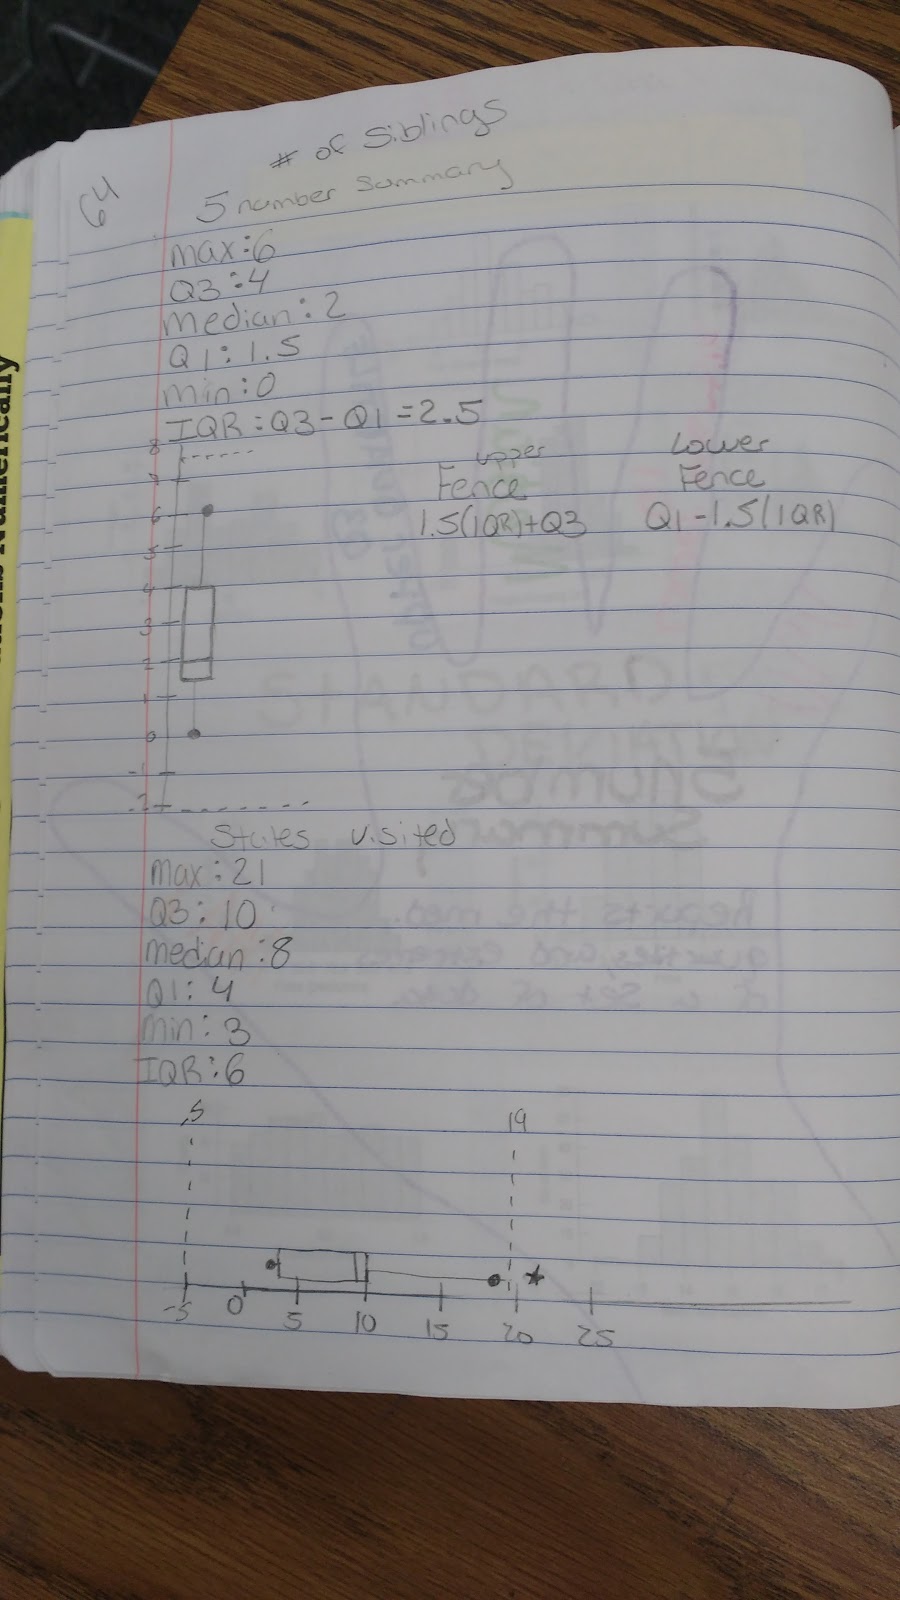
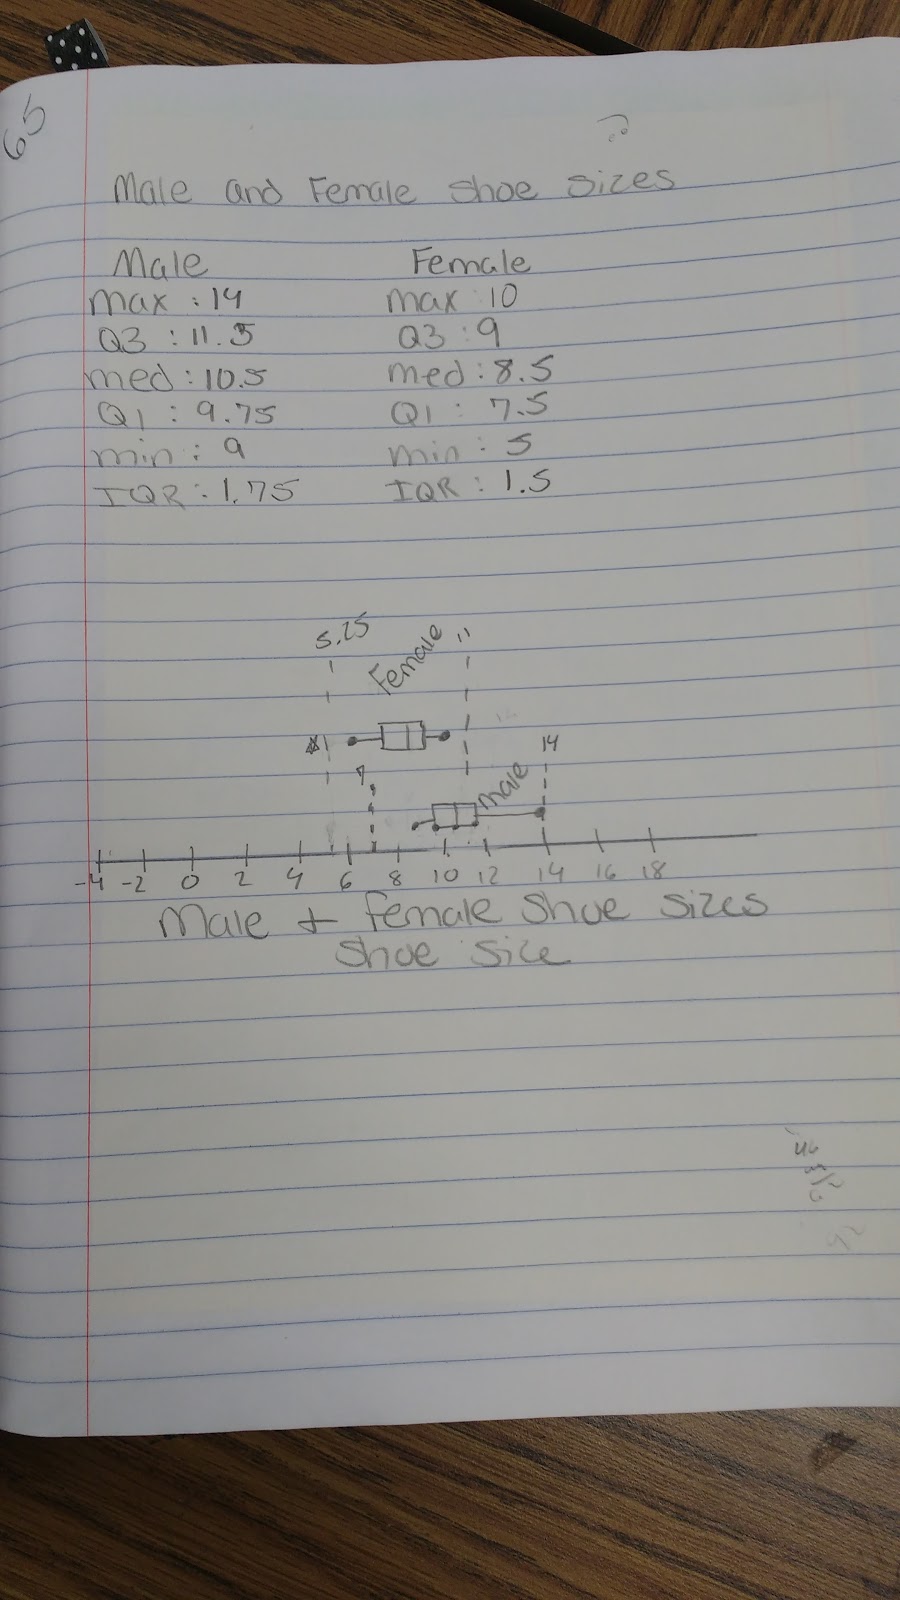
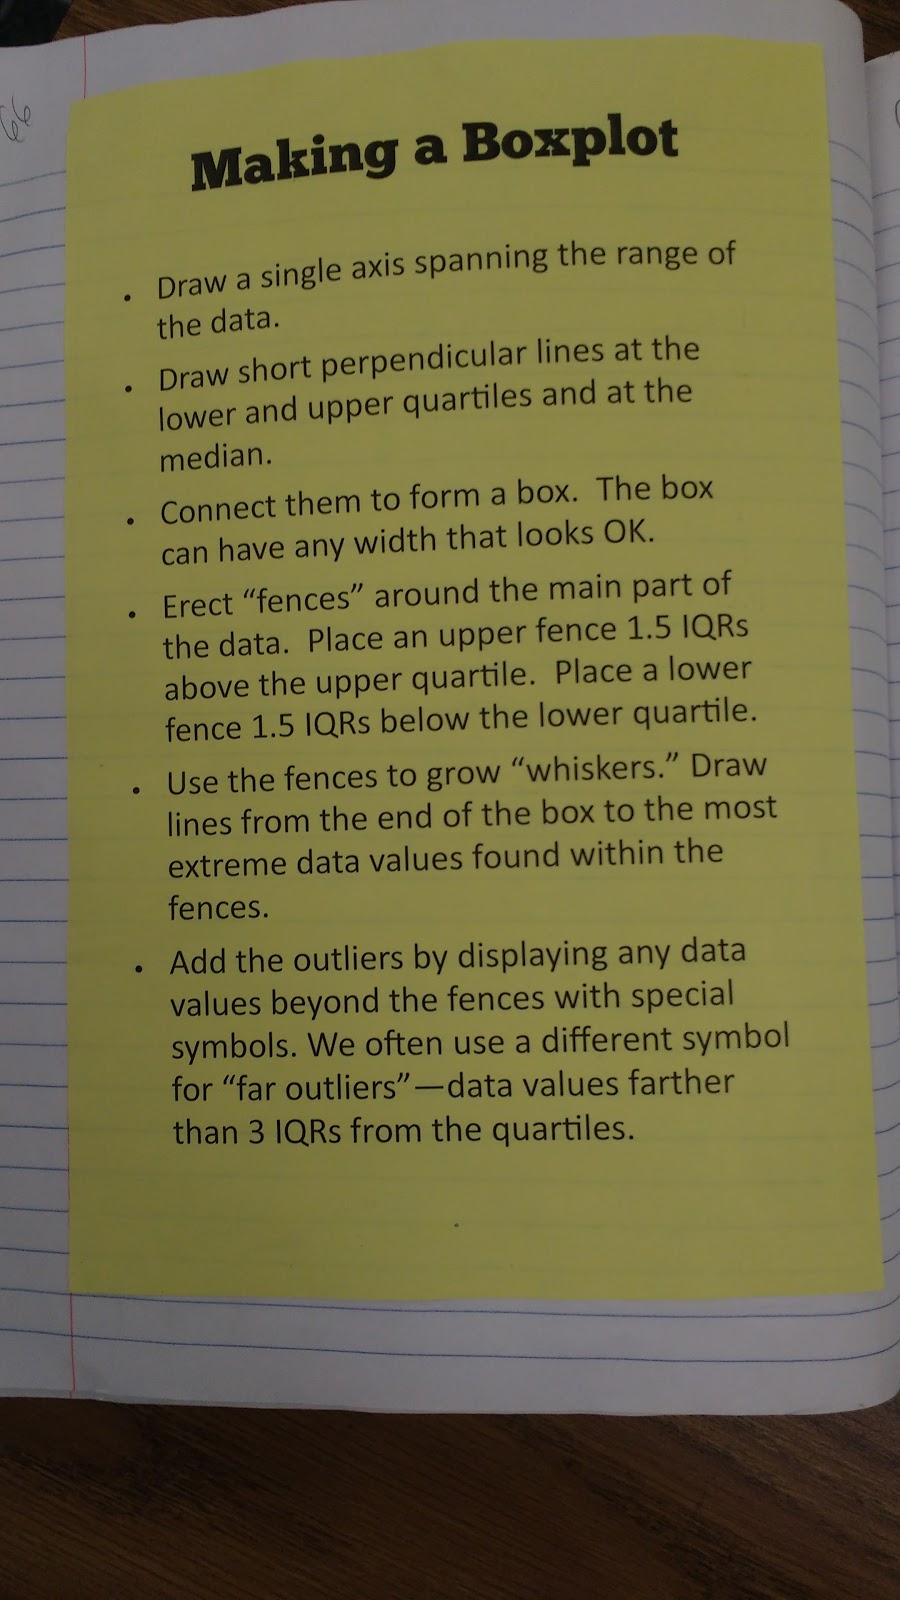
Notes on Making a Boxplot
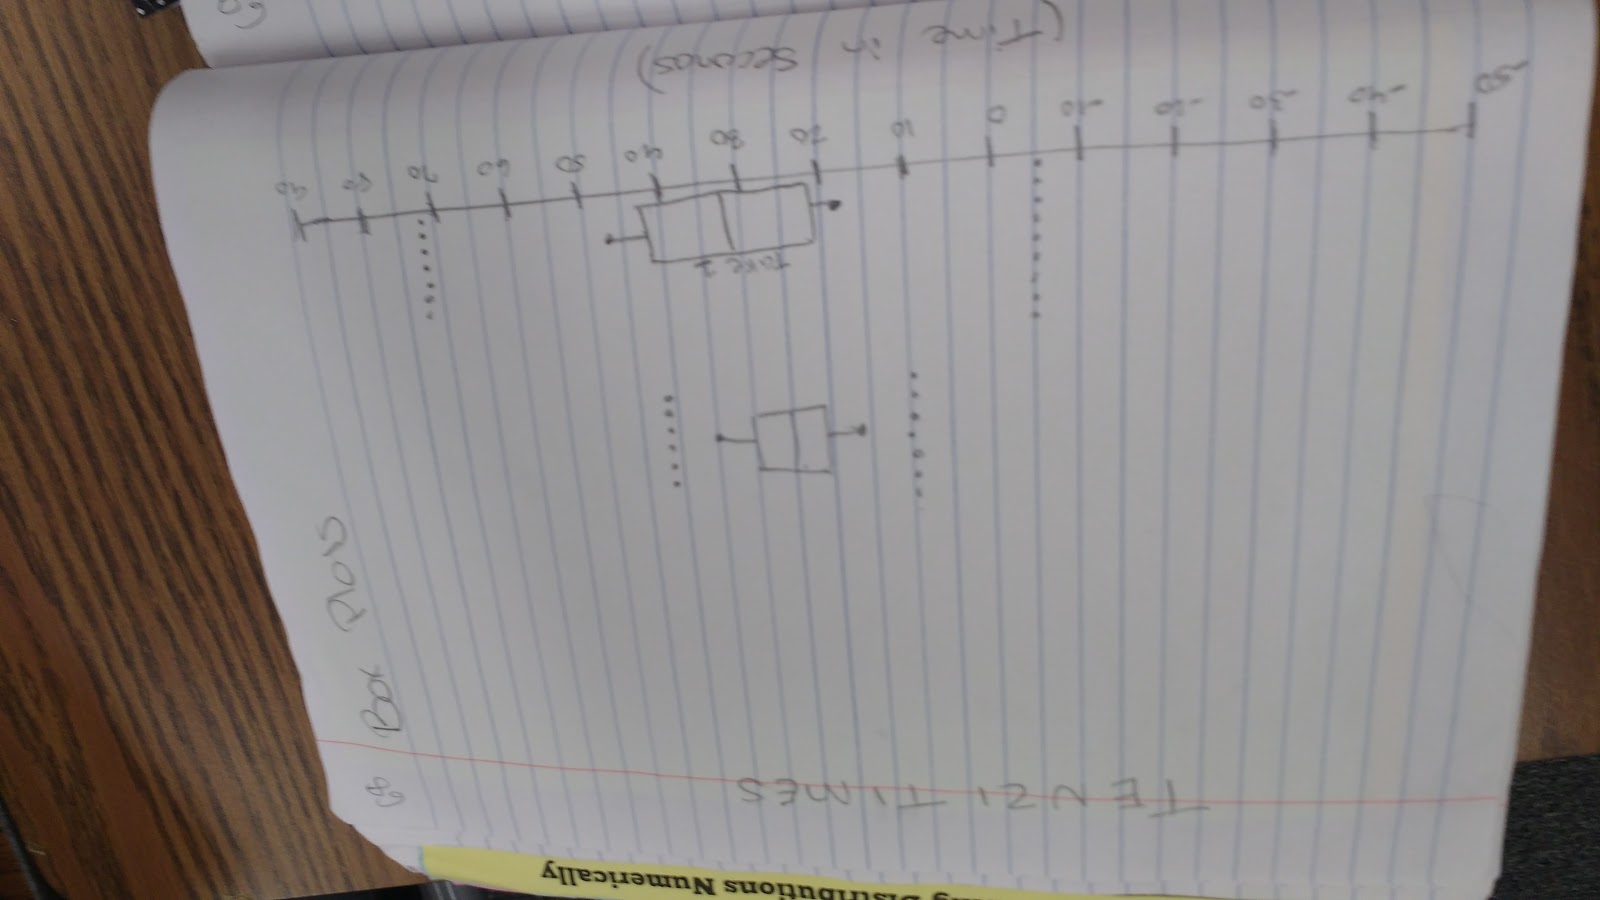
We collected some data playing Tenzi and used that to practice making boxplots.

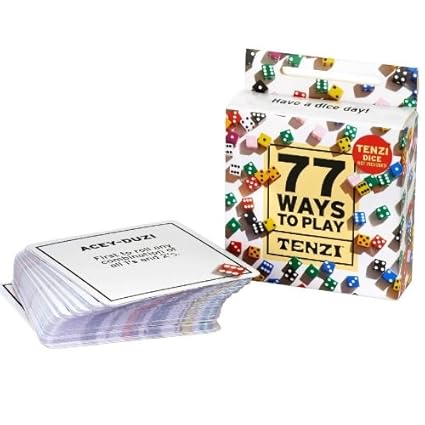
In the end, we just ended up playing using the normal rules TWICE. So, we compared our Tenzi results as an inexperienced player and an experienced player!
What are the numbers in the 8 boxes? They are the number of seconds it took my students to finish a round of Tenzi. If I were to do this again (and I definitely would!), I would have my students maybe count the number of rolls it took them to reach Tenzi.
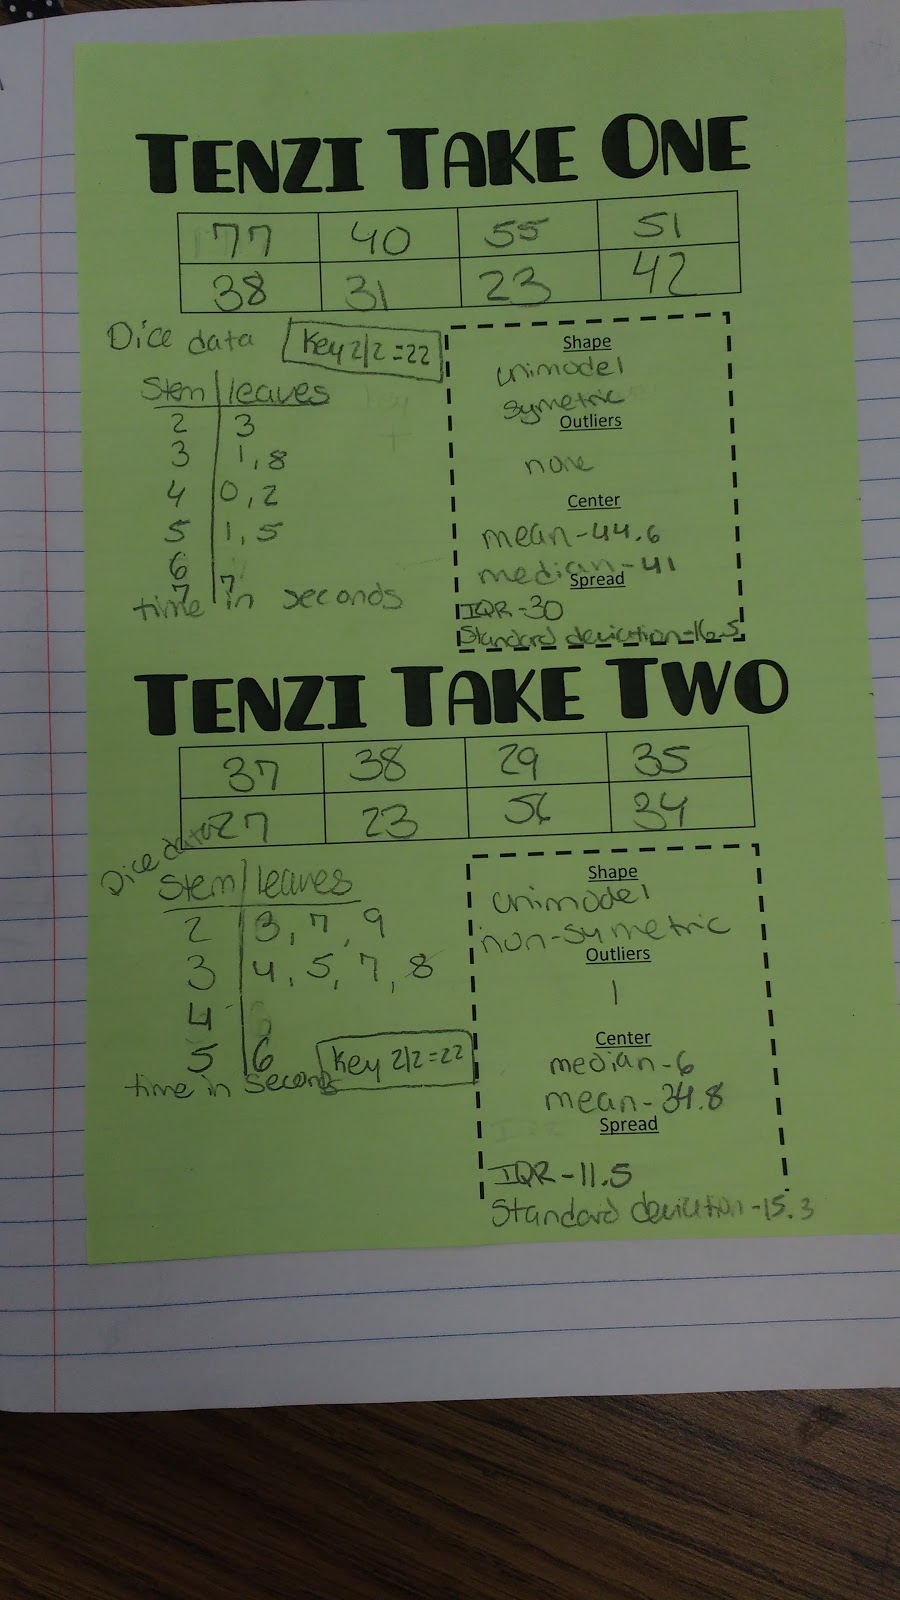
Tenzi Box Plots:
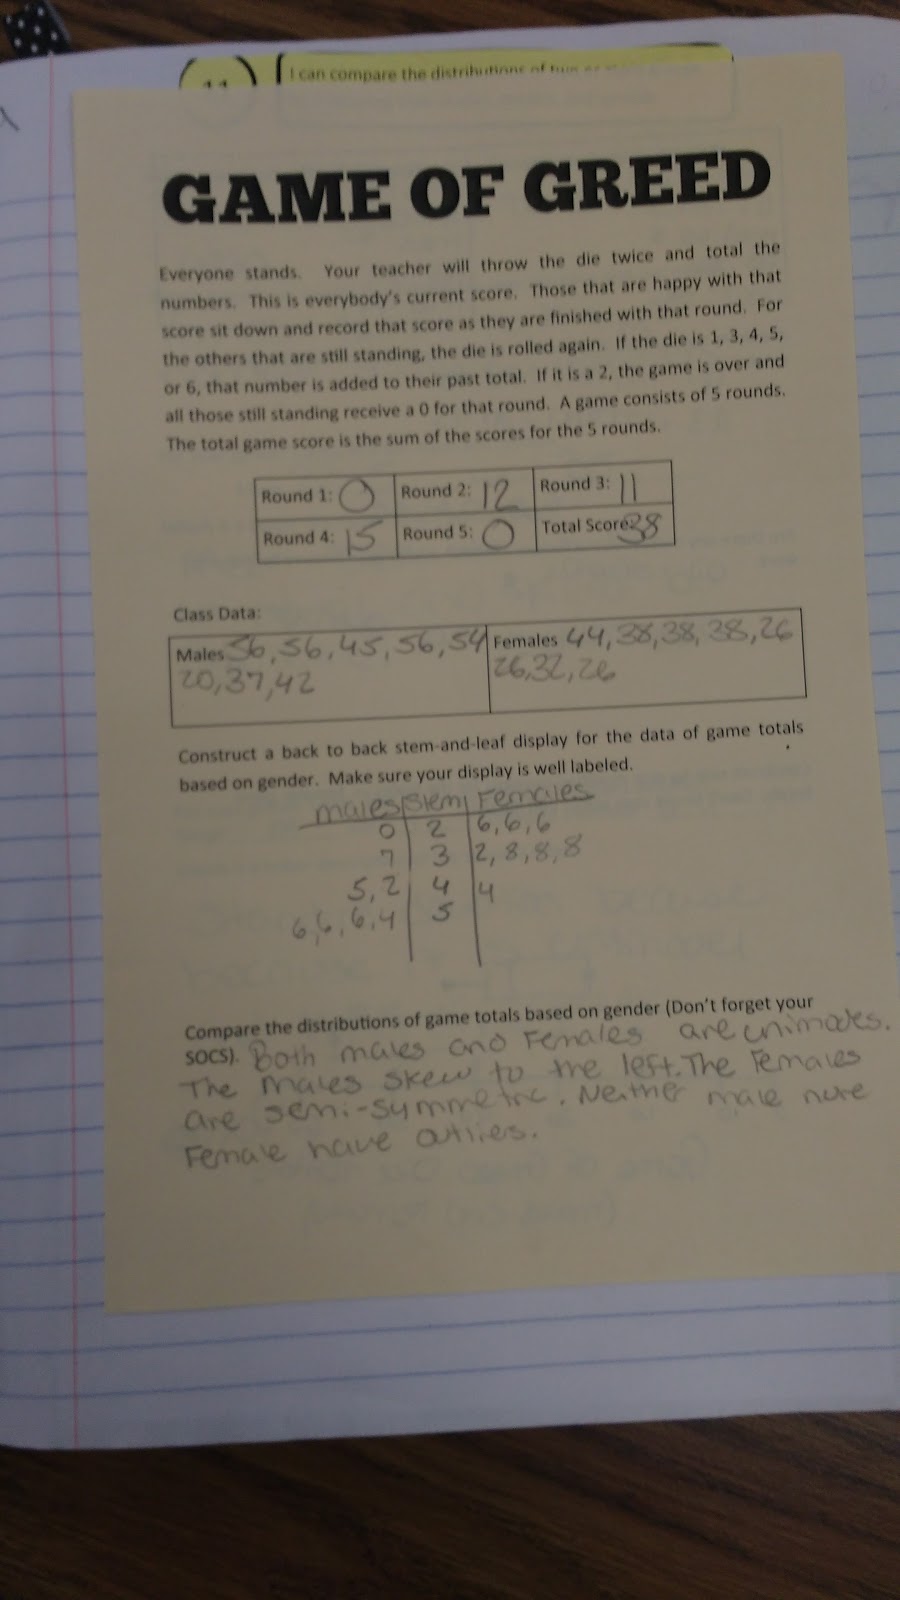
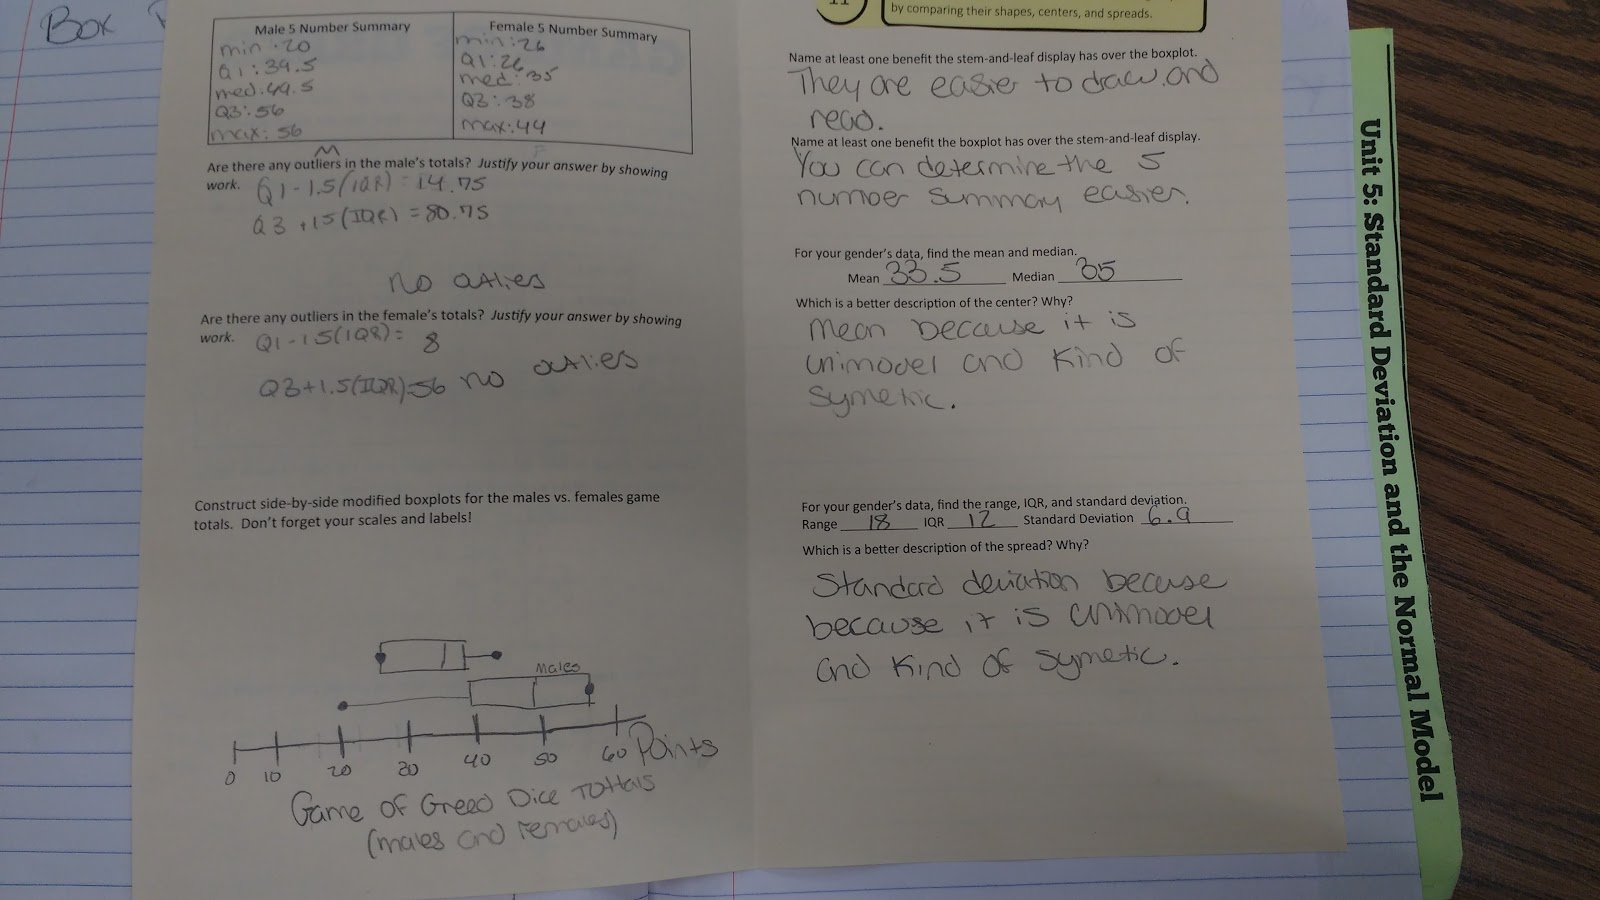
We followed this up with another game, the Game of Greed. I got game from @druinok, as well.
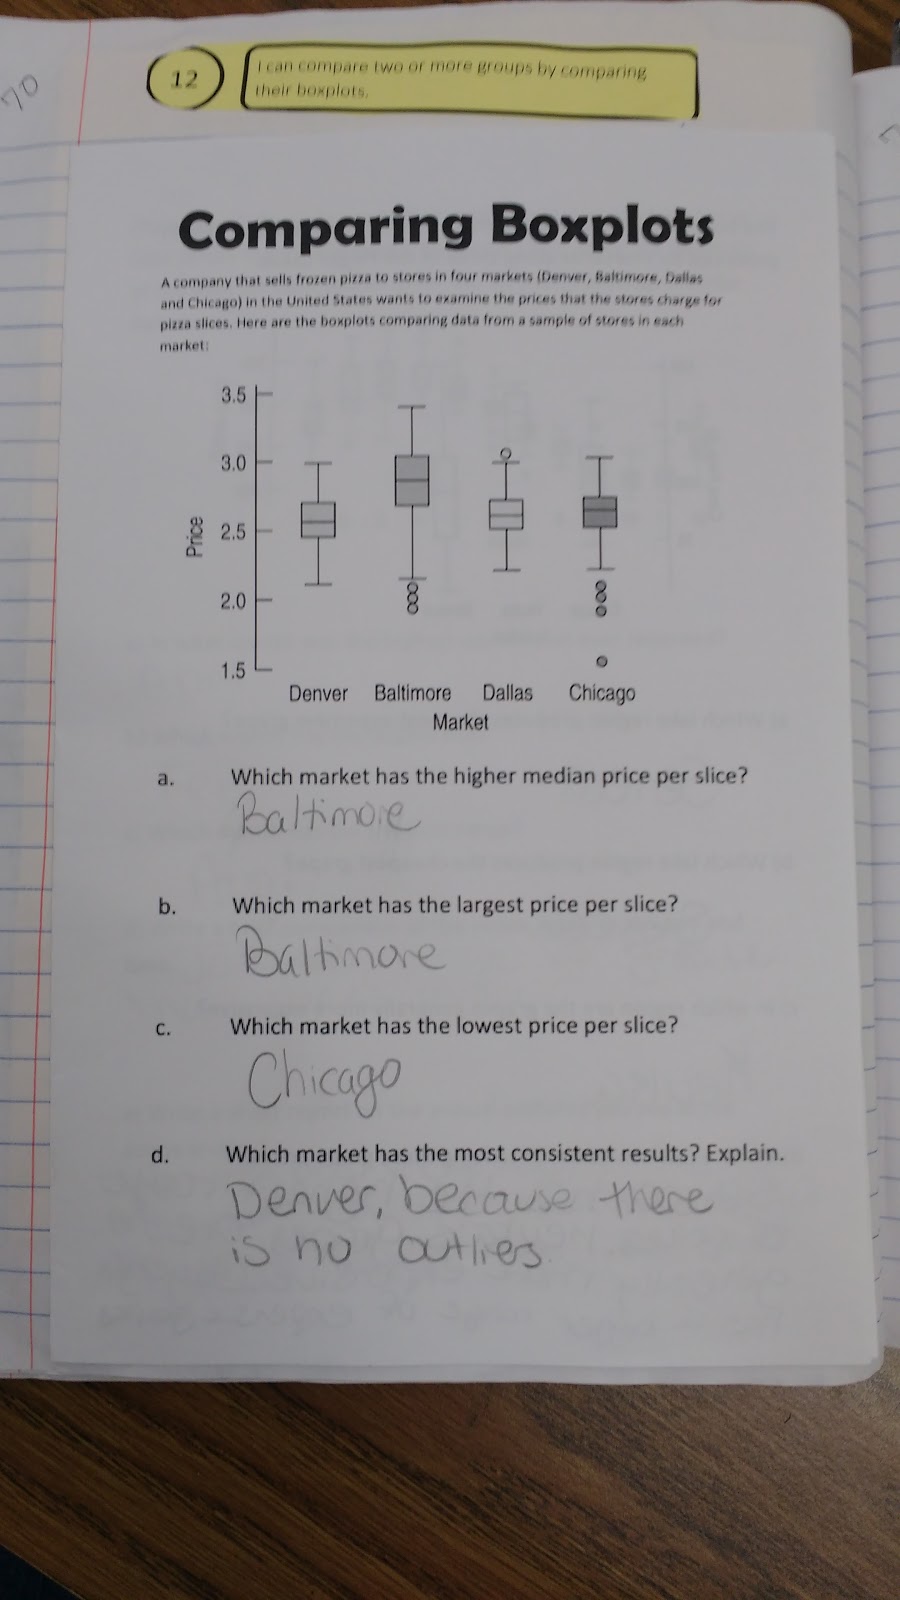
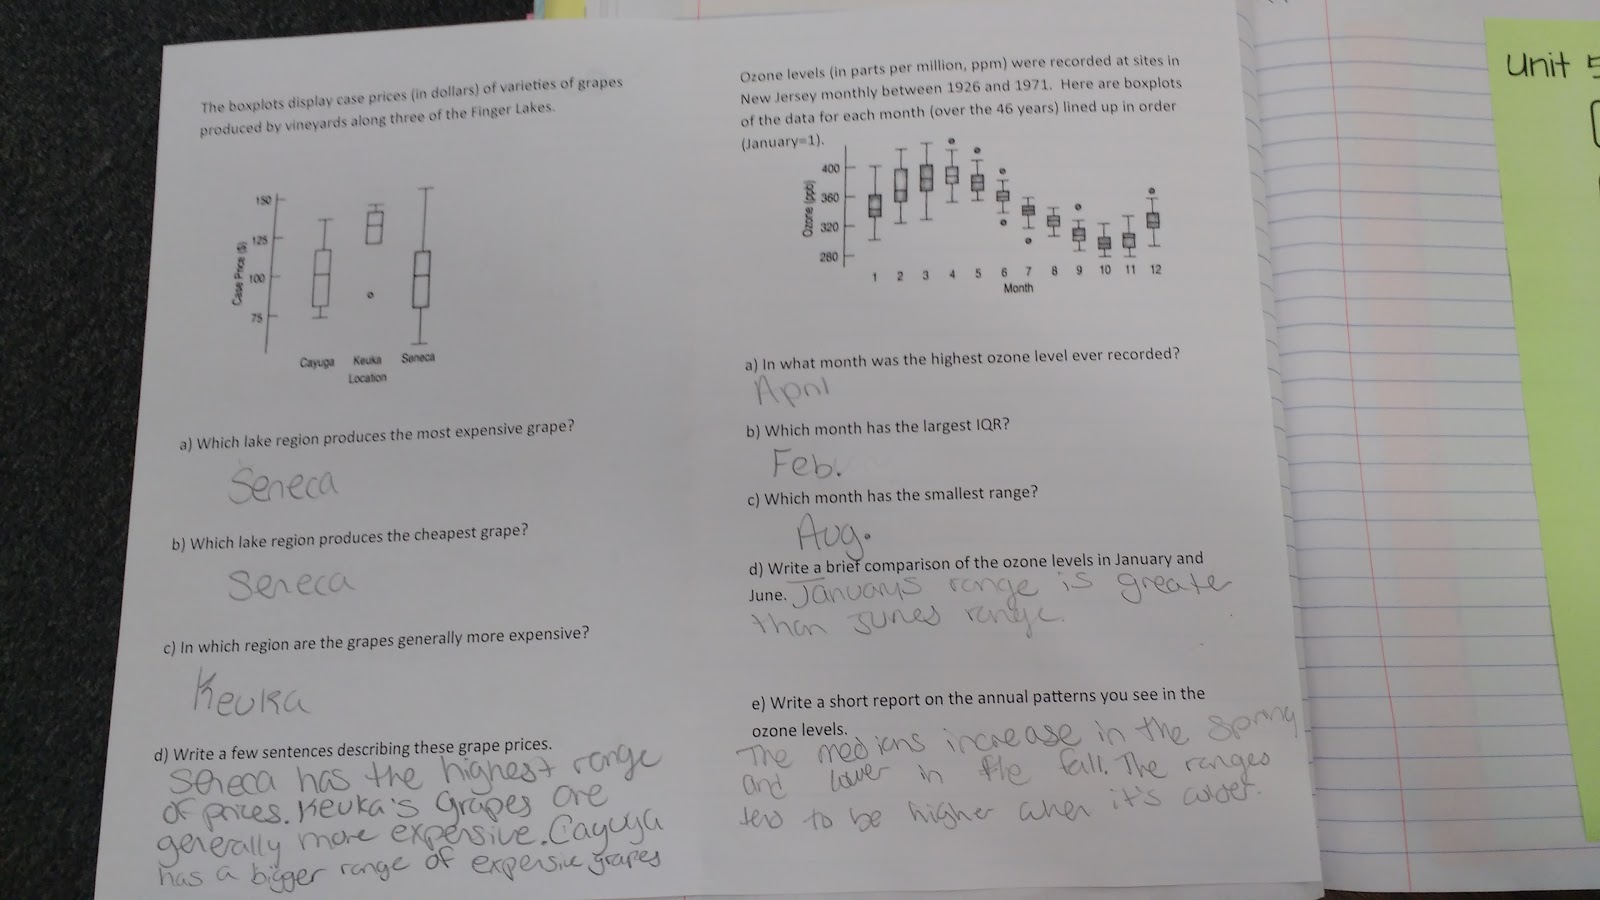
We did a bit of comparing boxplot practice.
Unit 5!
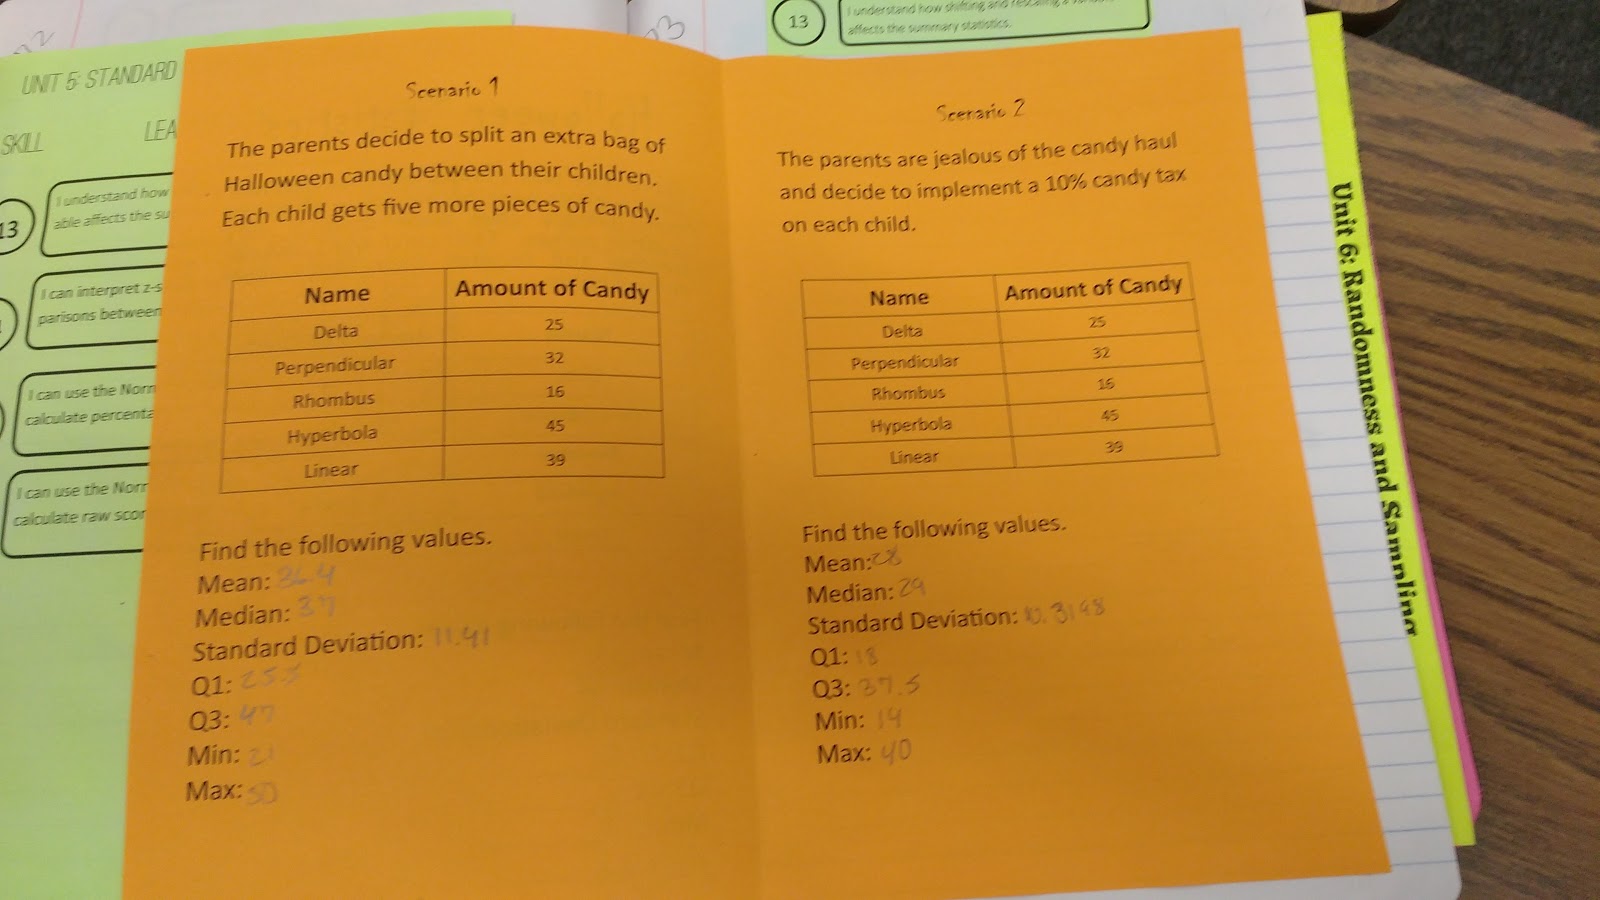
Next, we did a Halloween Statistics activity to examine how shifting and rescaling a variable affects the summary statistics.
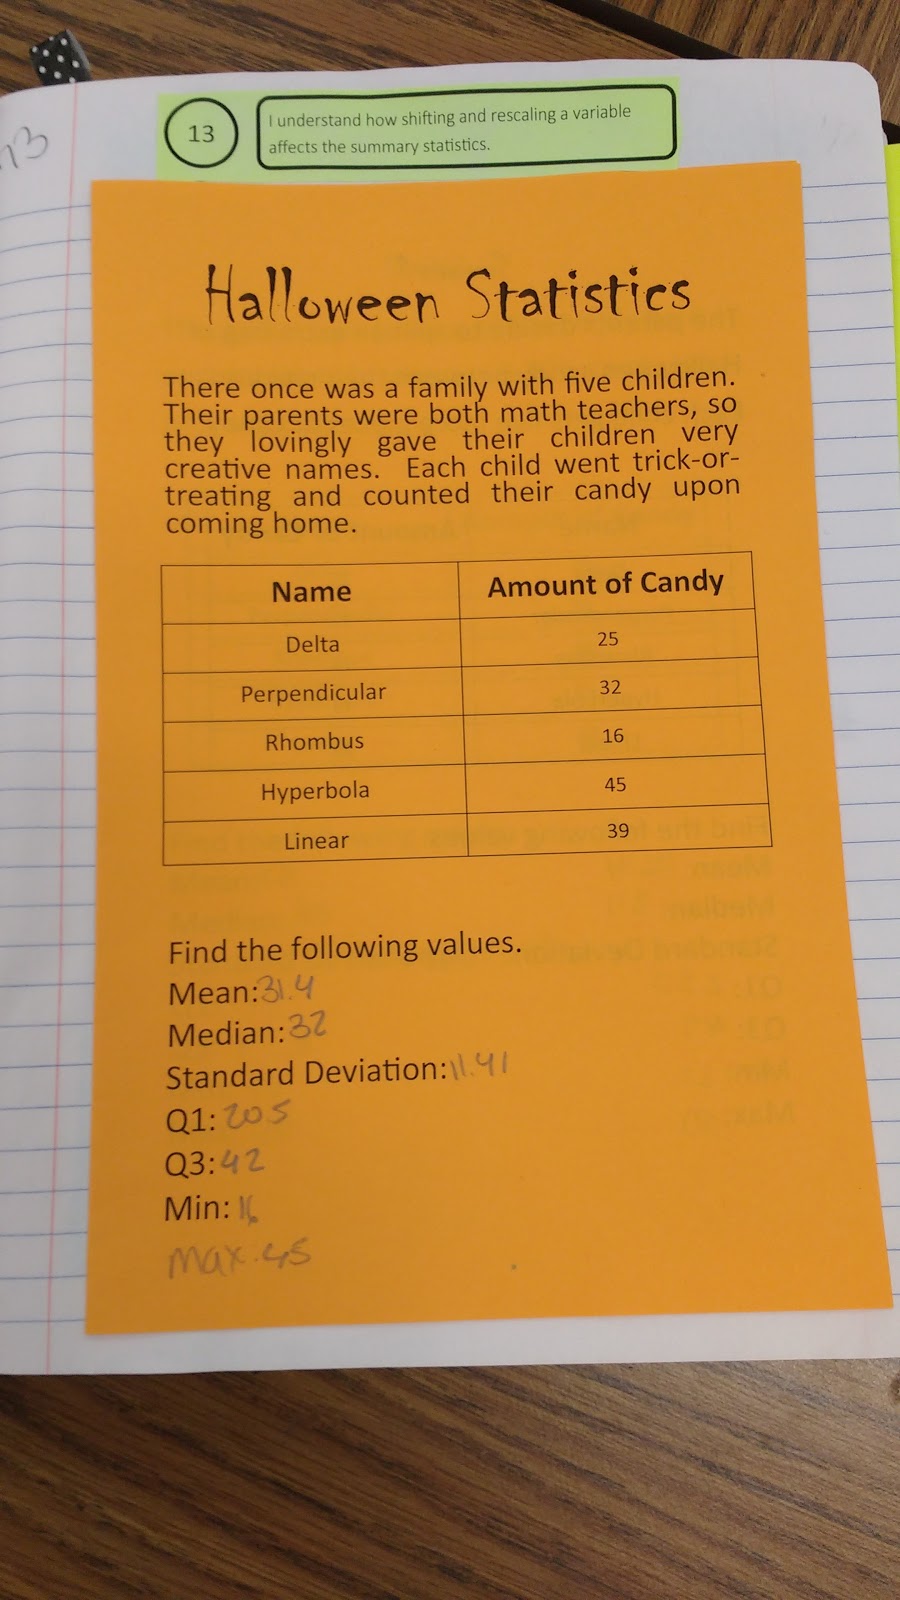
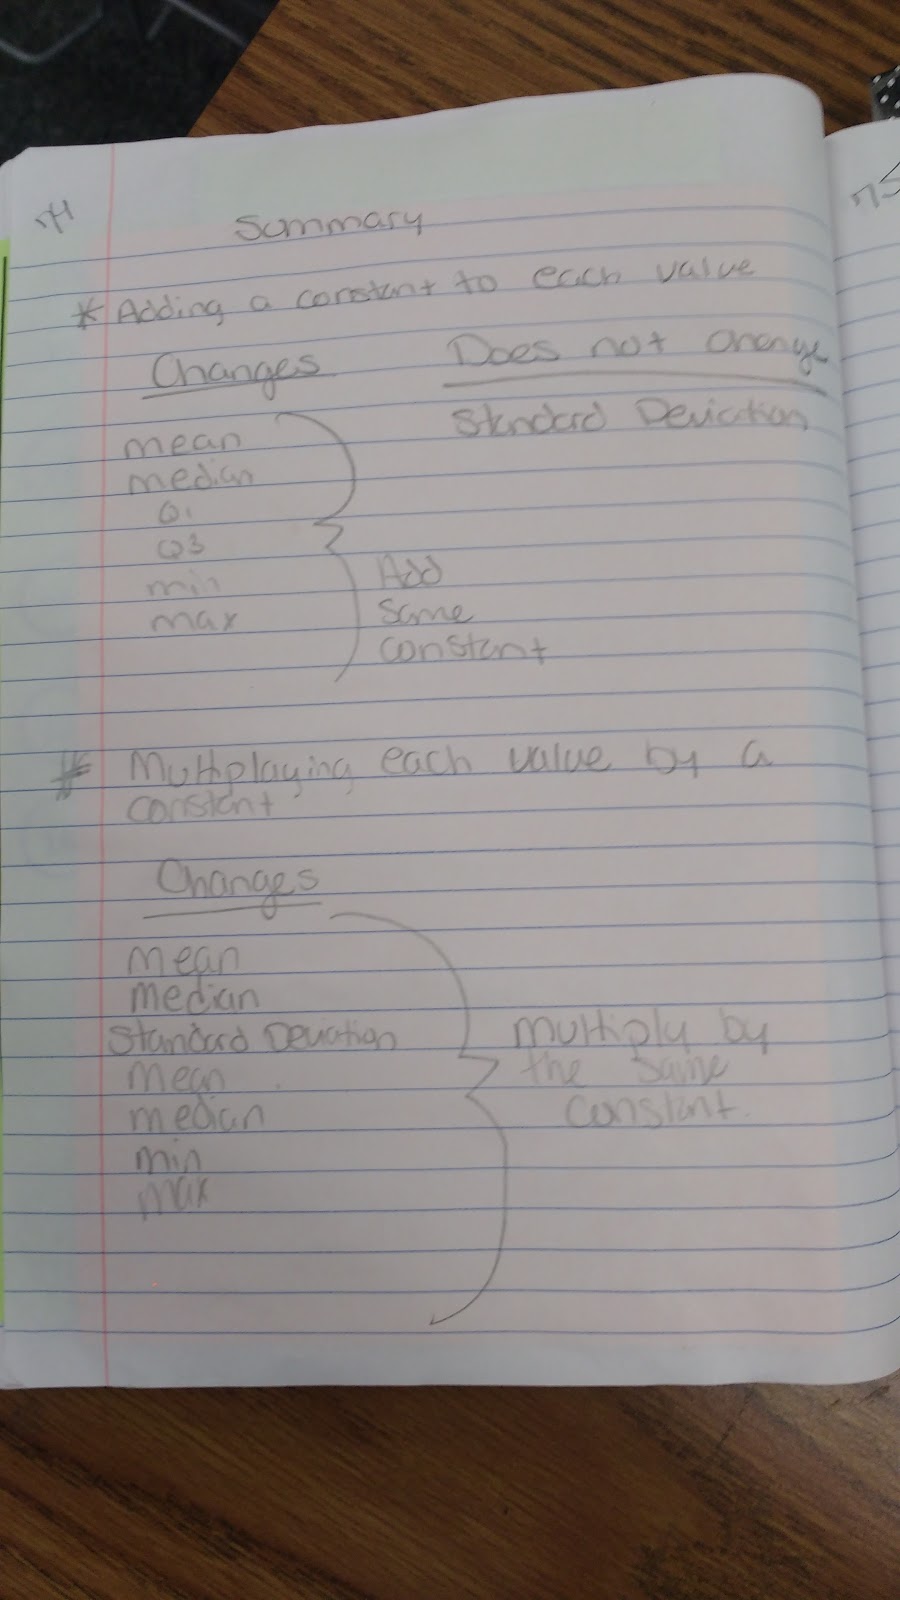
We wrote up some summary notes to describe what happened:
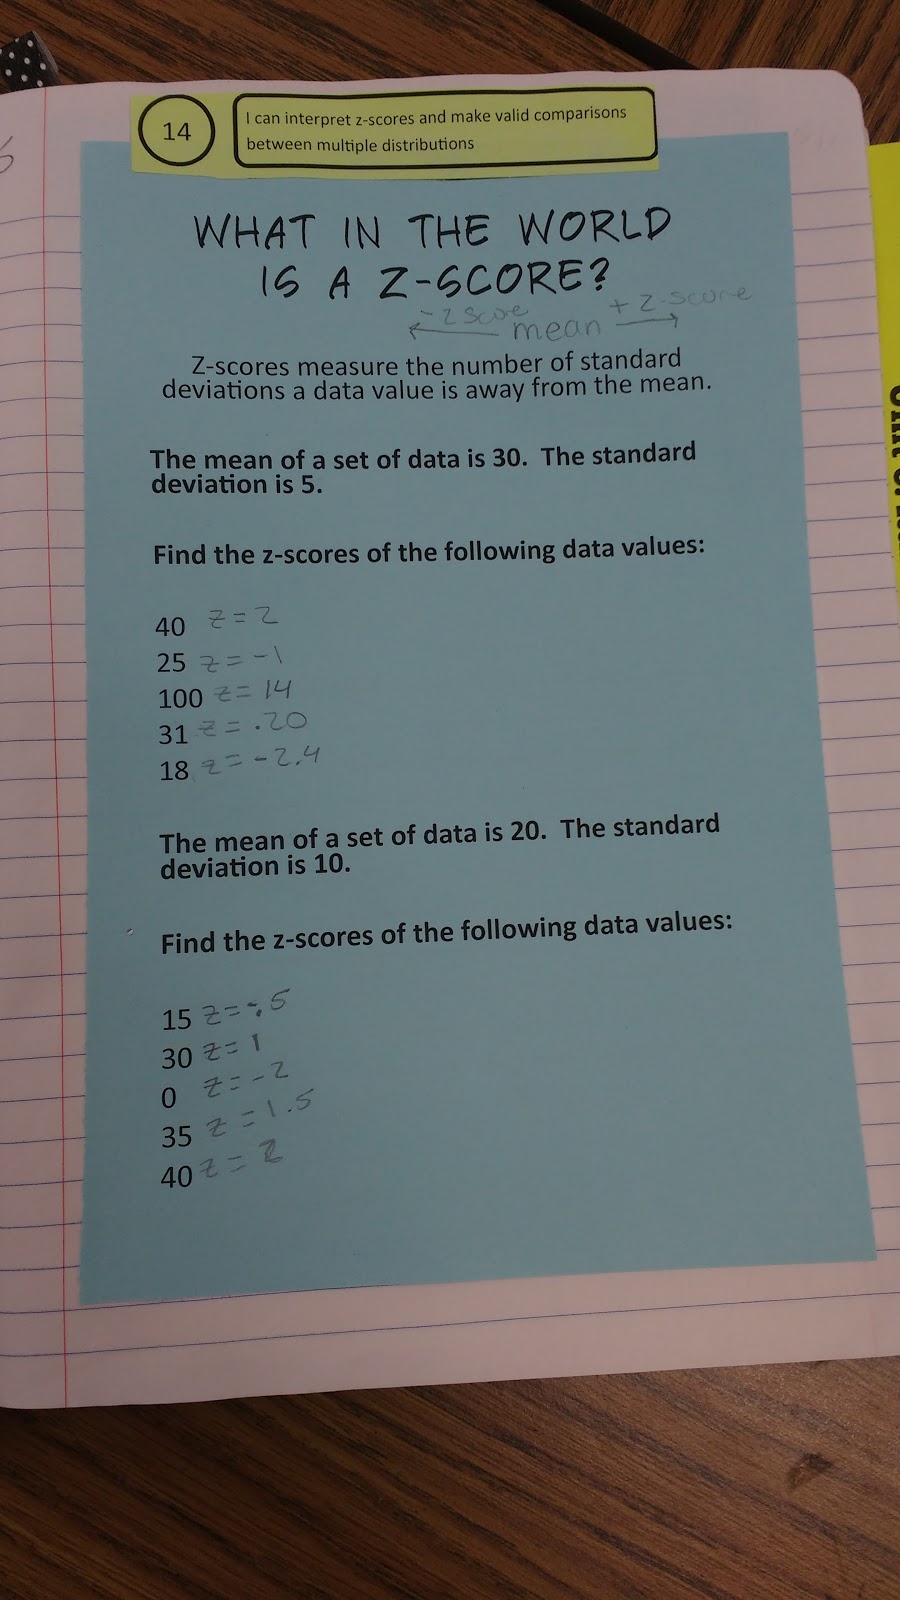
Then, it was time to talk z-scores! I blogged about introducing z-scores here.
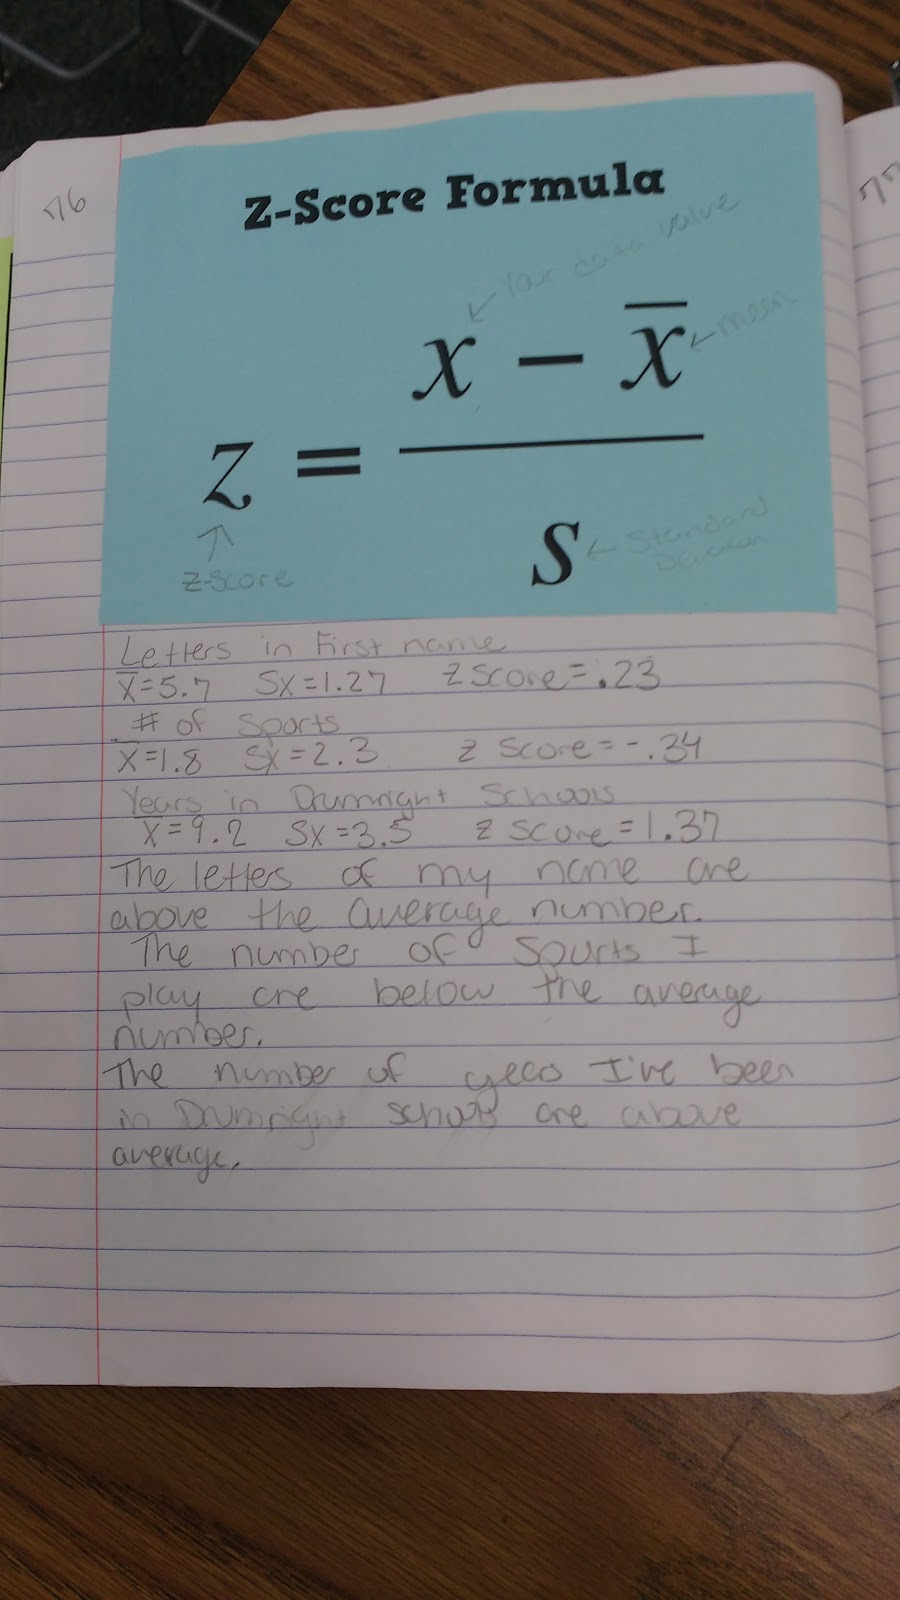
Z-Score Formula:
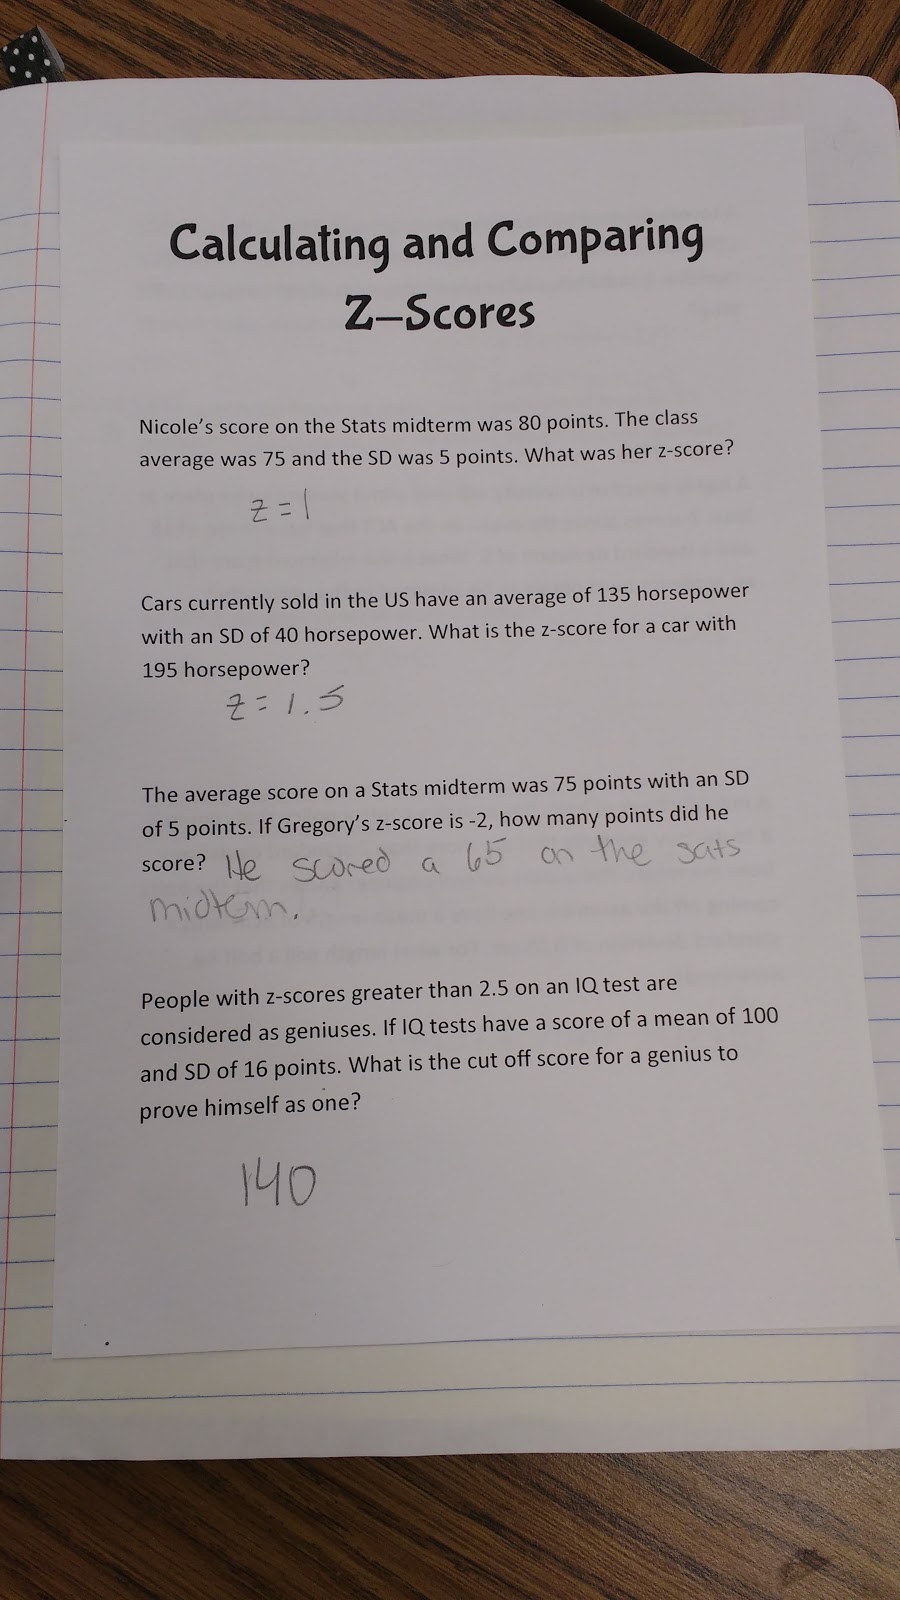
Calculating and Comparing Z-Score Notes
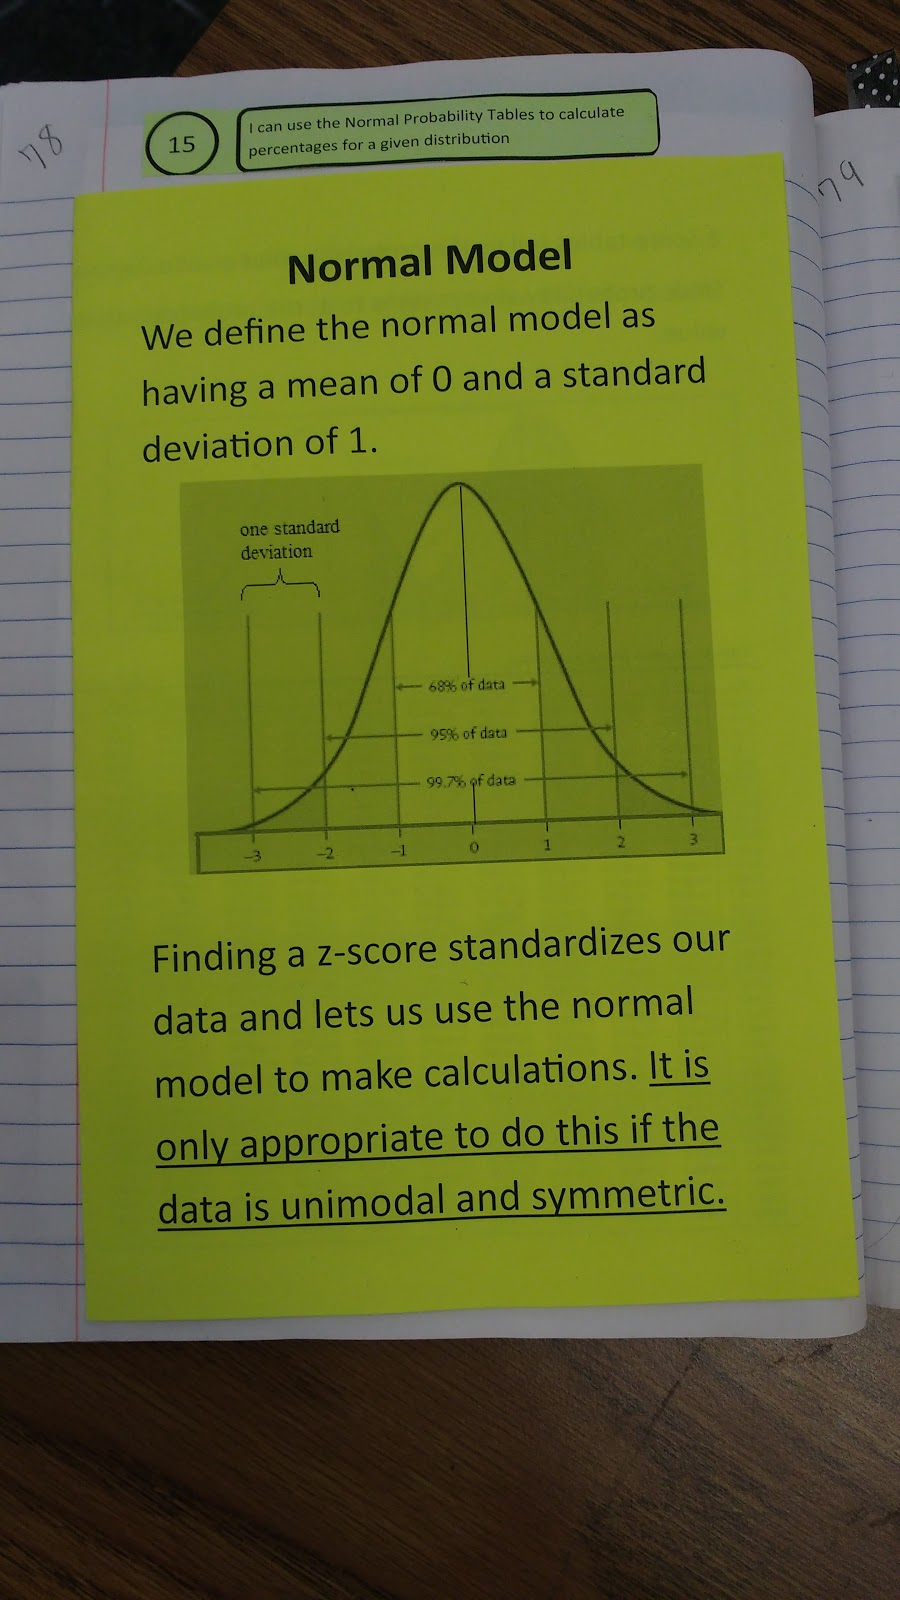
Normal Model Notes:
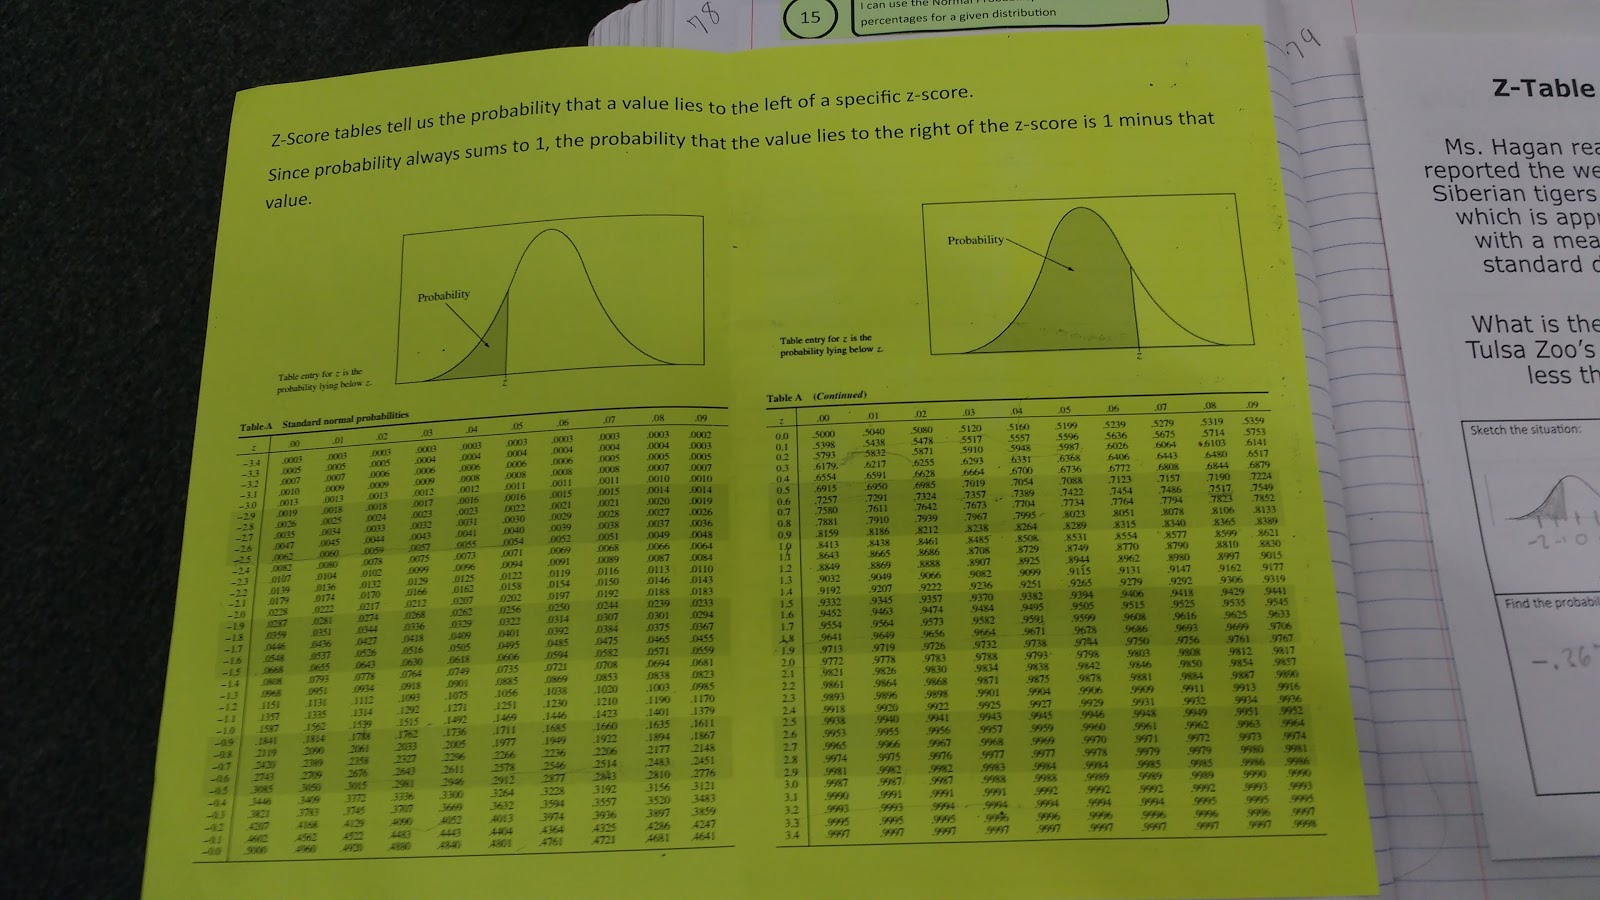
Normal Model Tables:
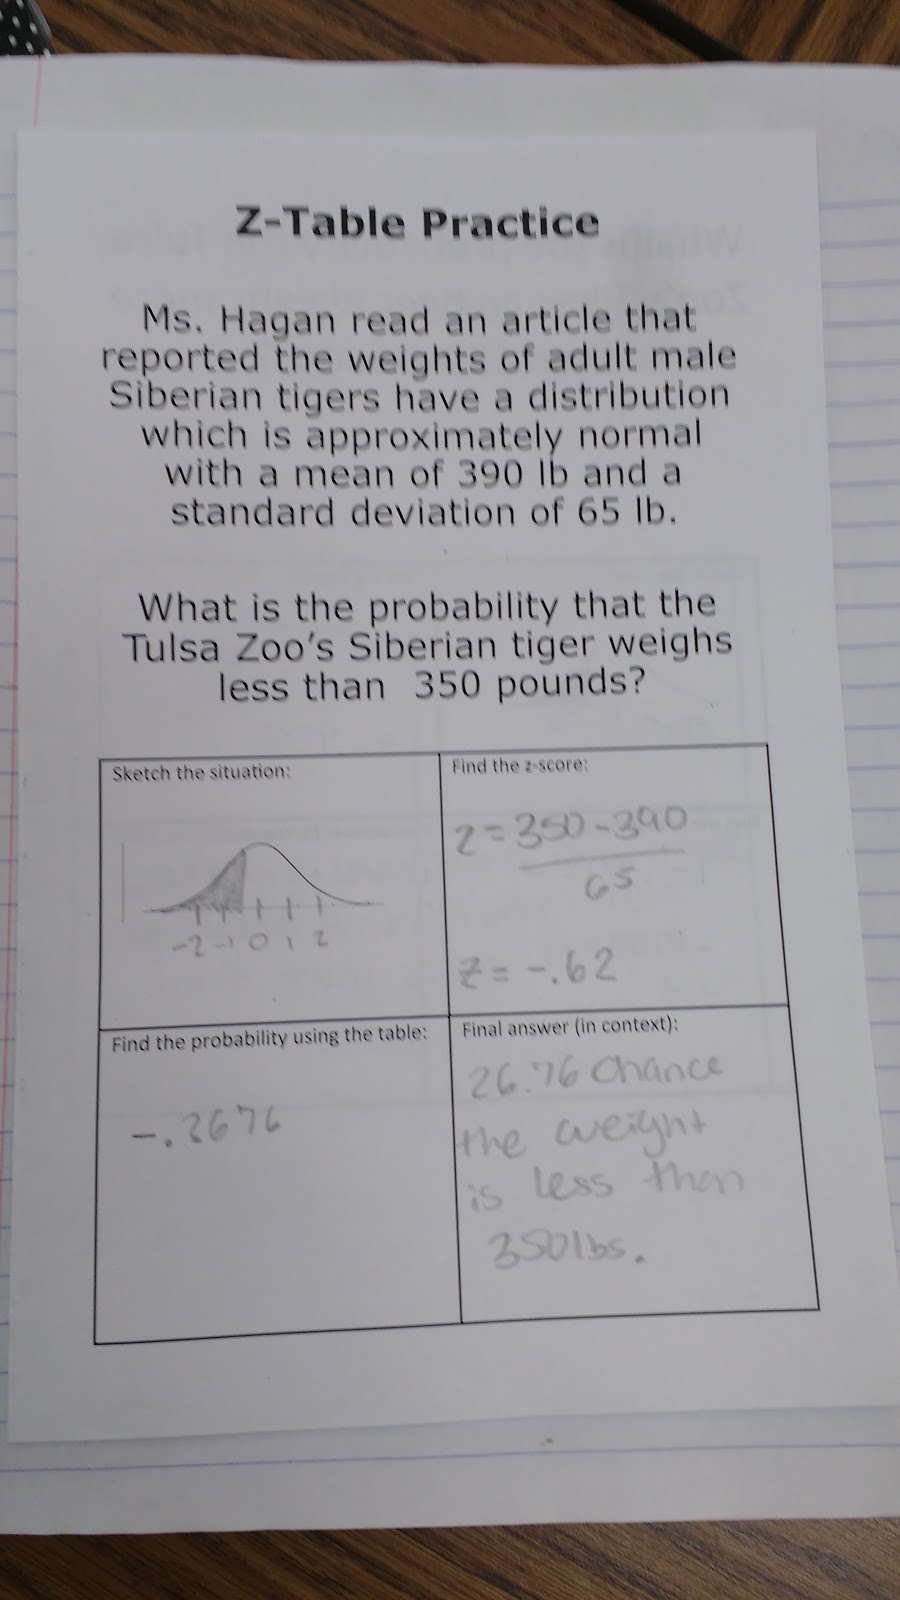
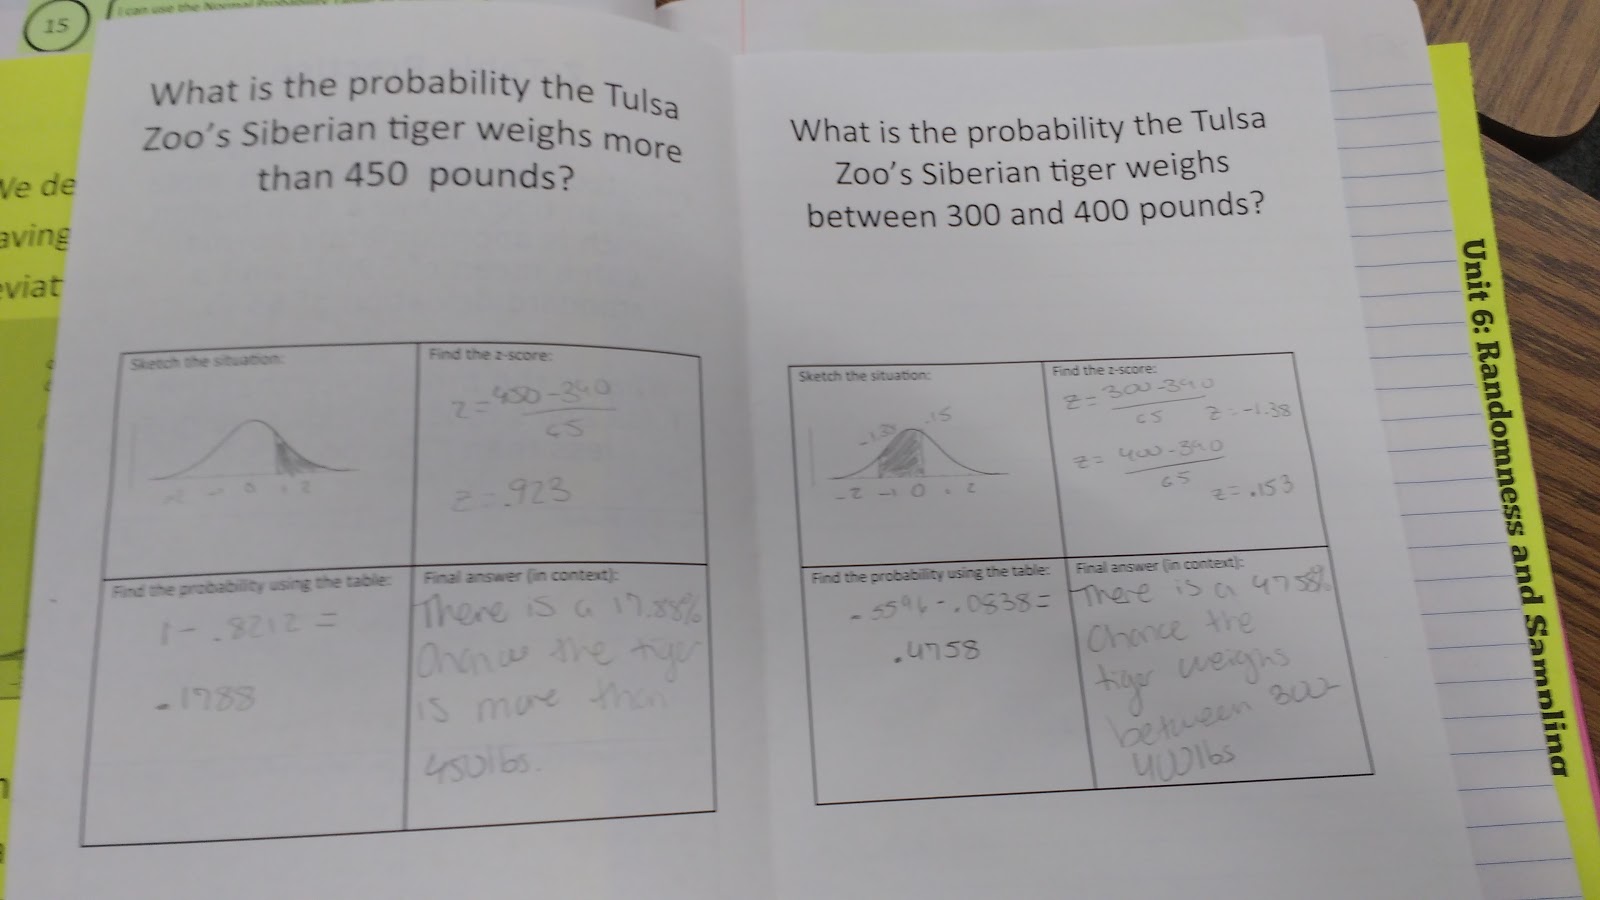
Z-Table Practice:
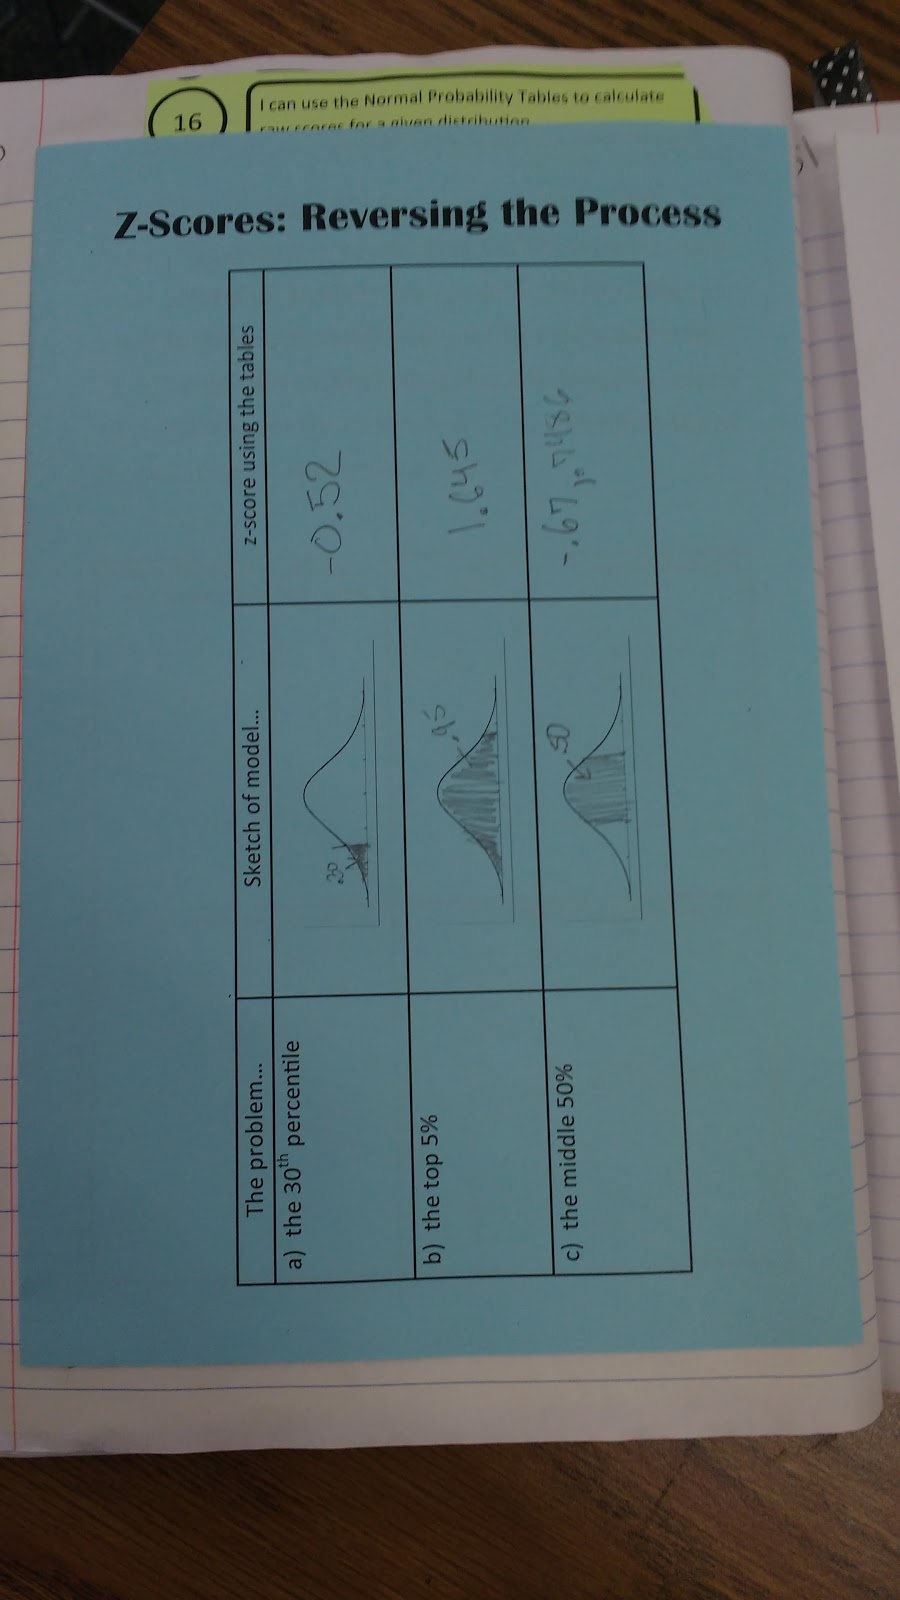
Z-Scores In Reverse:
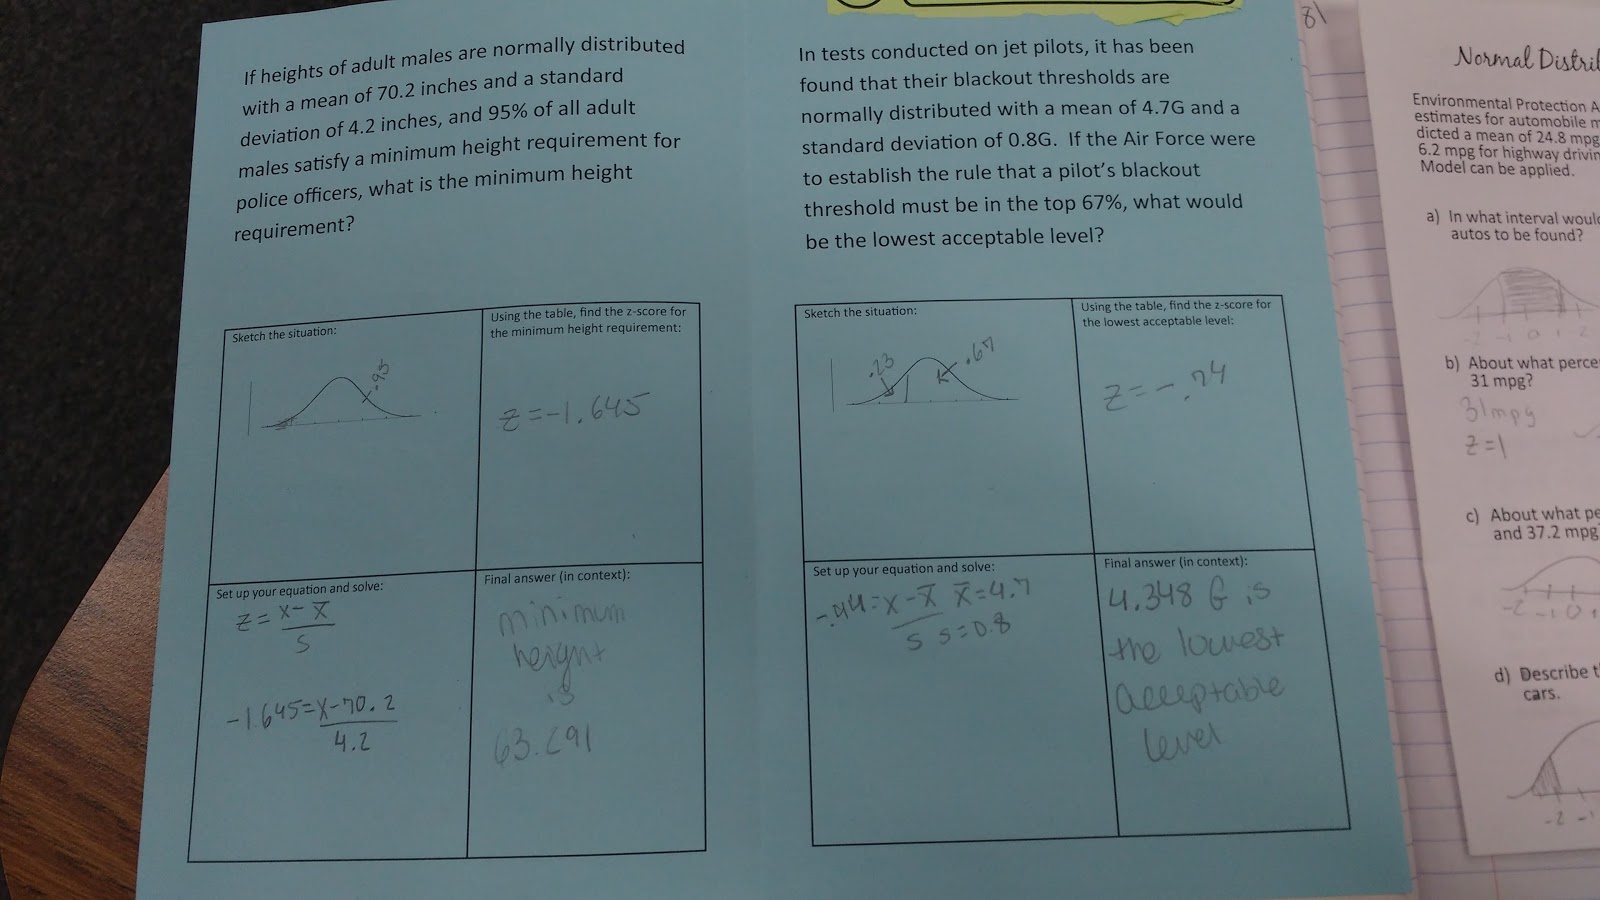
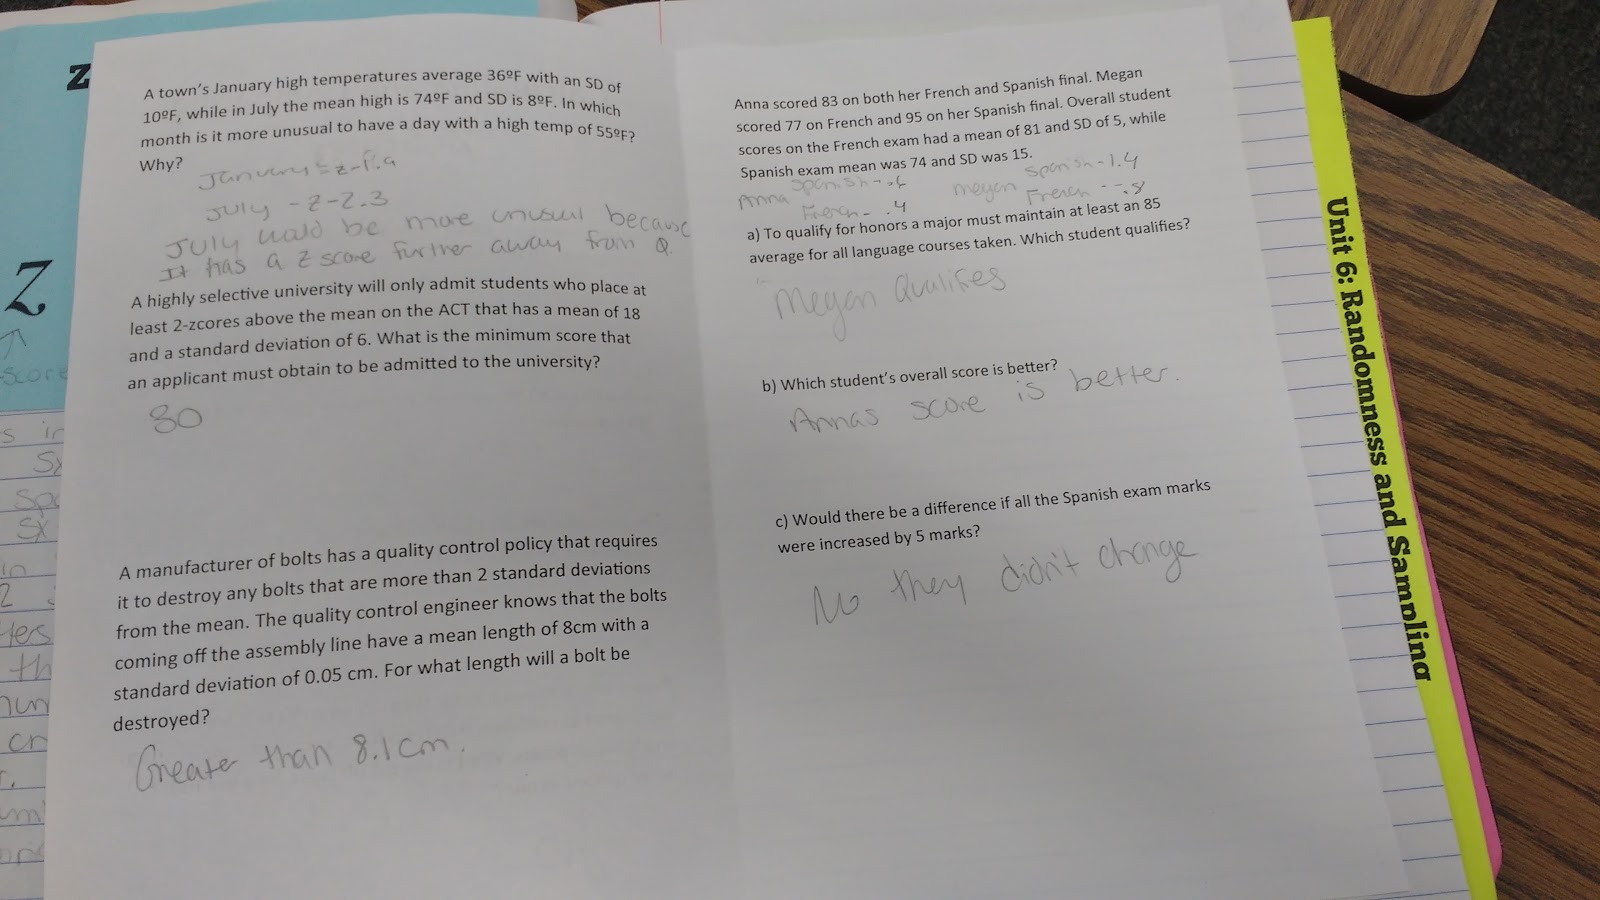
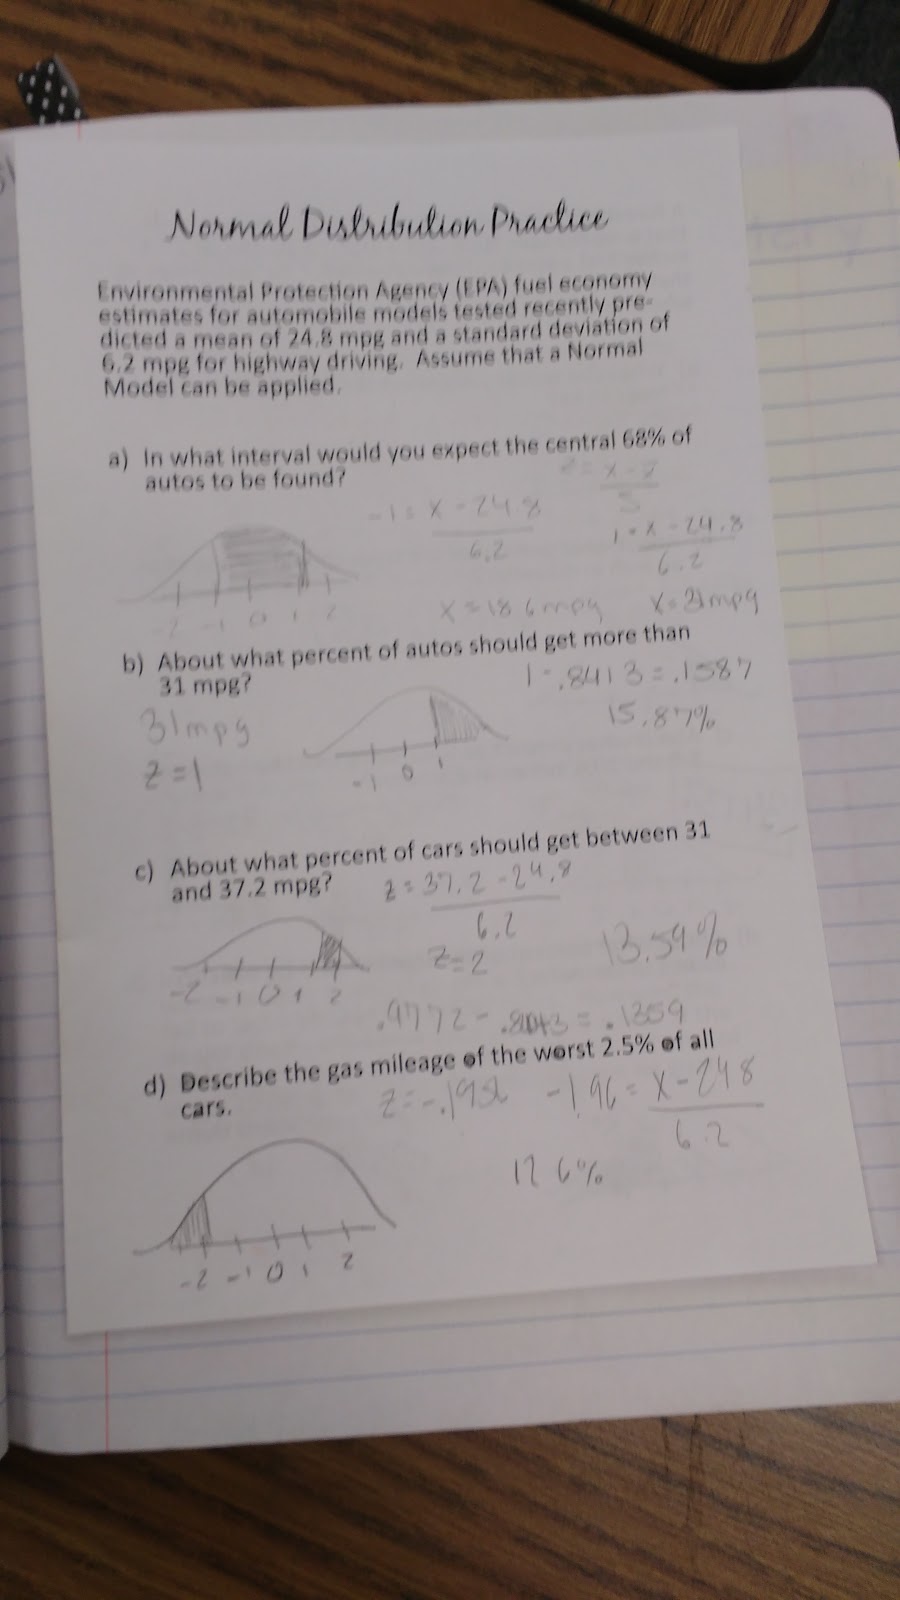
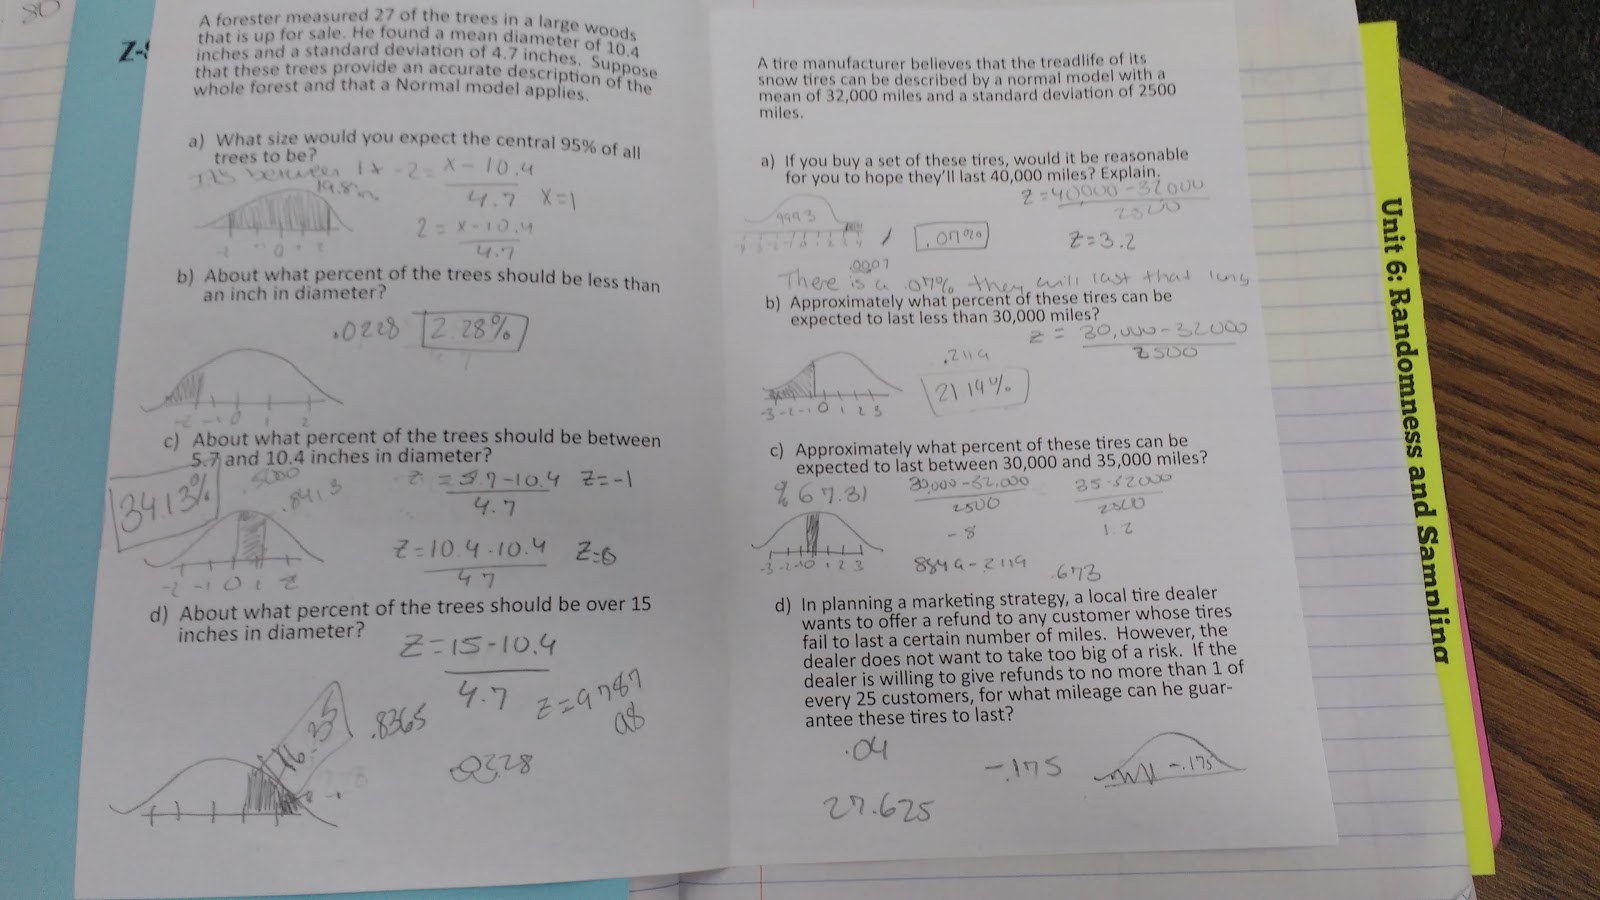
More Normal Distribution Practice:
Unit 6!
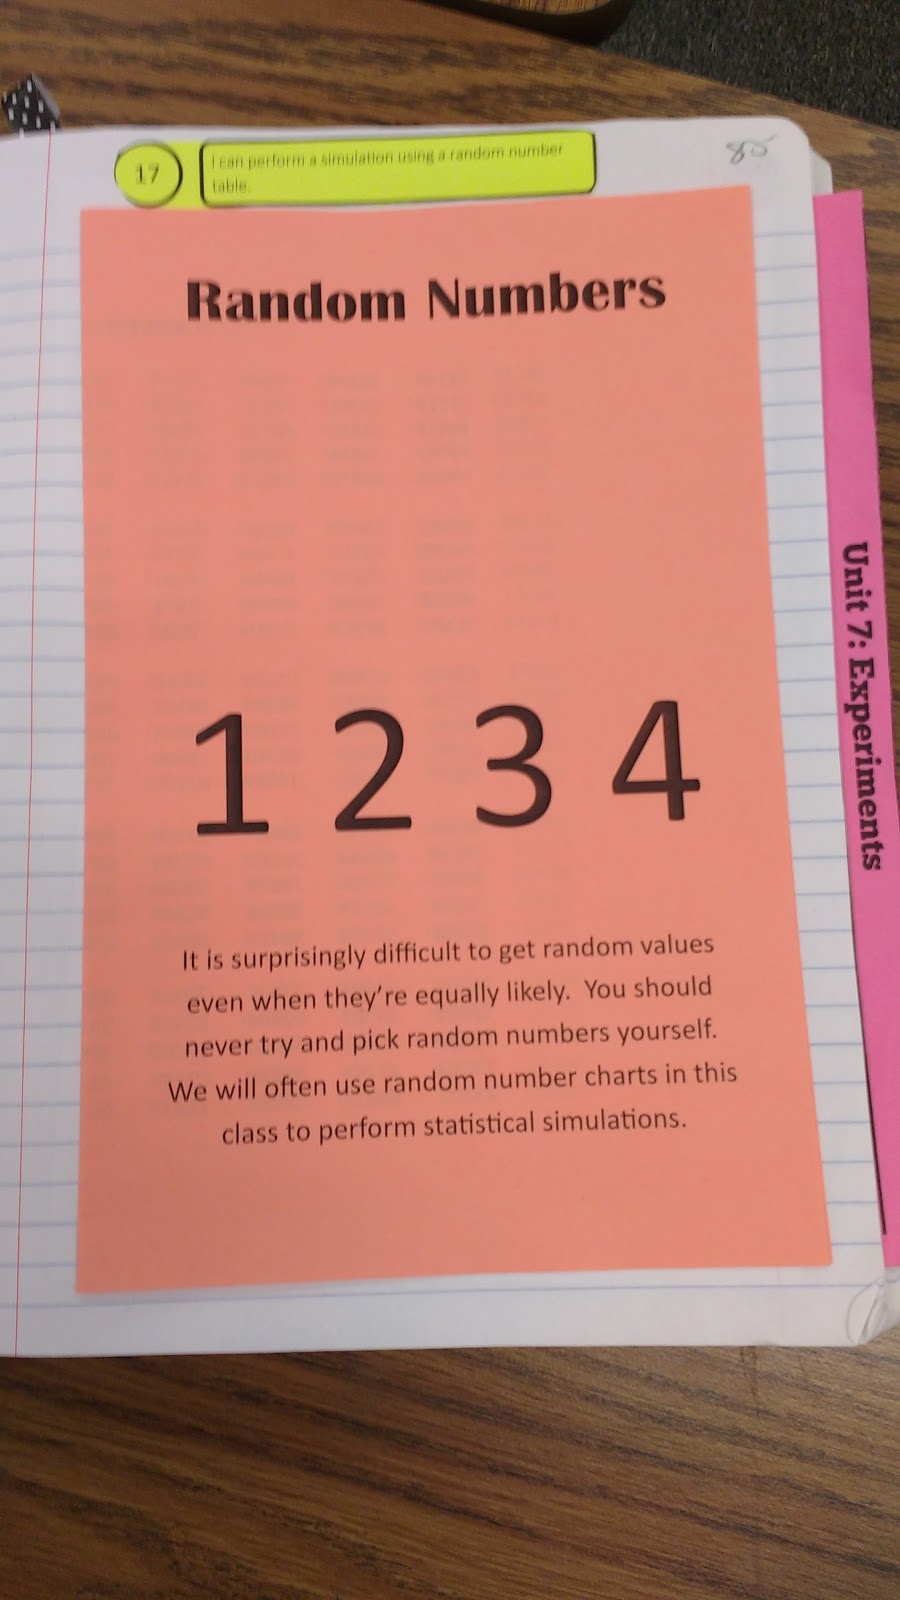
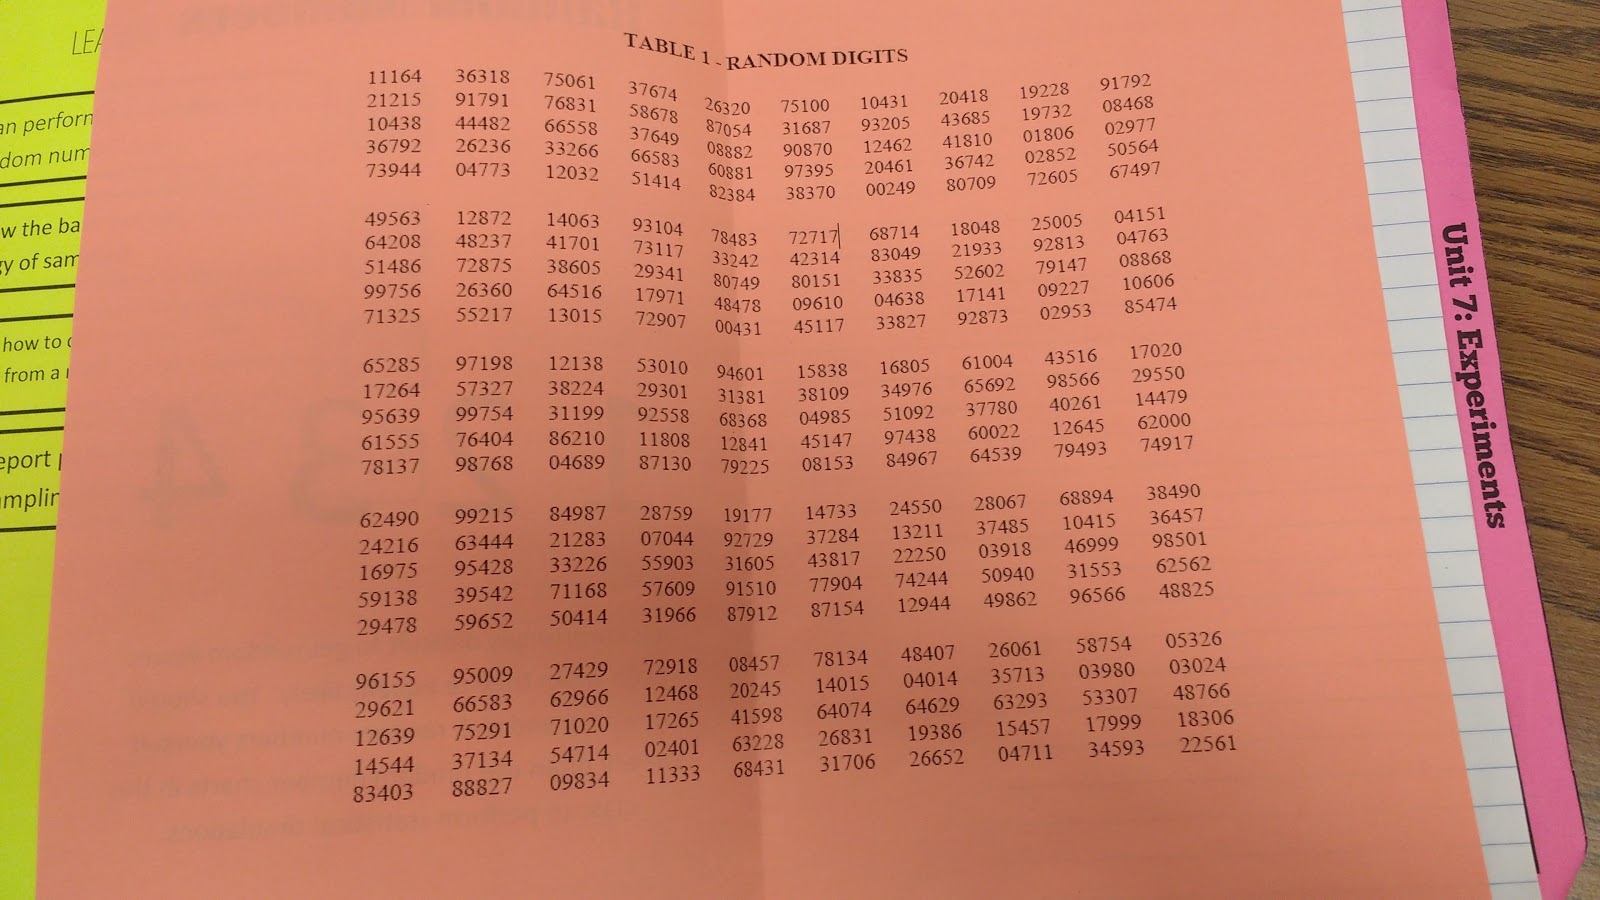
Foldable with Random Number Table Inside:
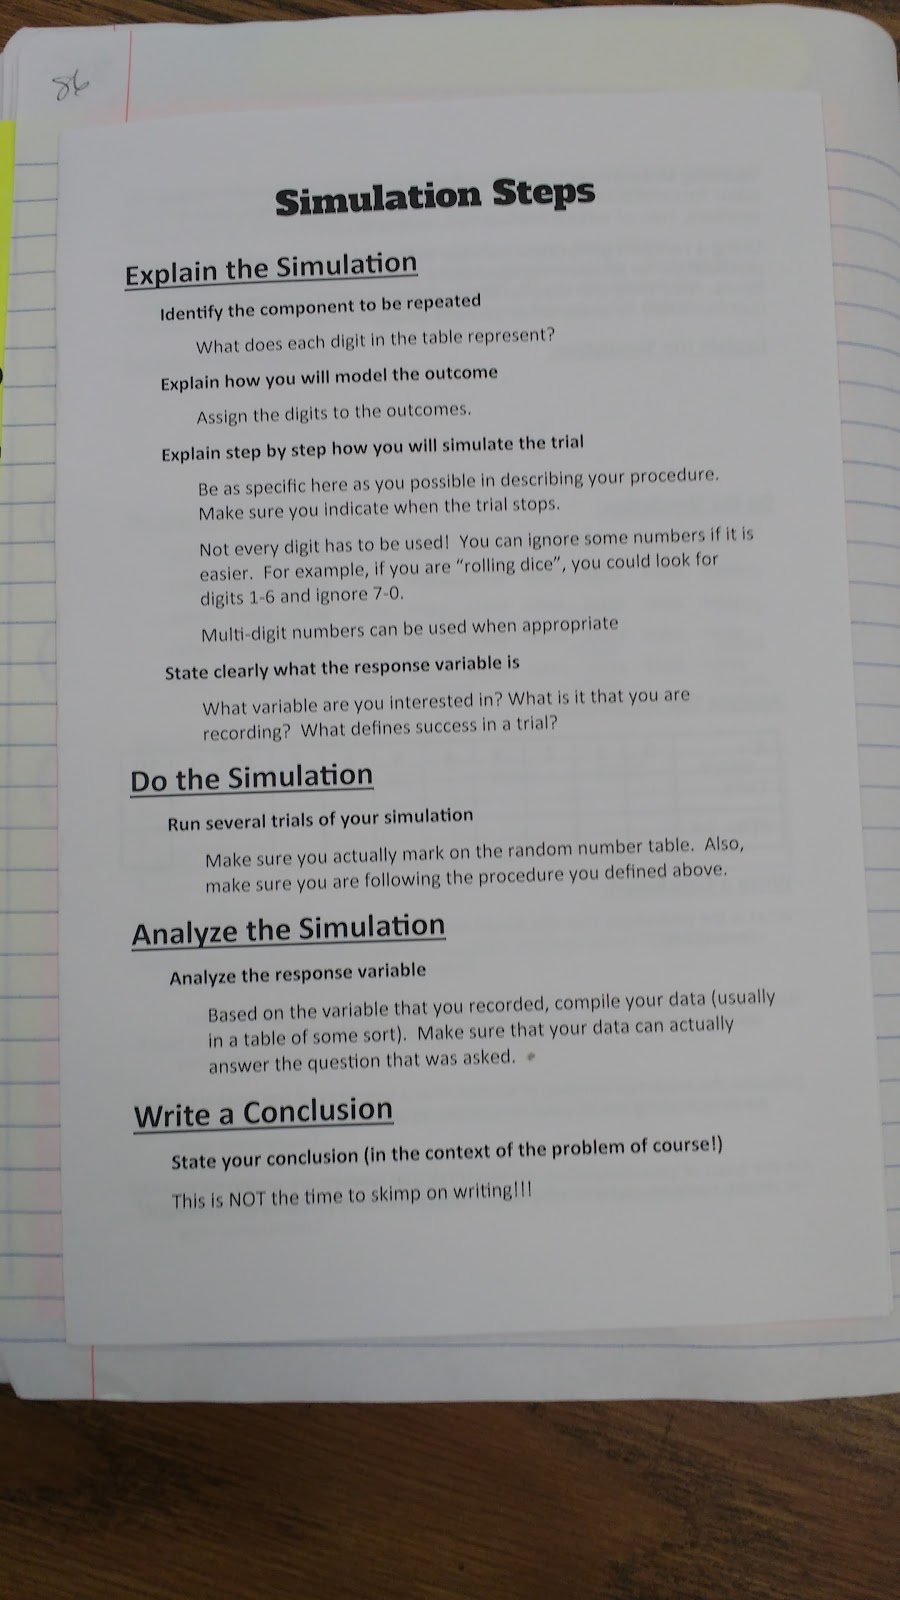
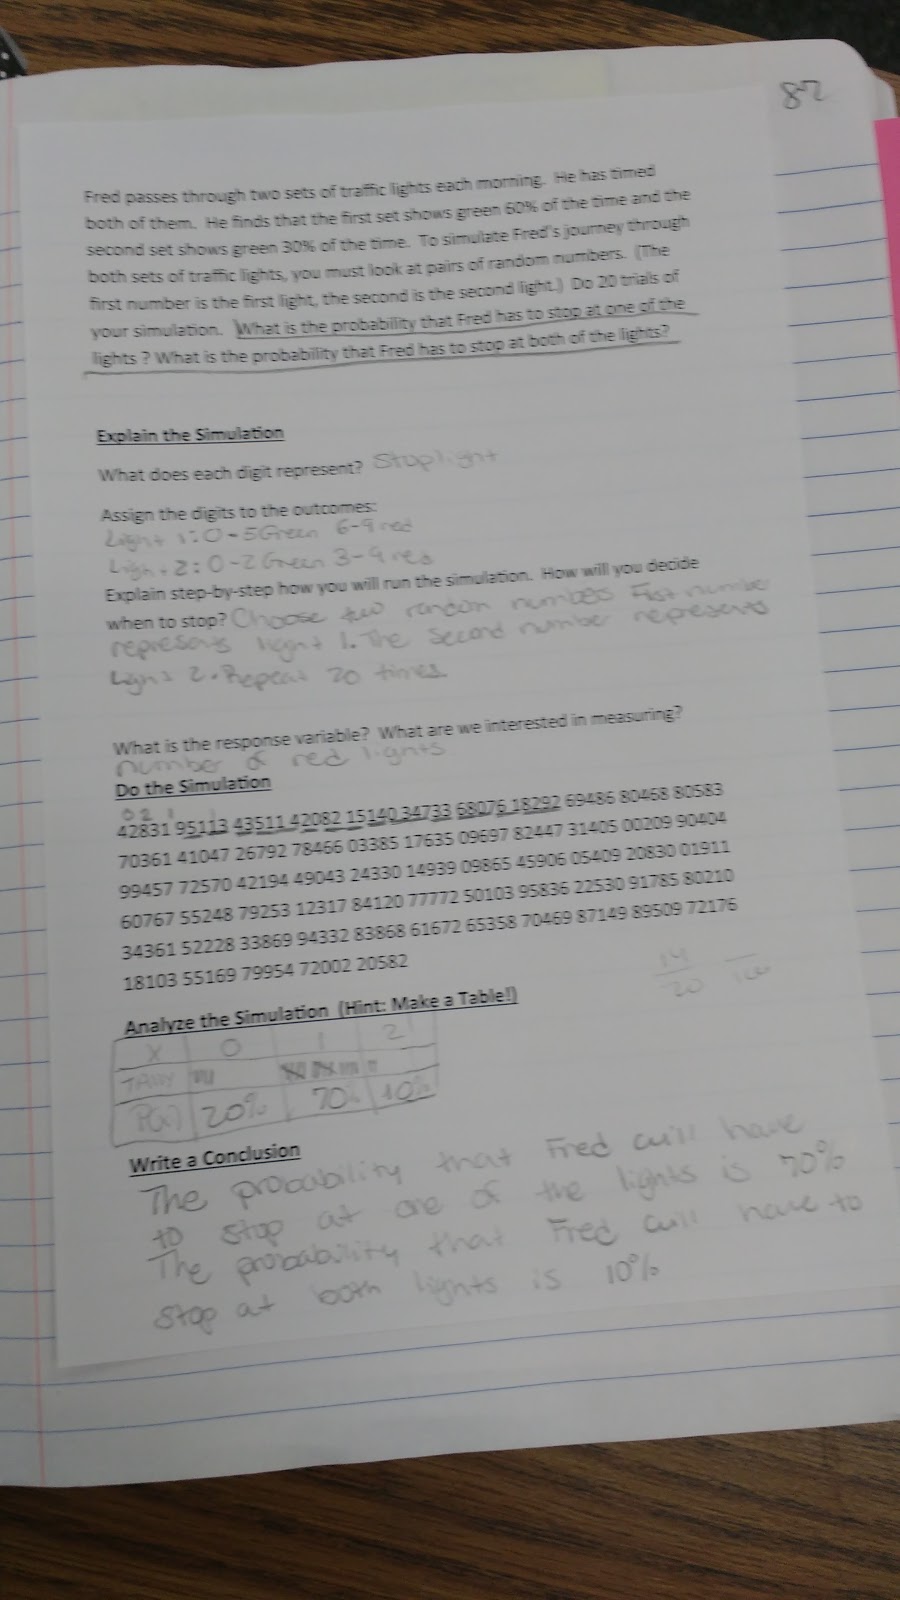
Steps for a Simulation:
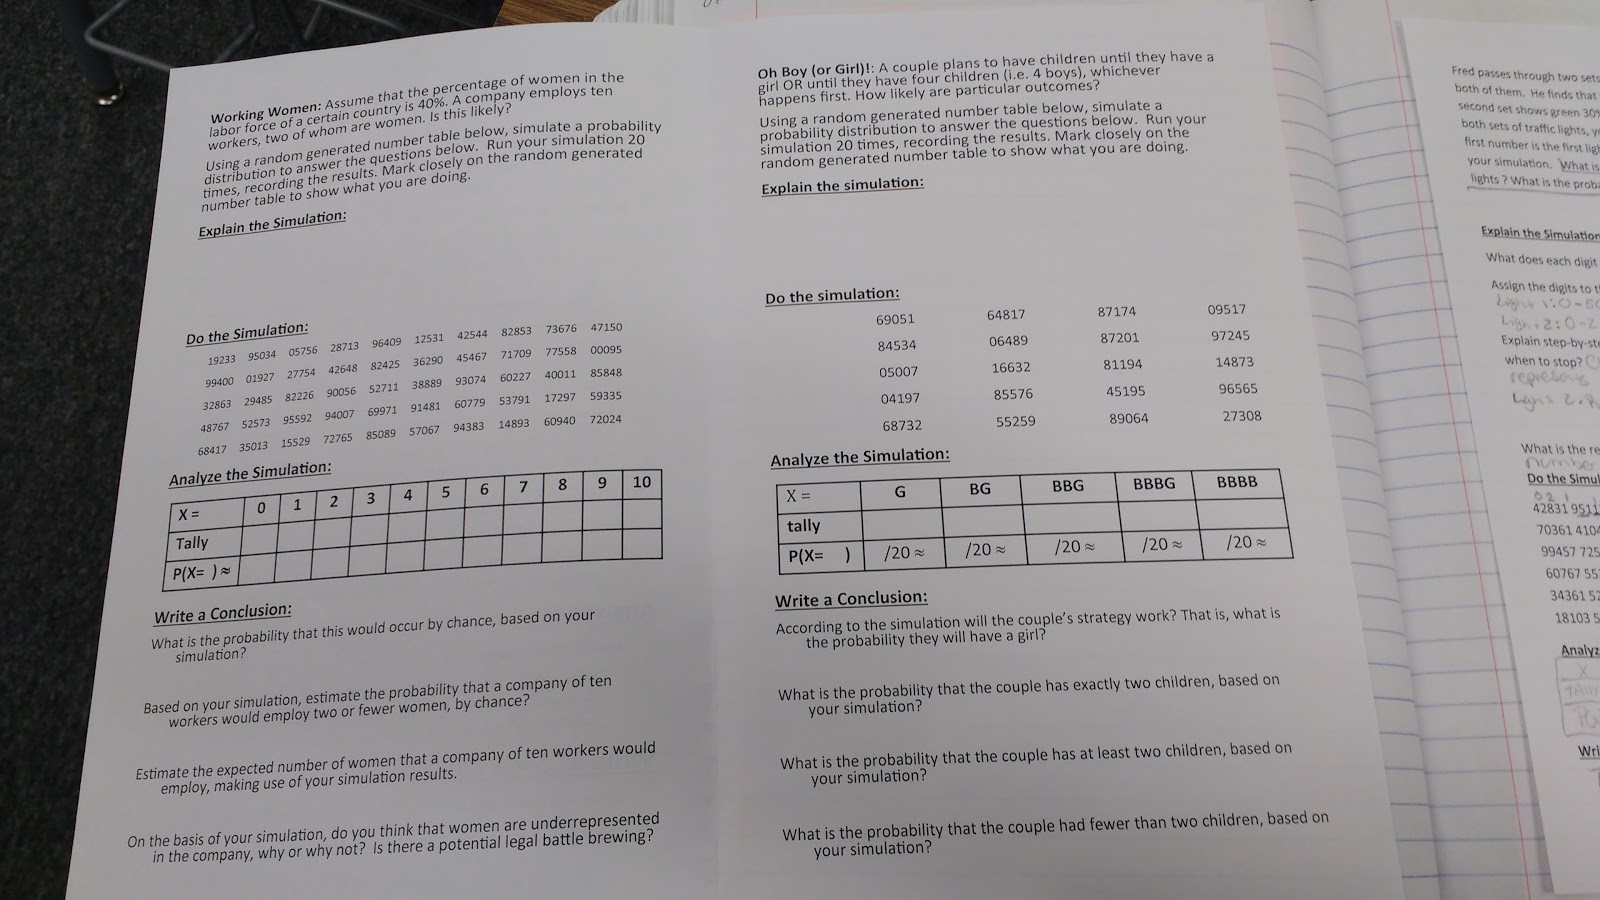
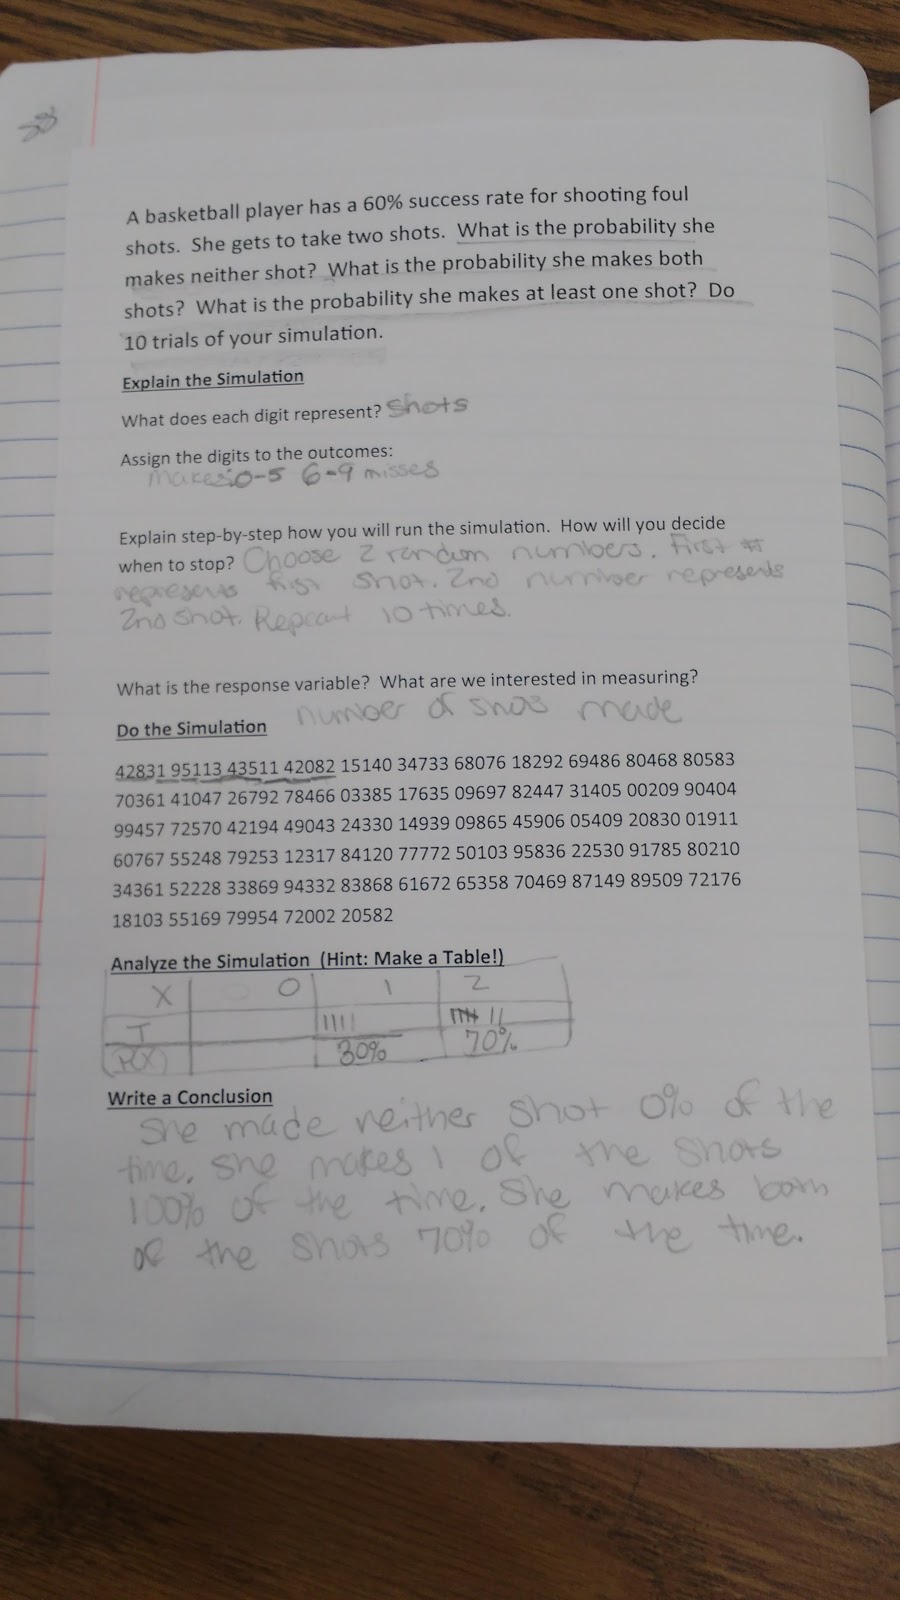
Simulation Practice:
Realized afterward we needed even more practice!
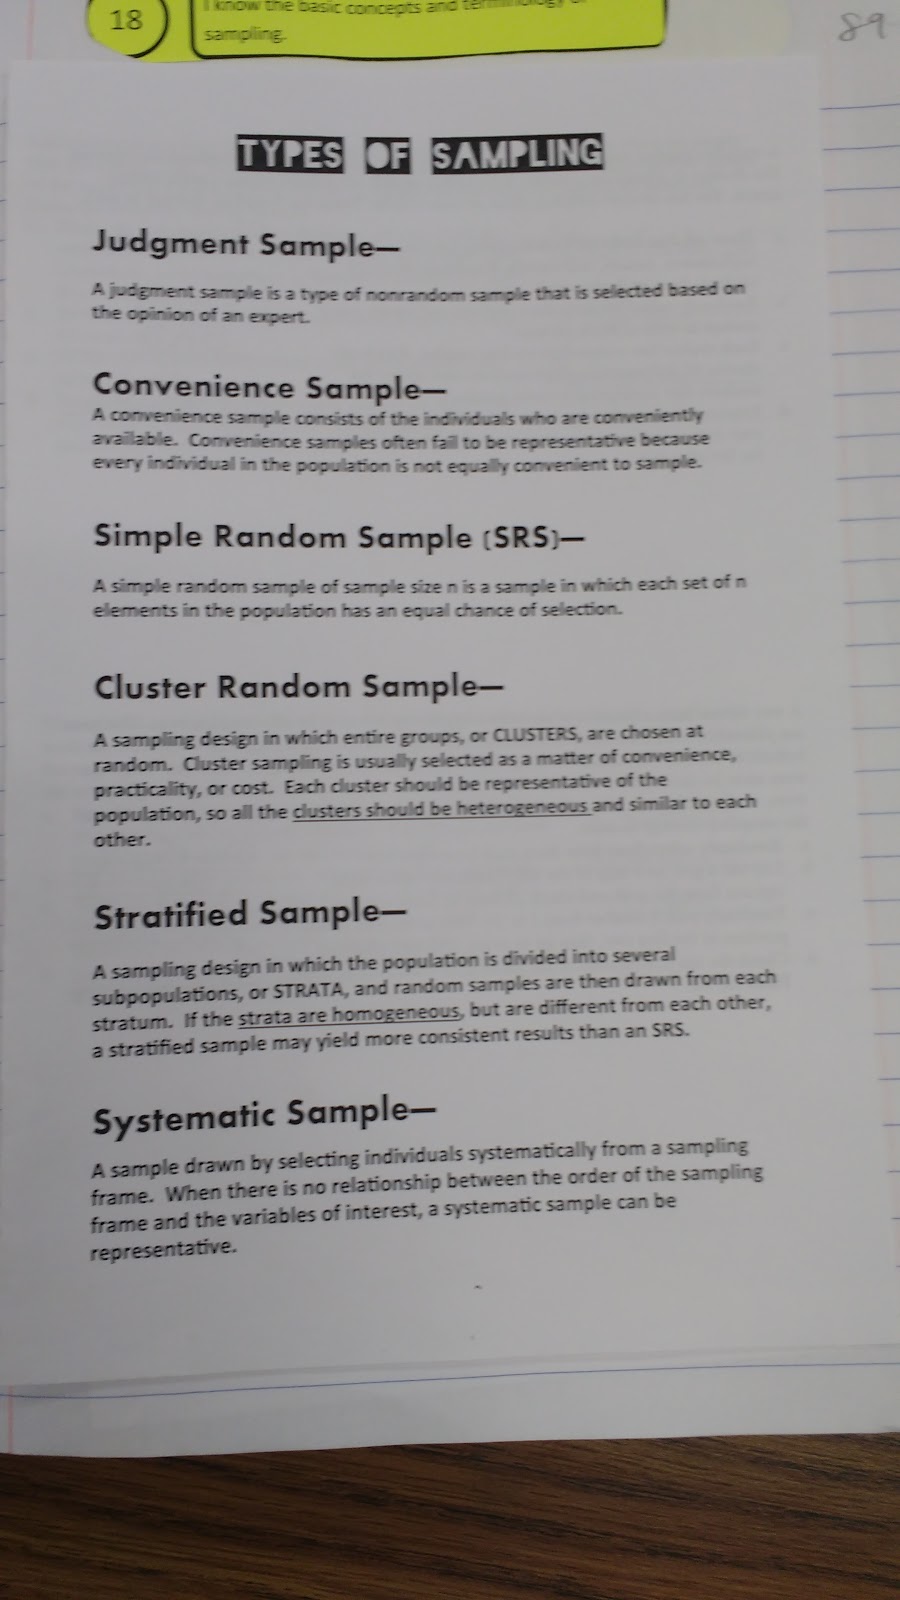
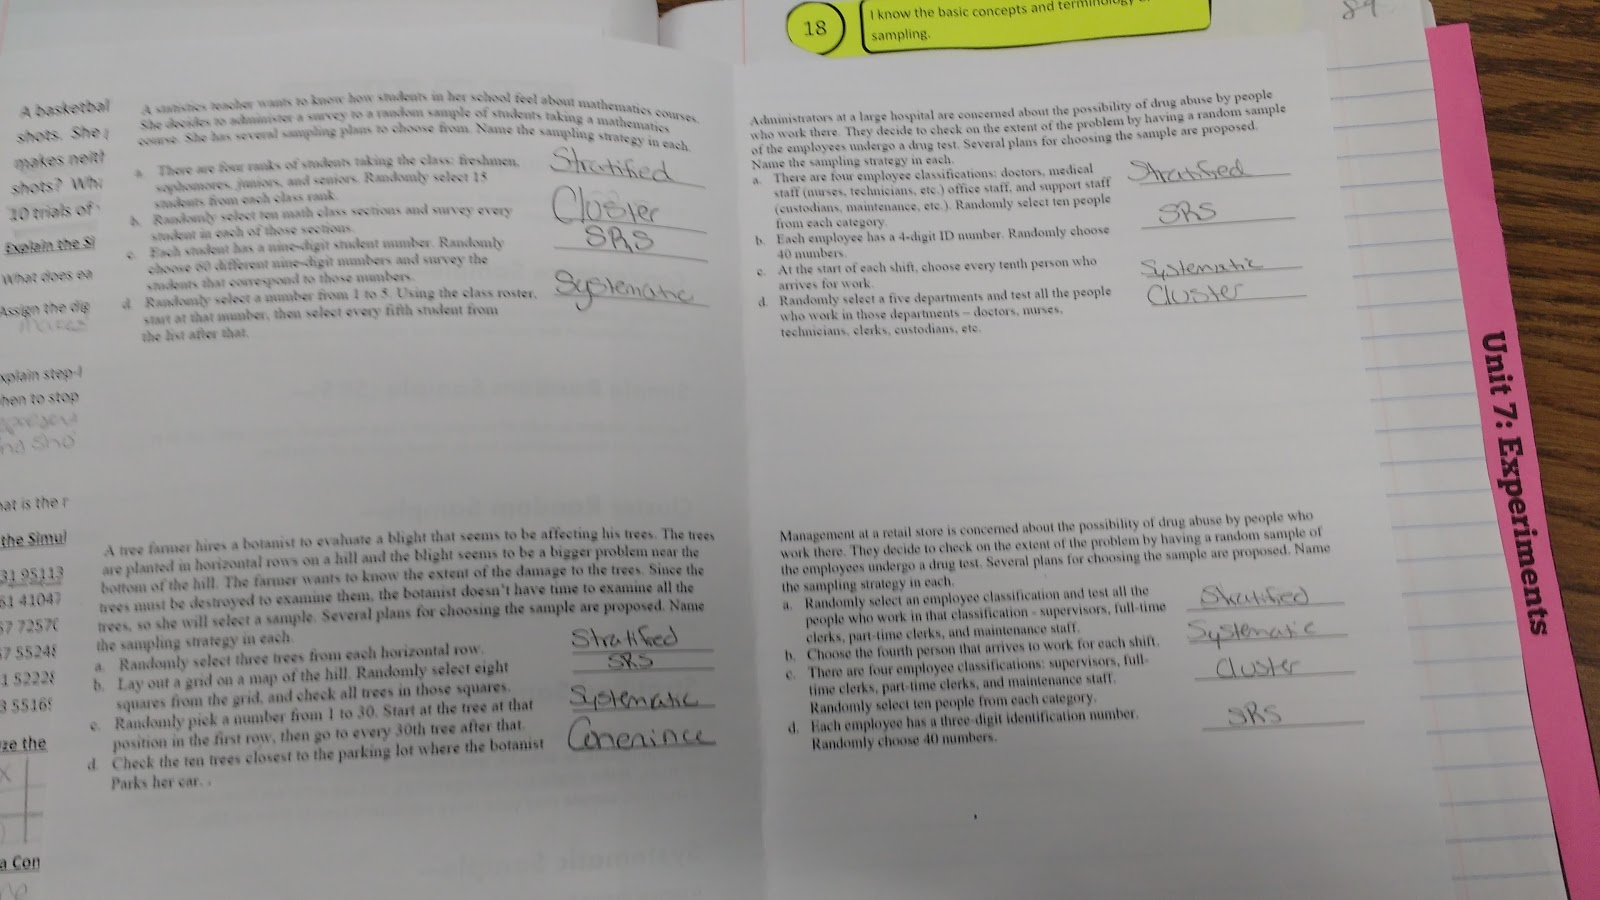
Types of Sampling Notes:
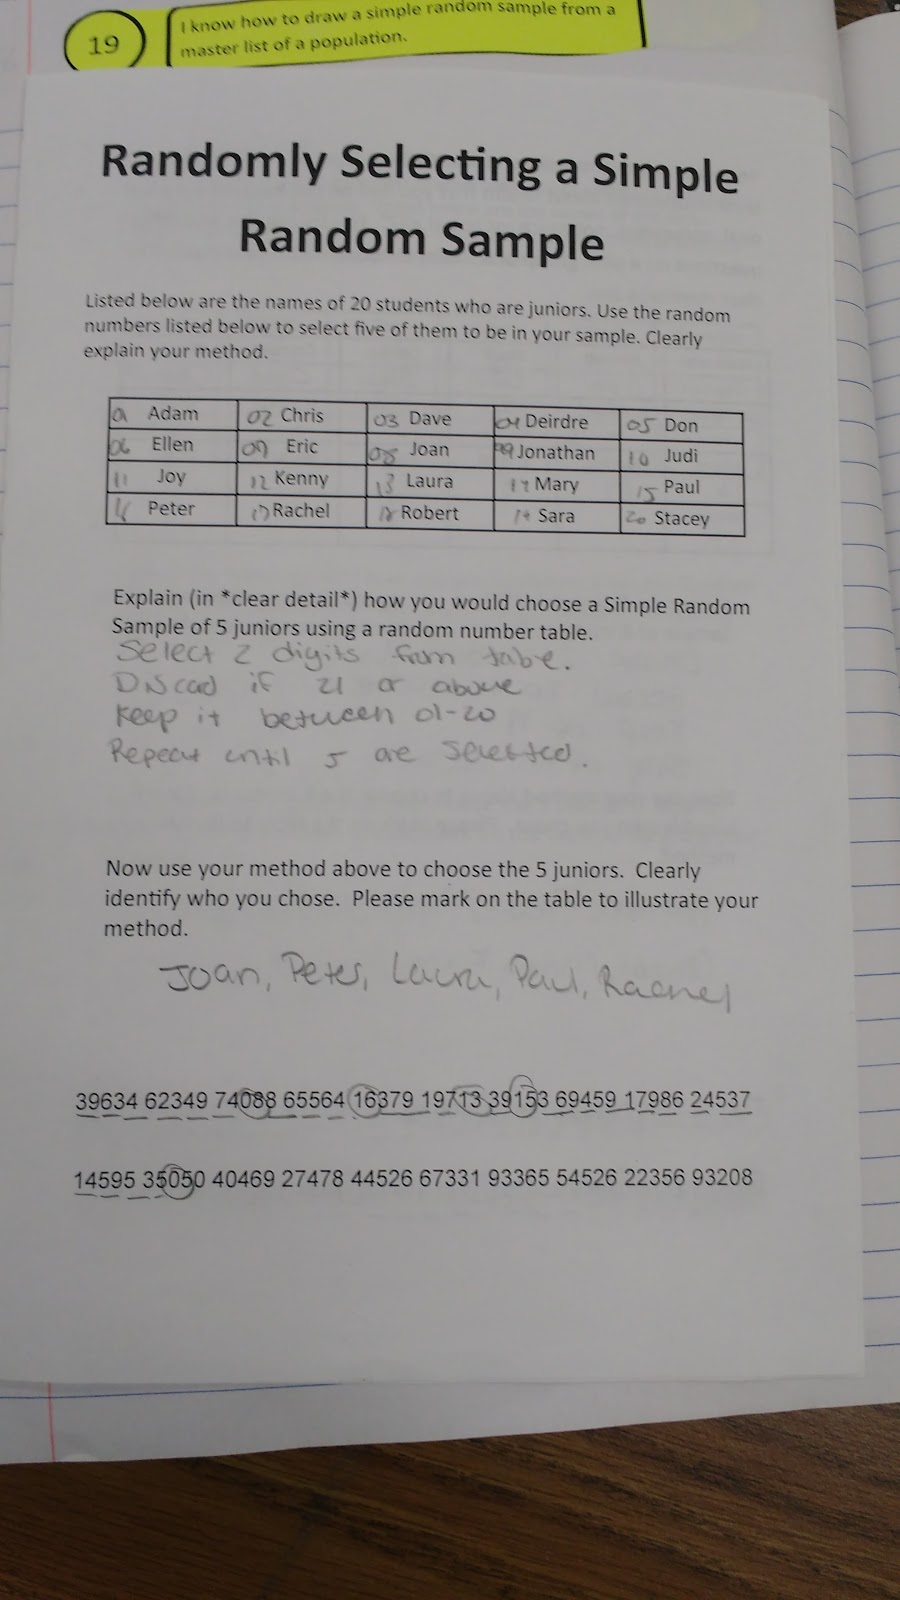
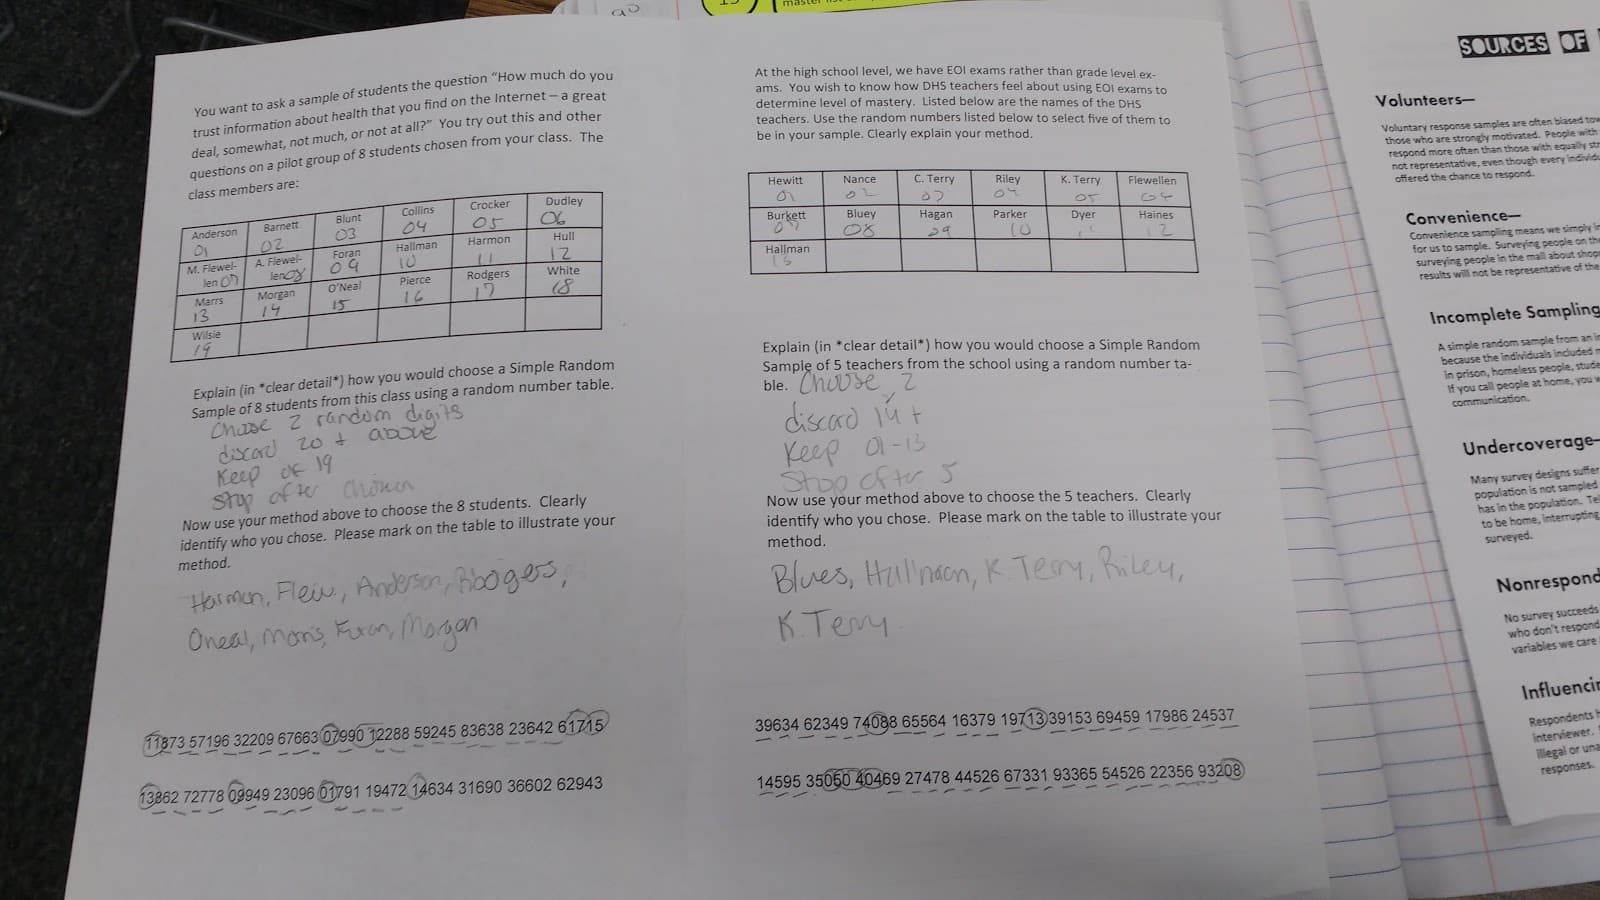
How to Randomly Select a Simple Random Sample:
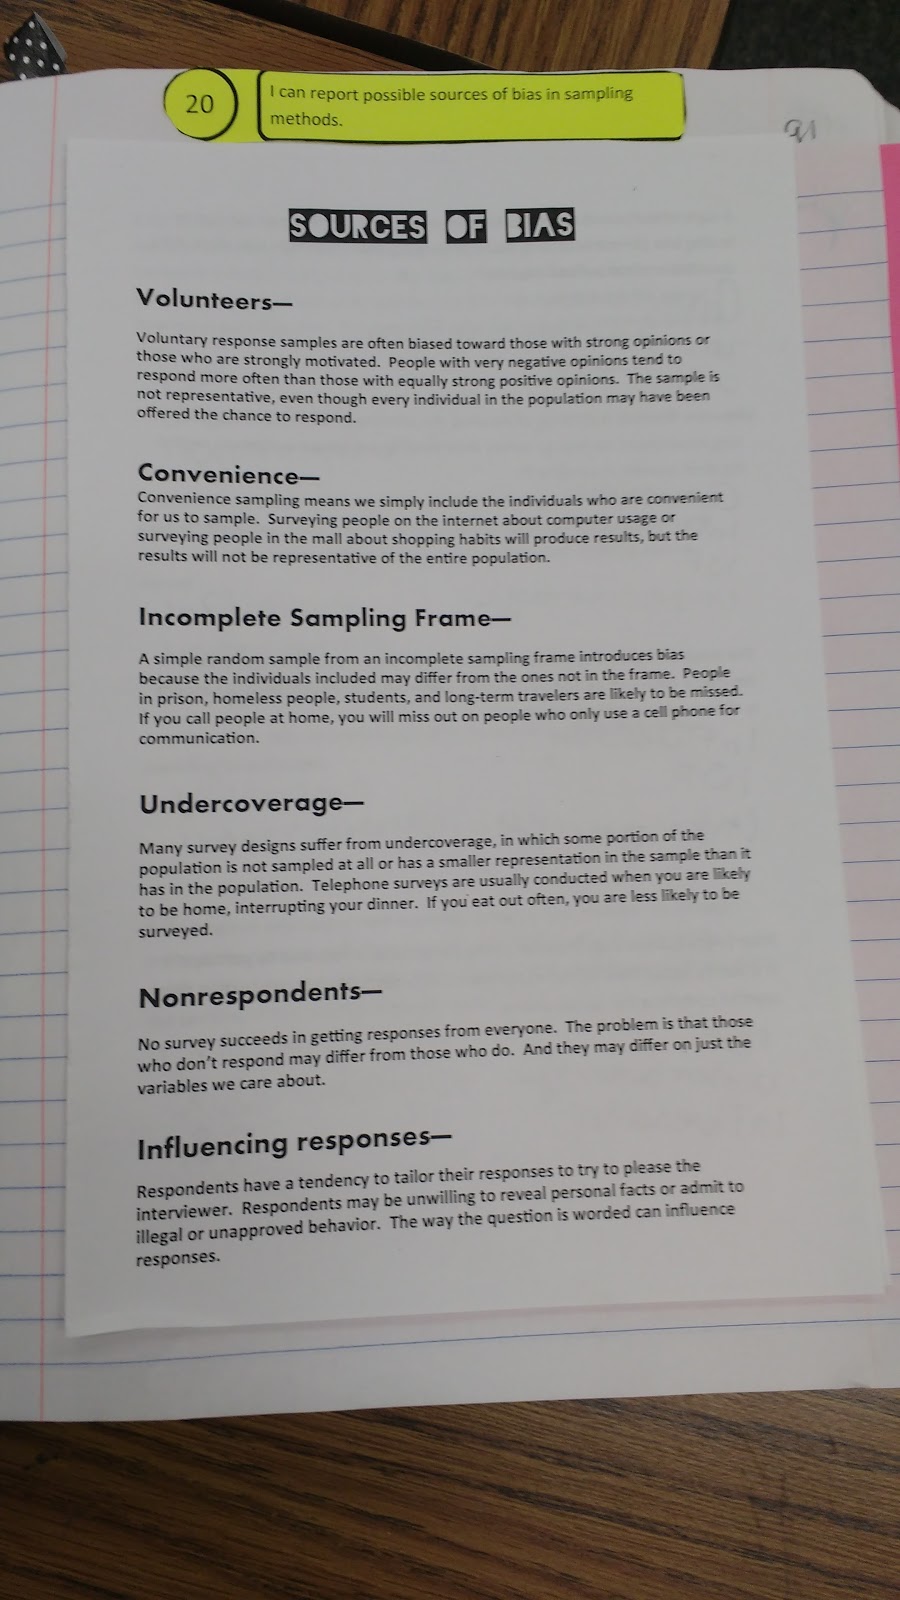
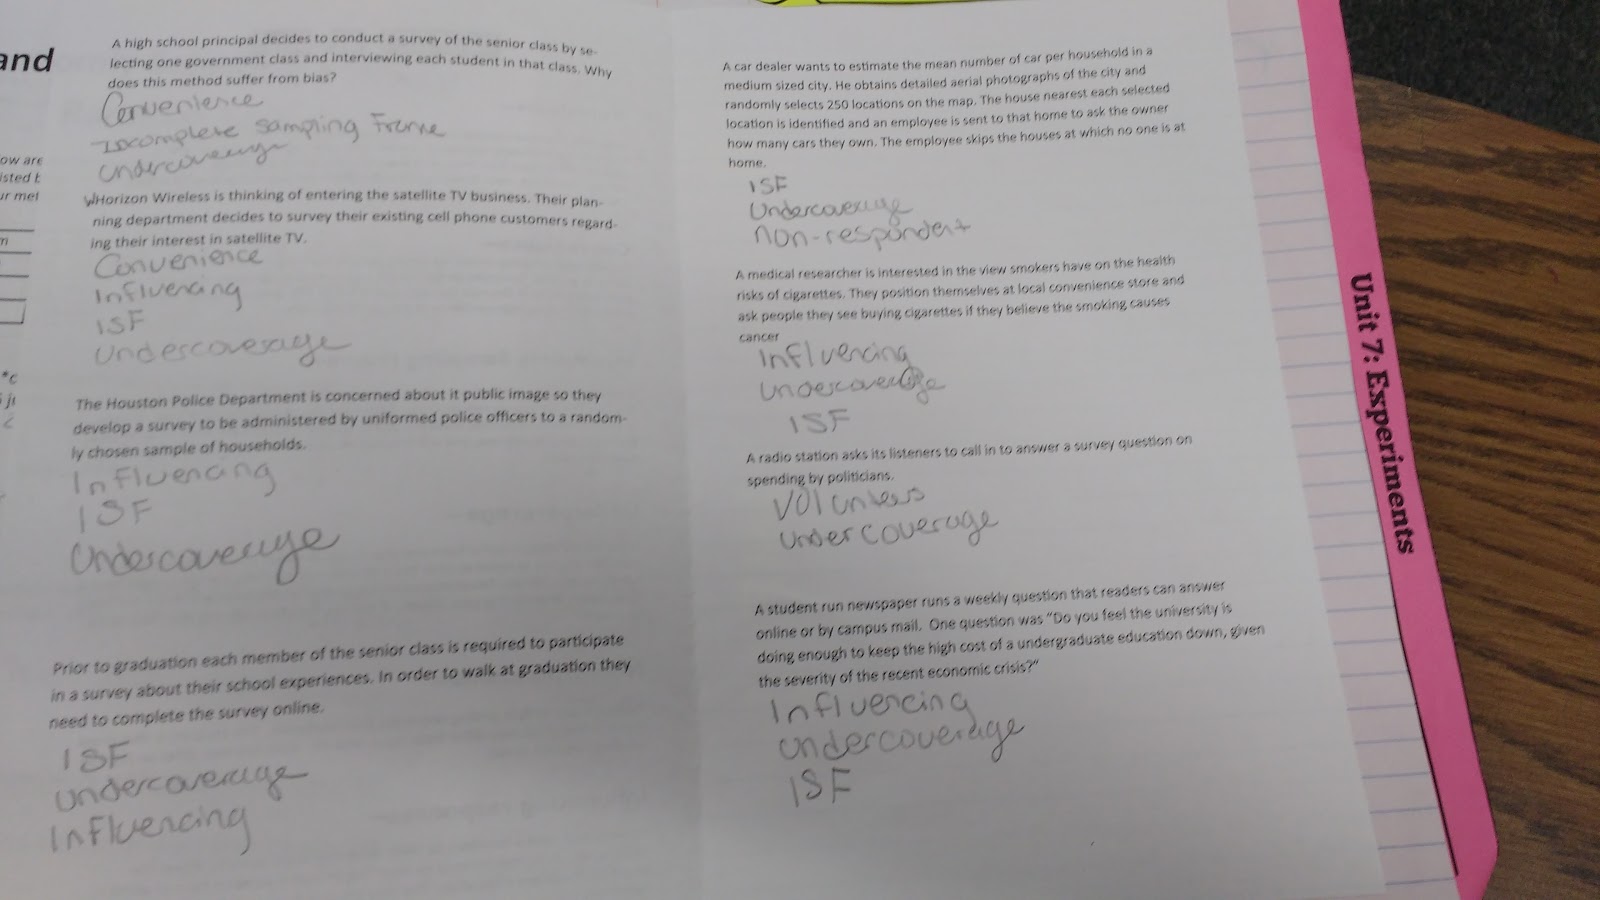
Sources of Bias:
Unit 7!
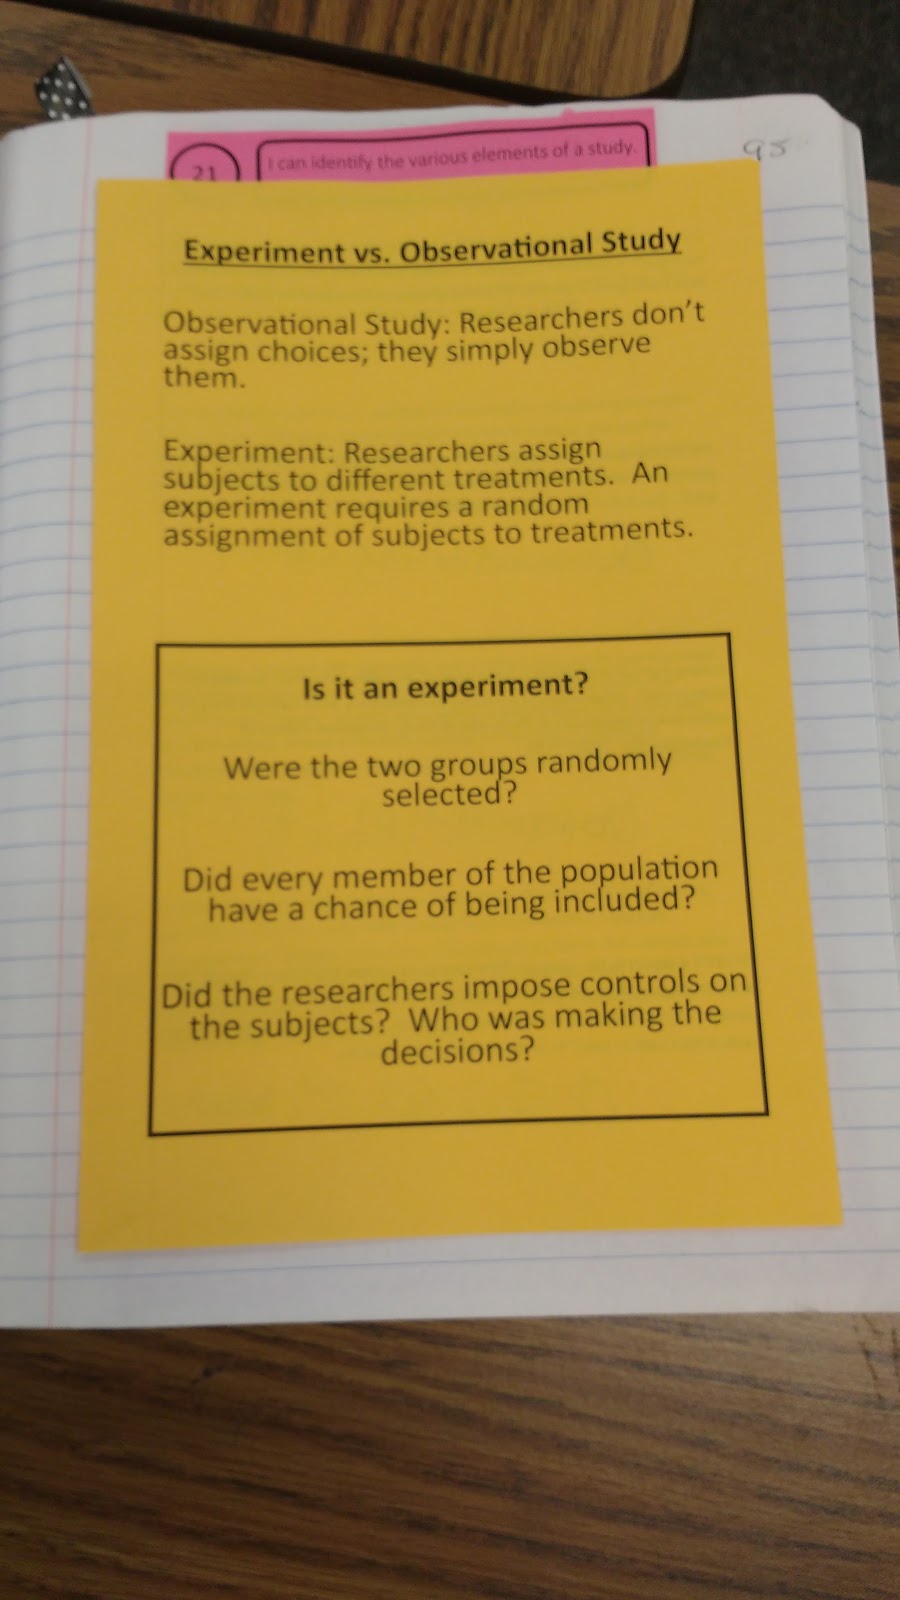
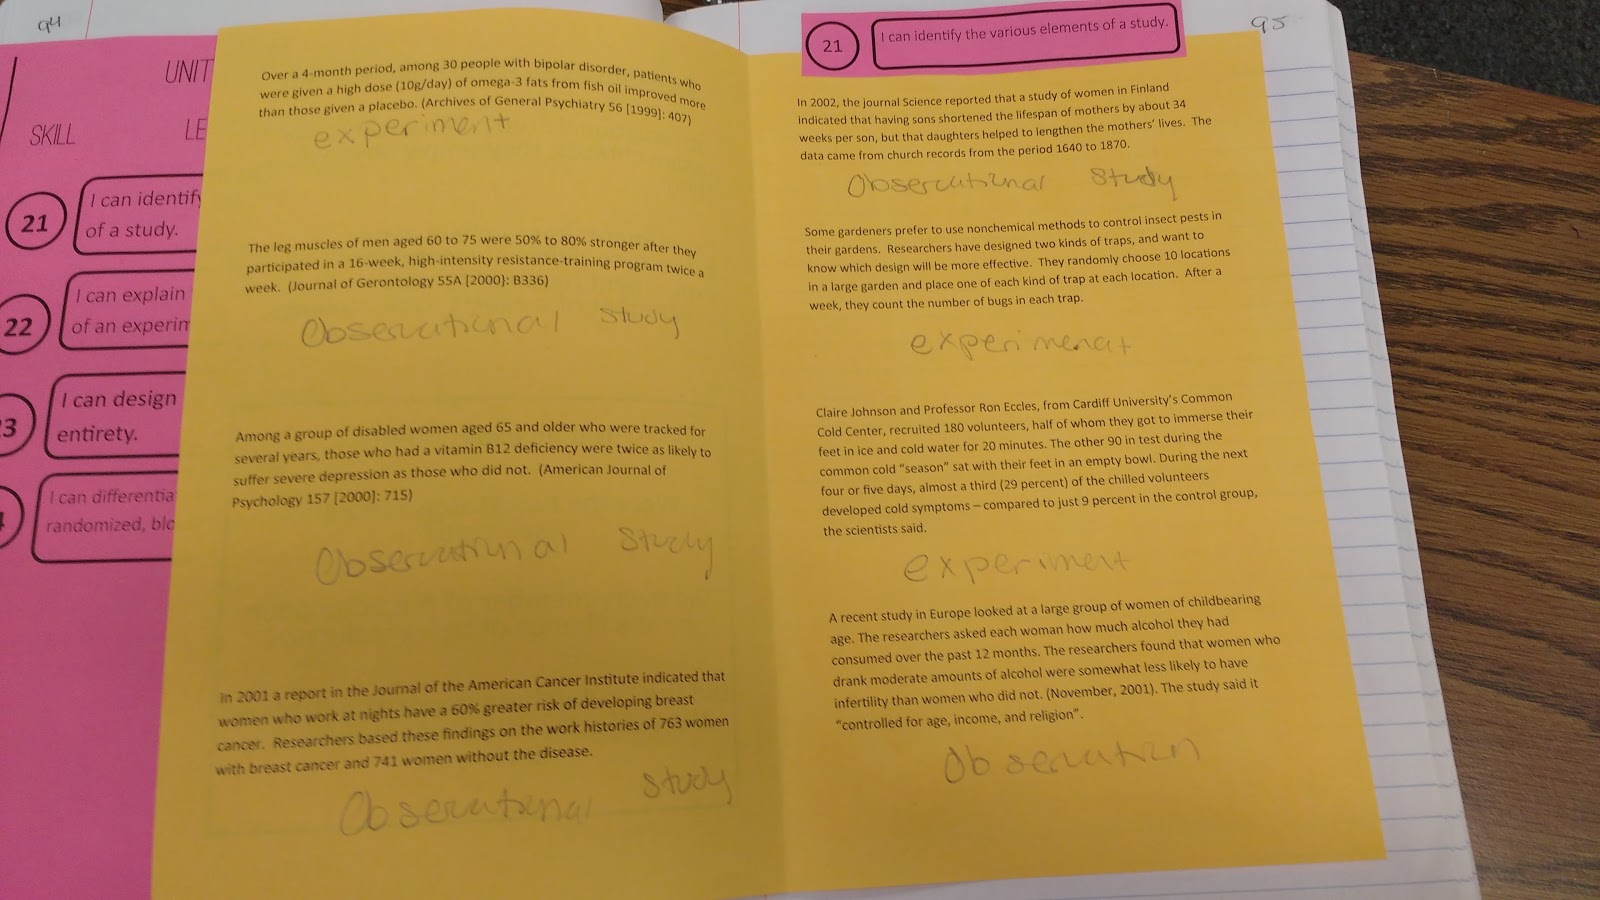
Experiment vs. Observational Study Notes
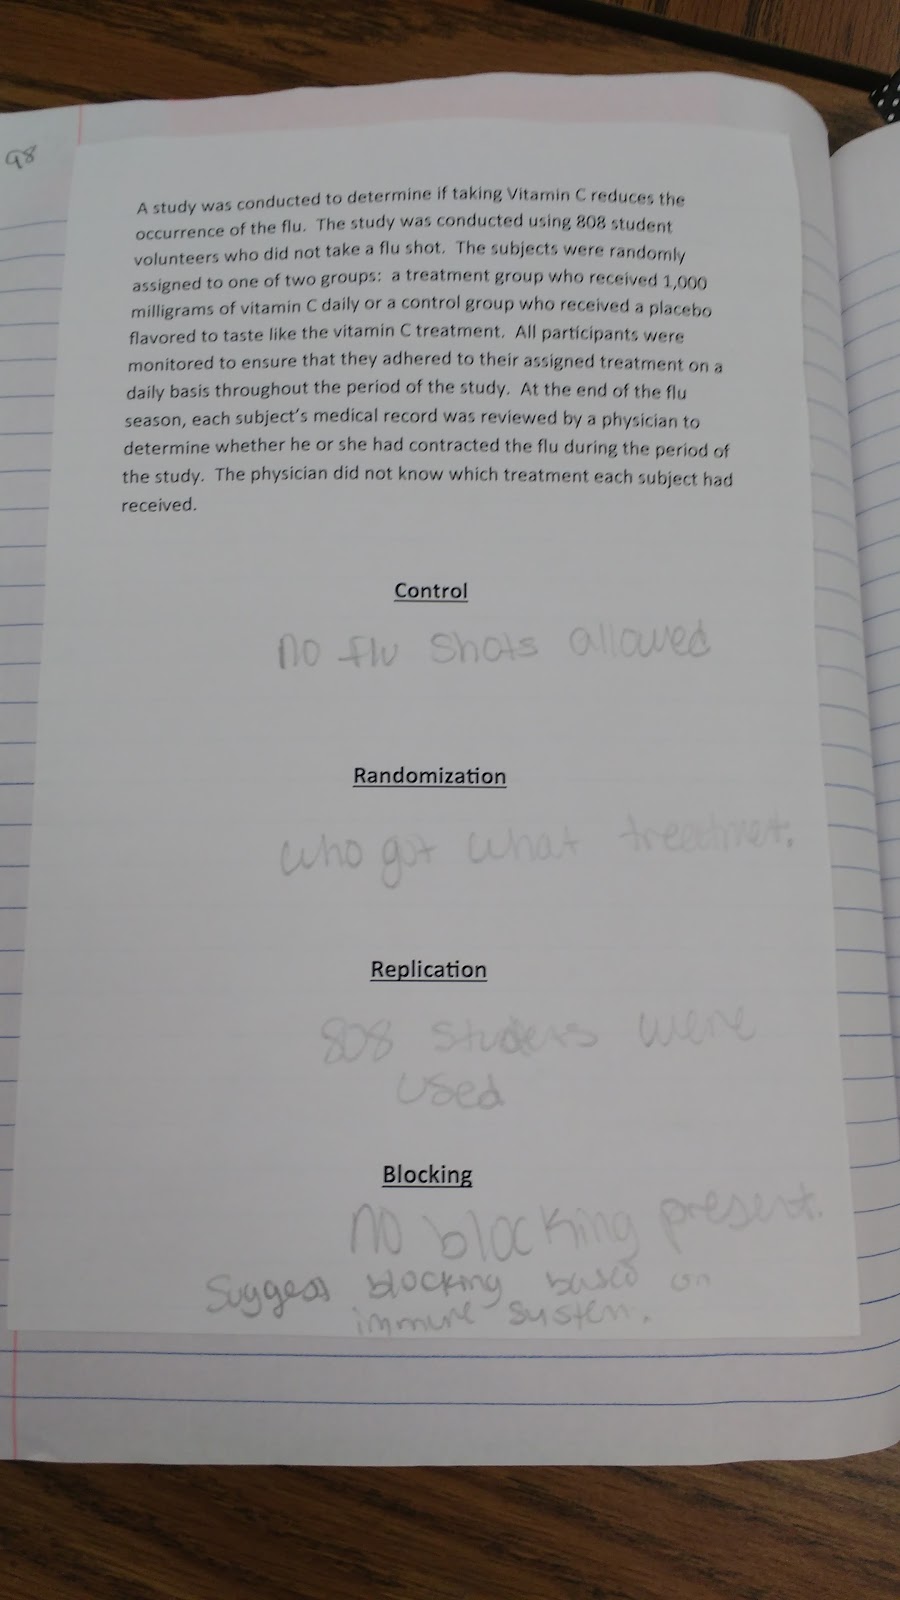
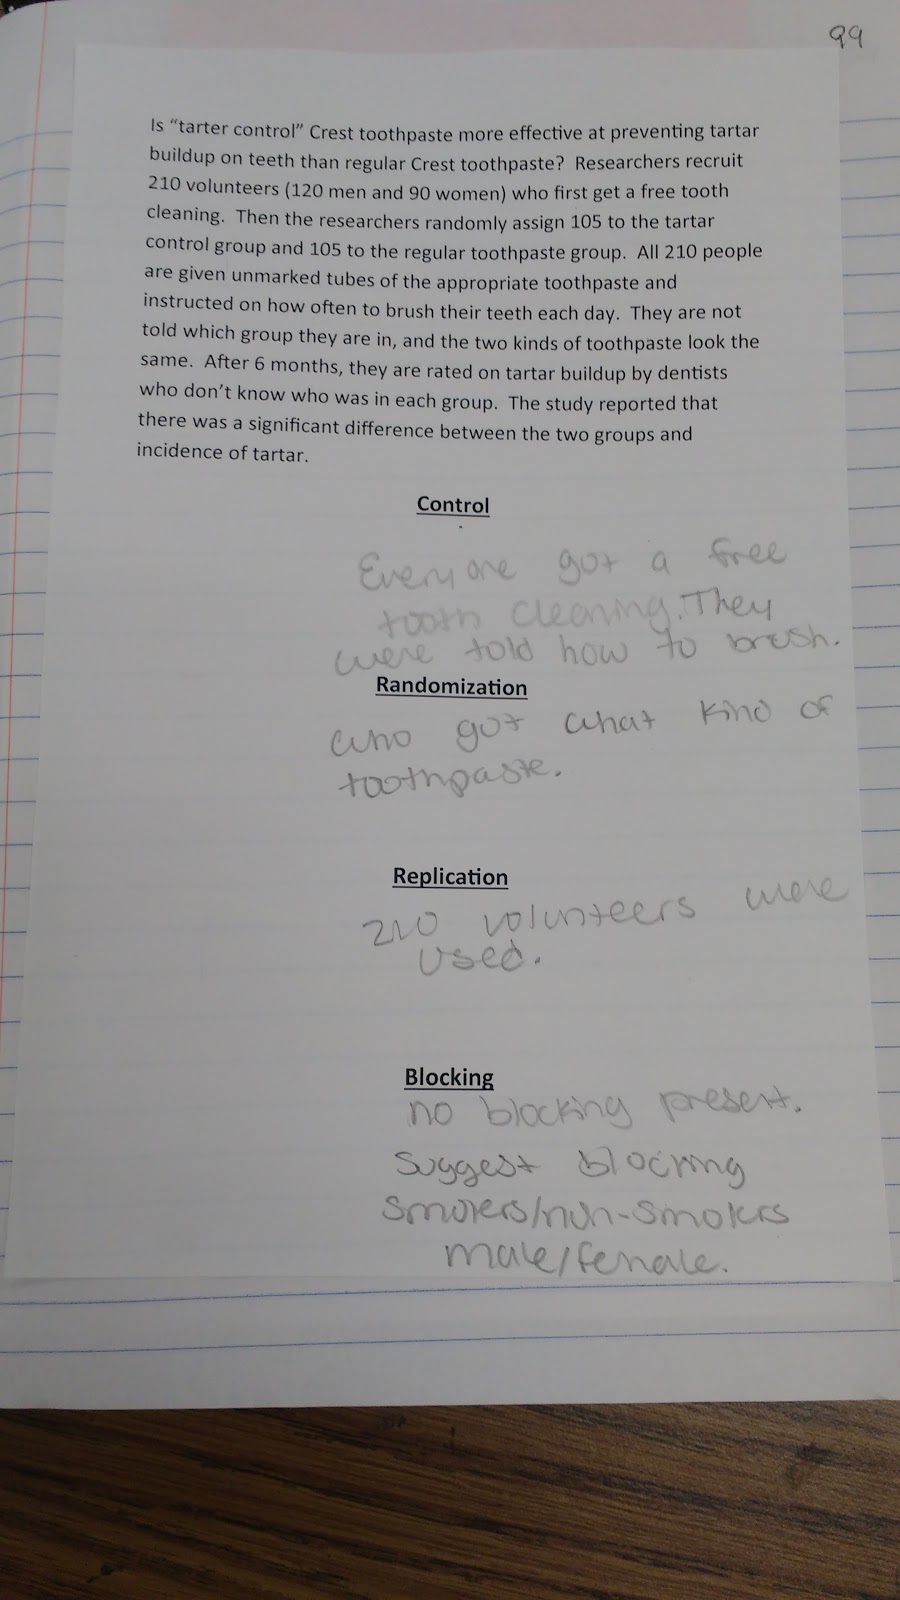
Parts of an Experiment
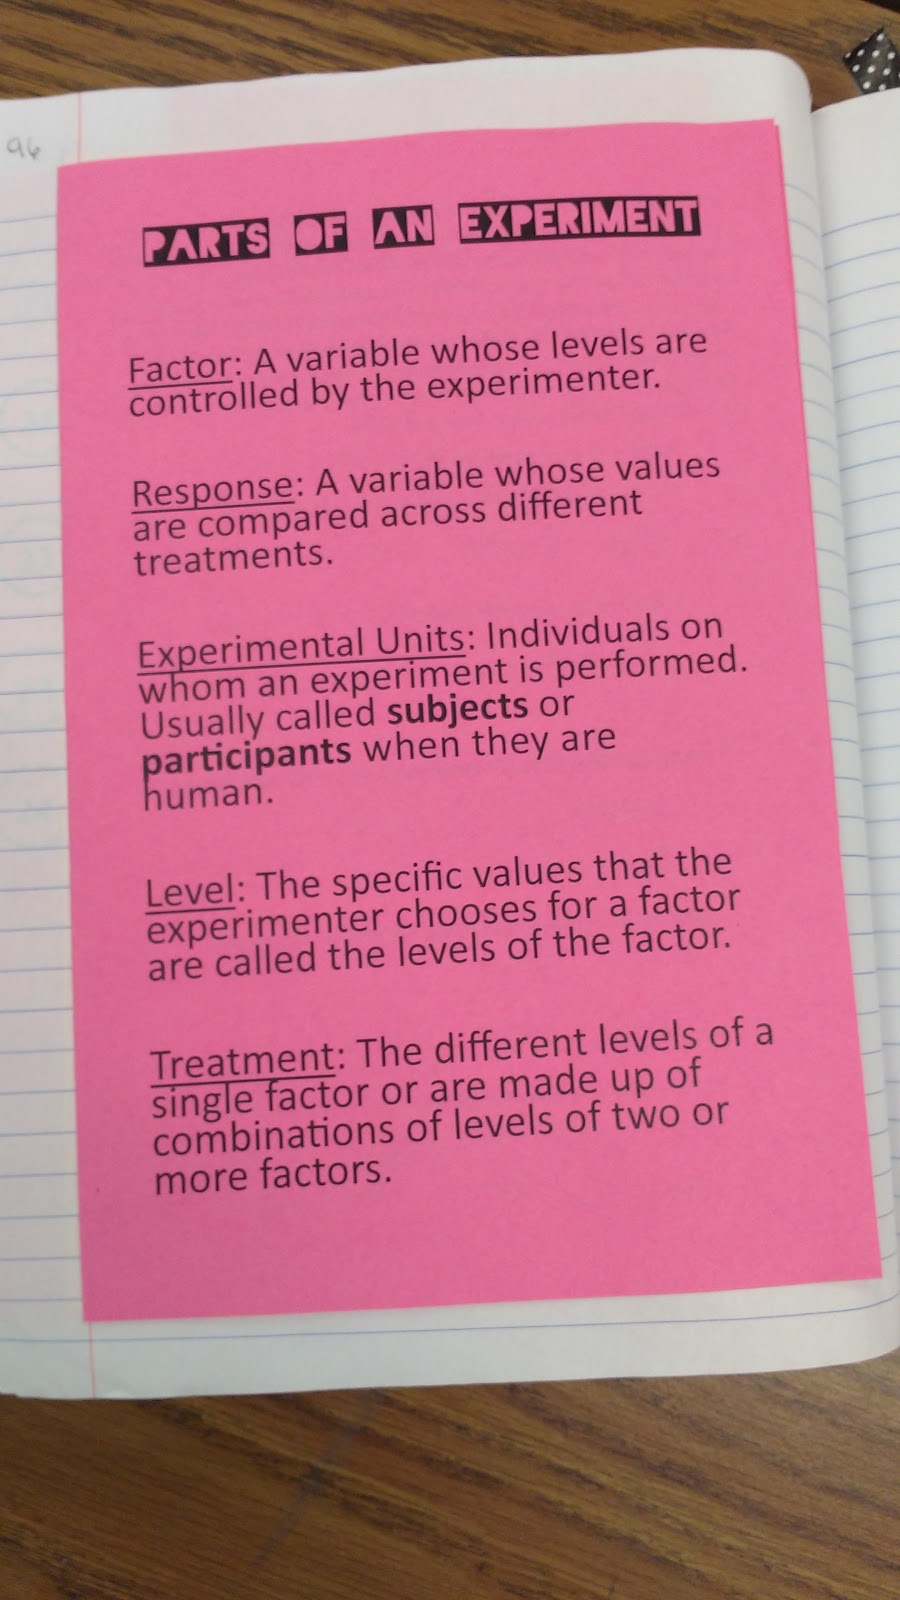
Parts of an Experiment:
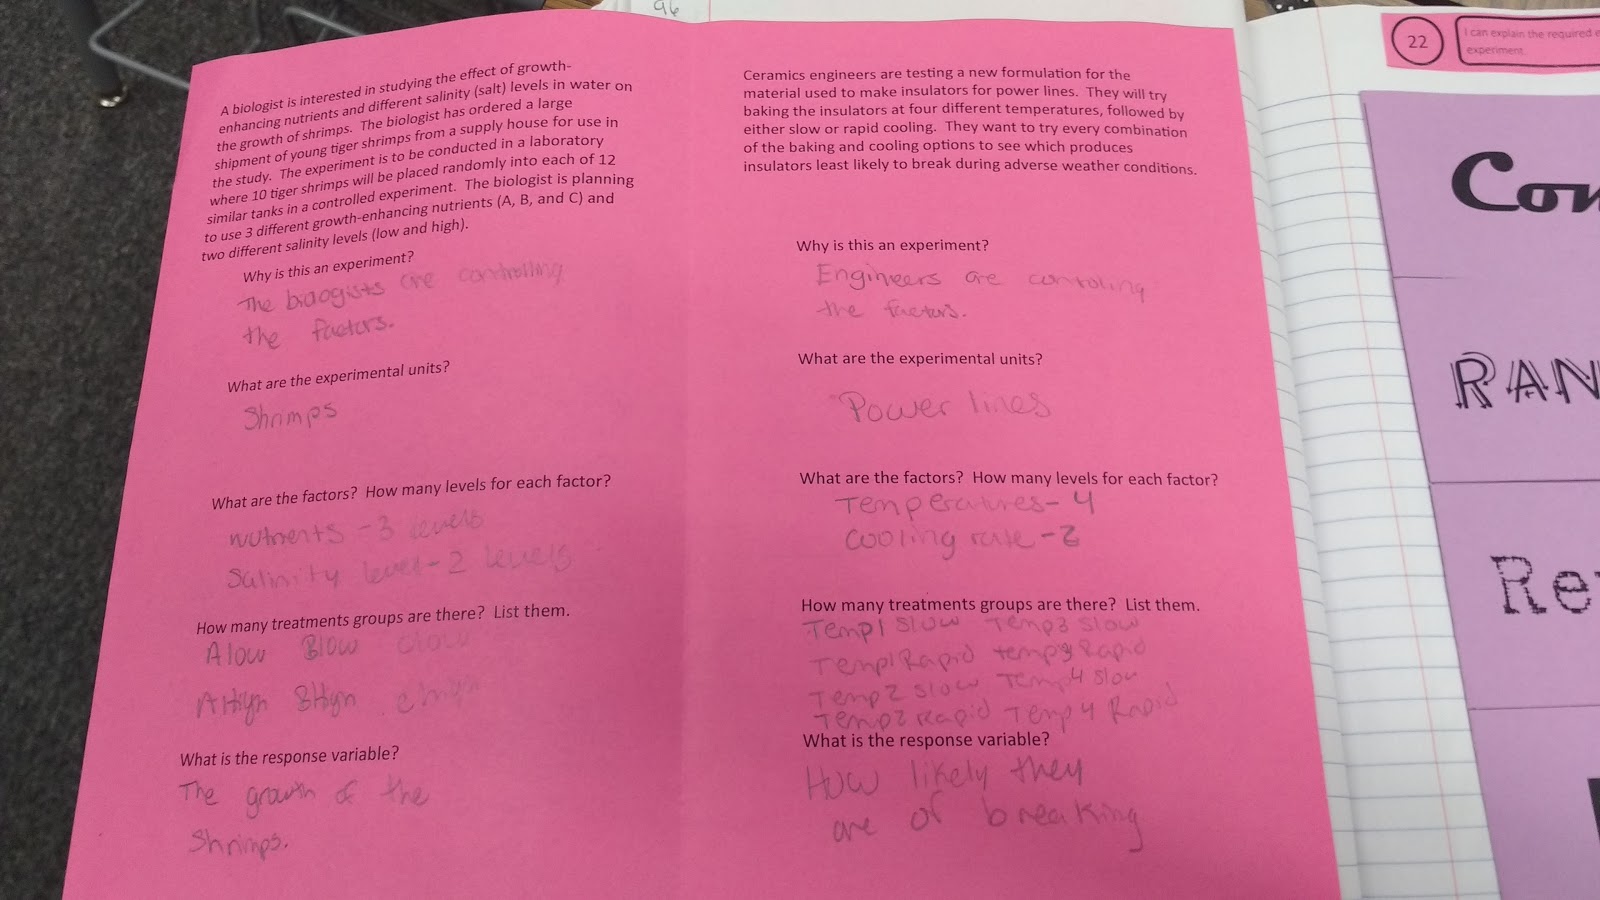
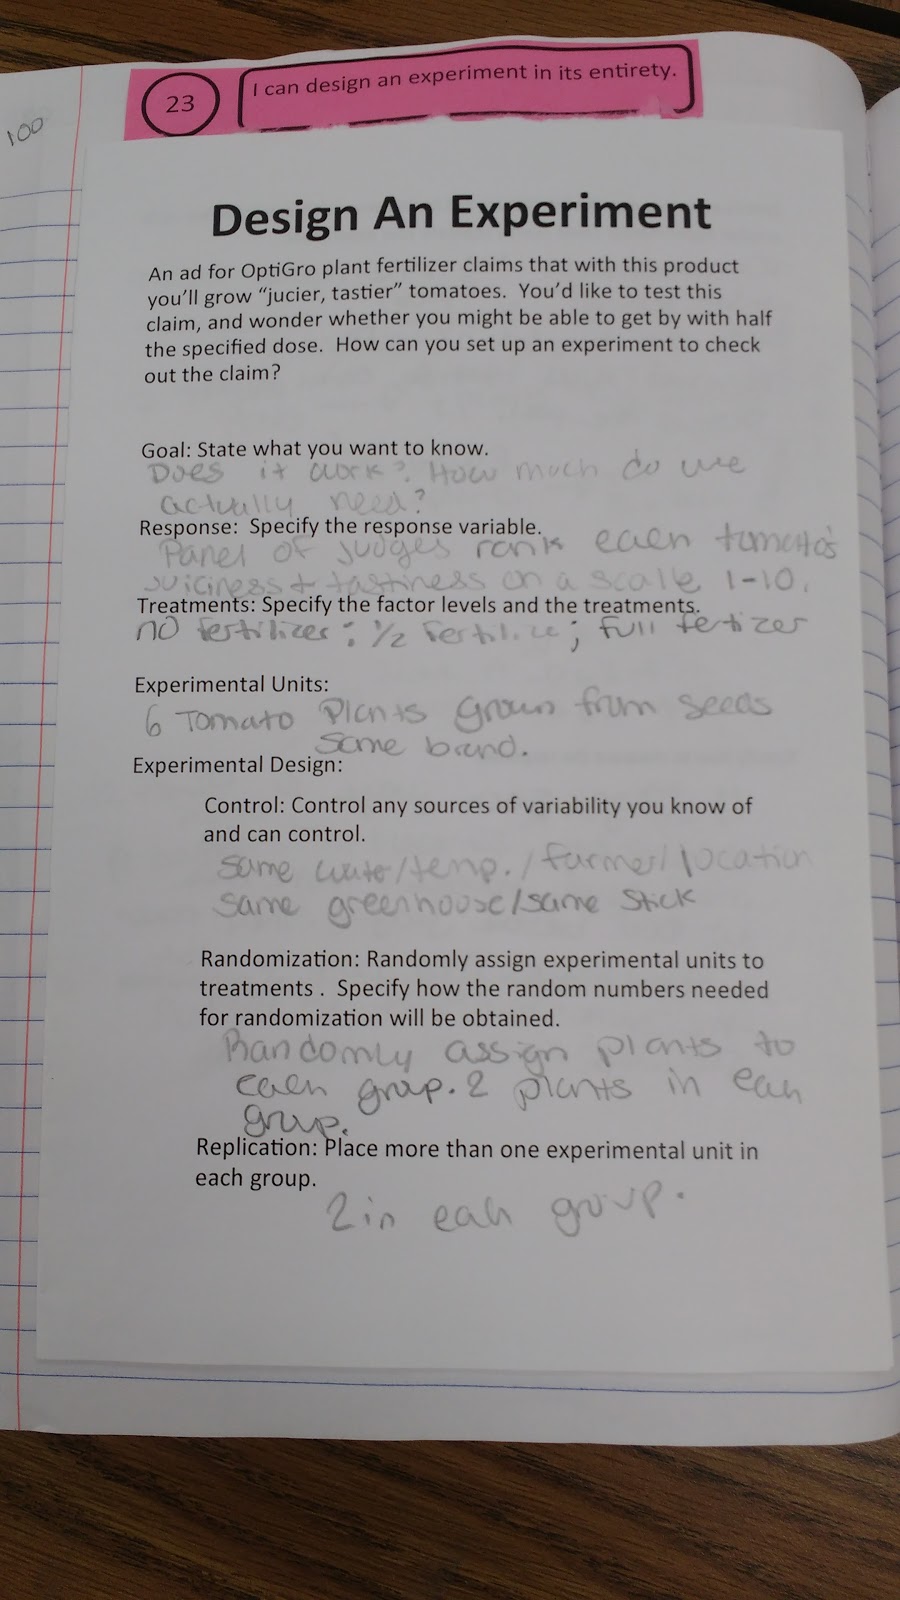
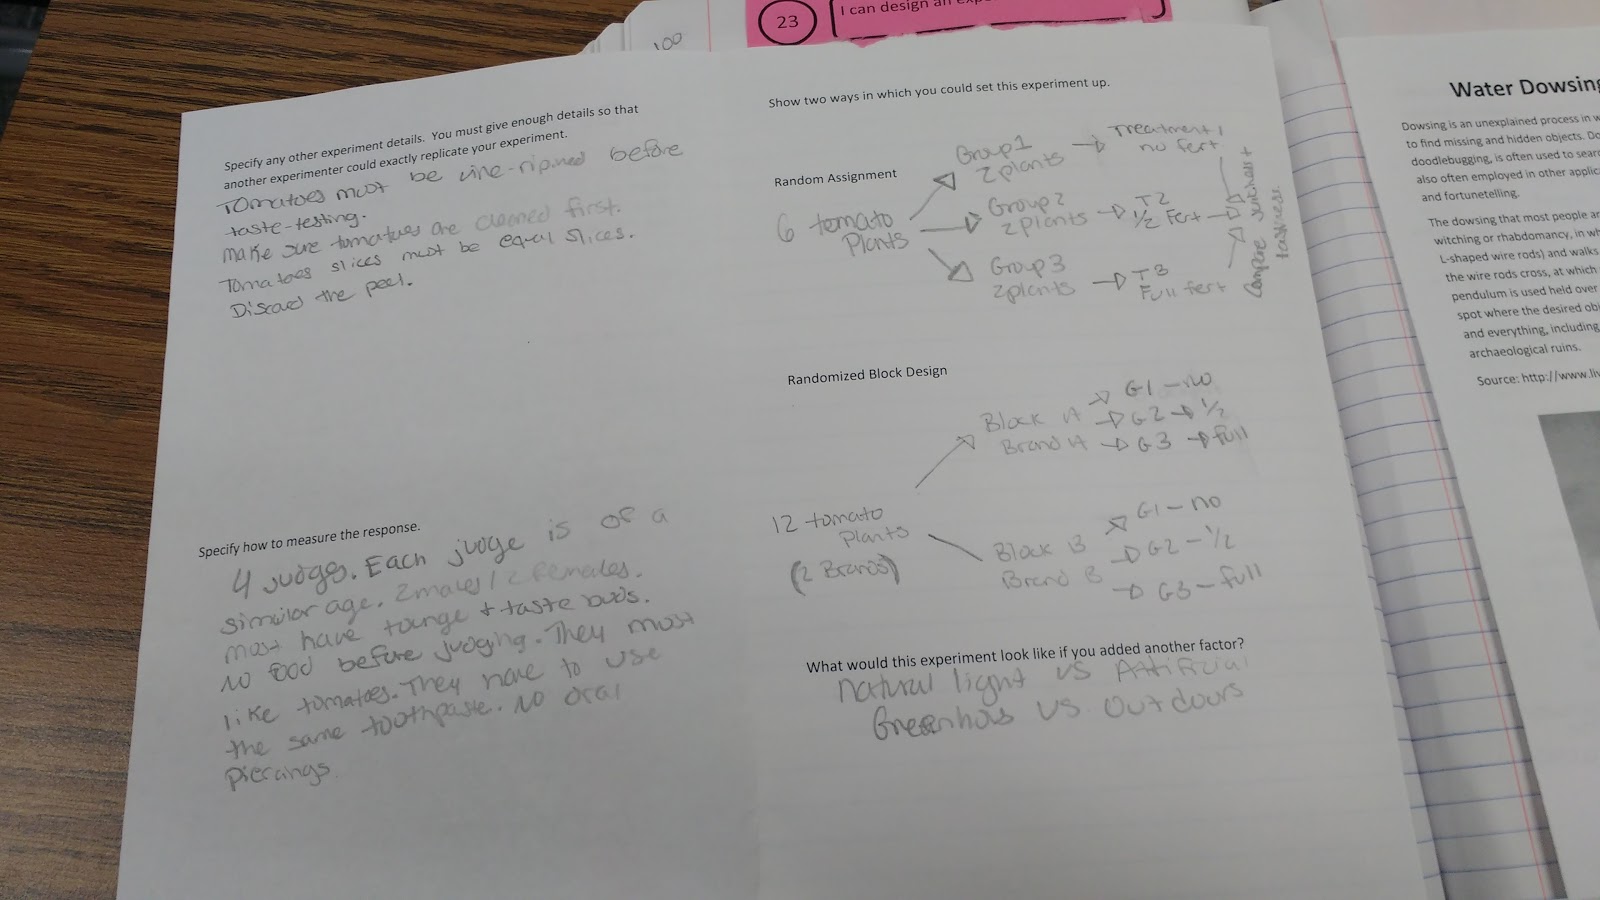
How to Design An Experiment:
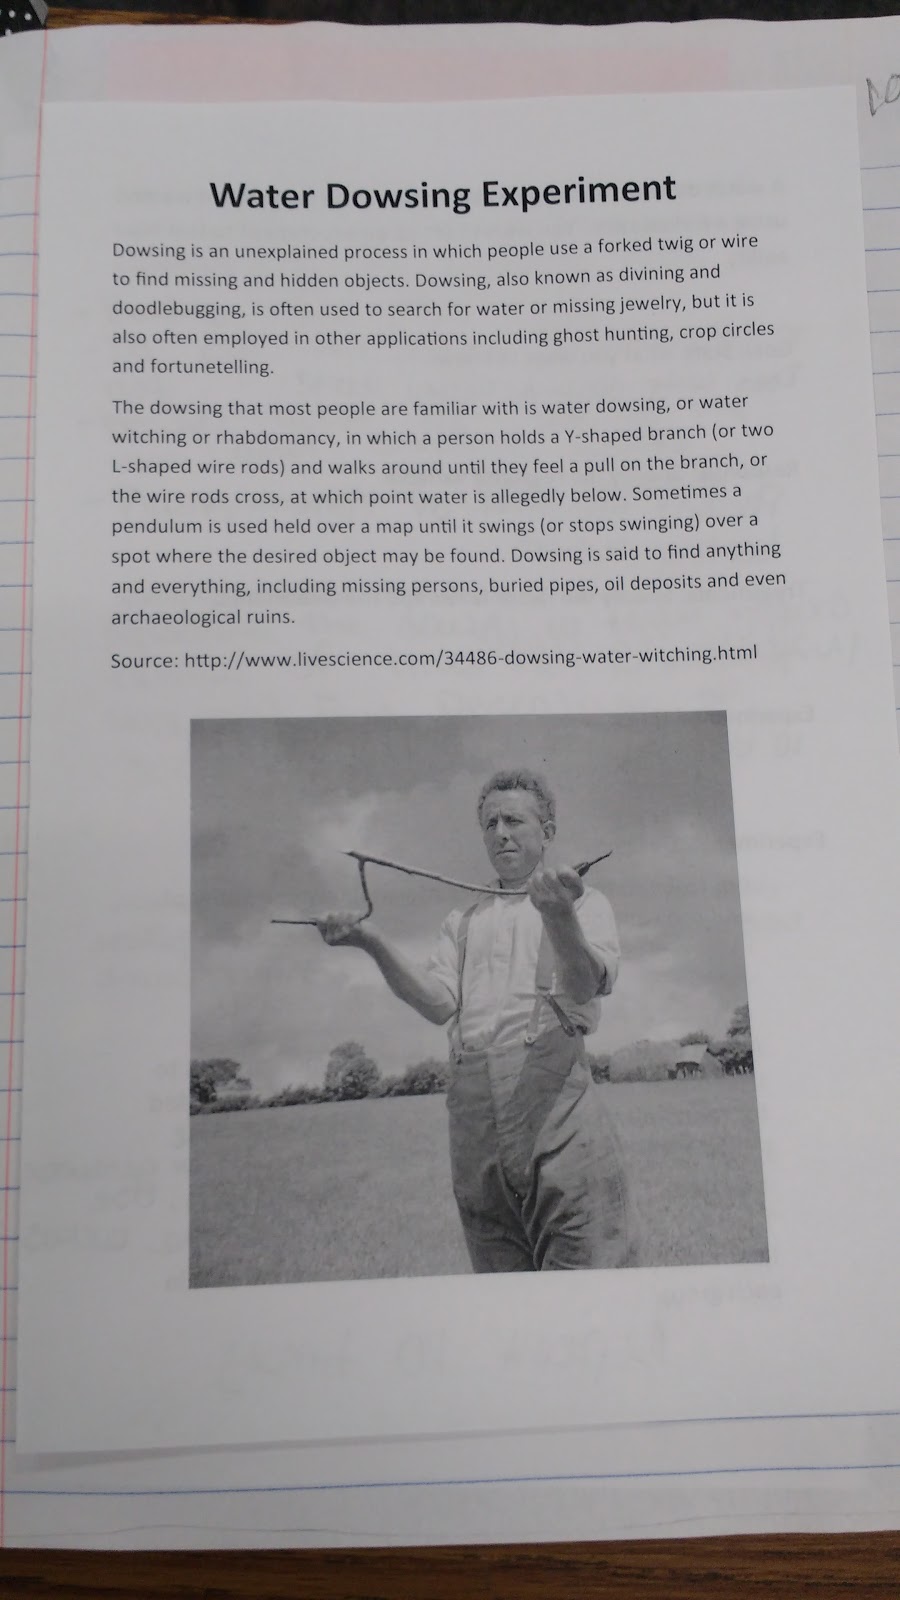
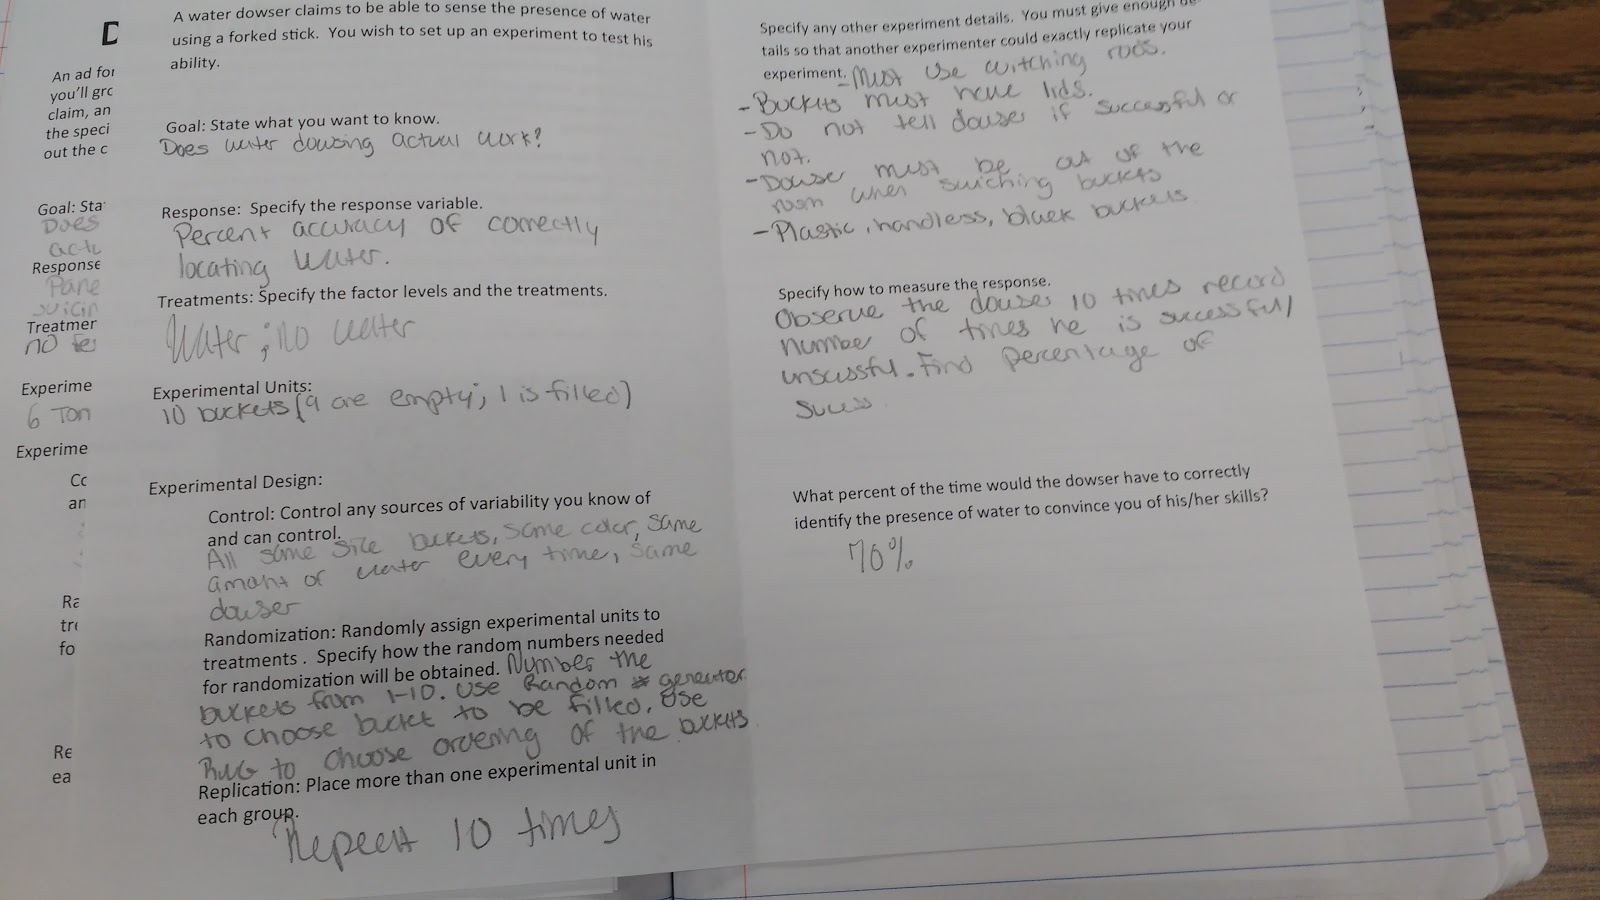
Water Dowsing Experiment:
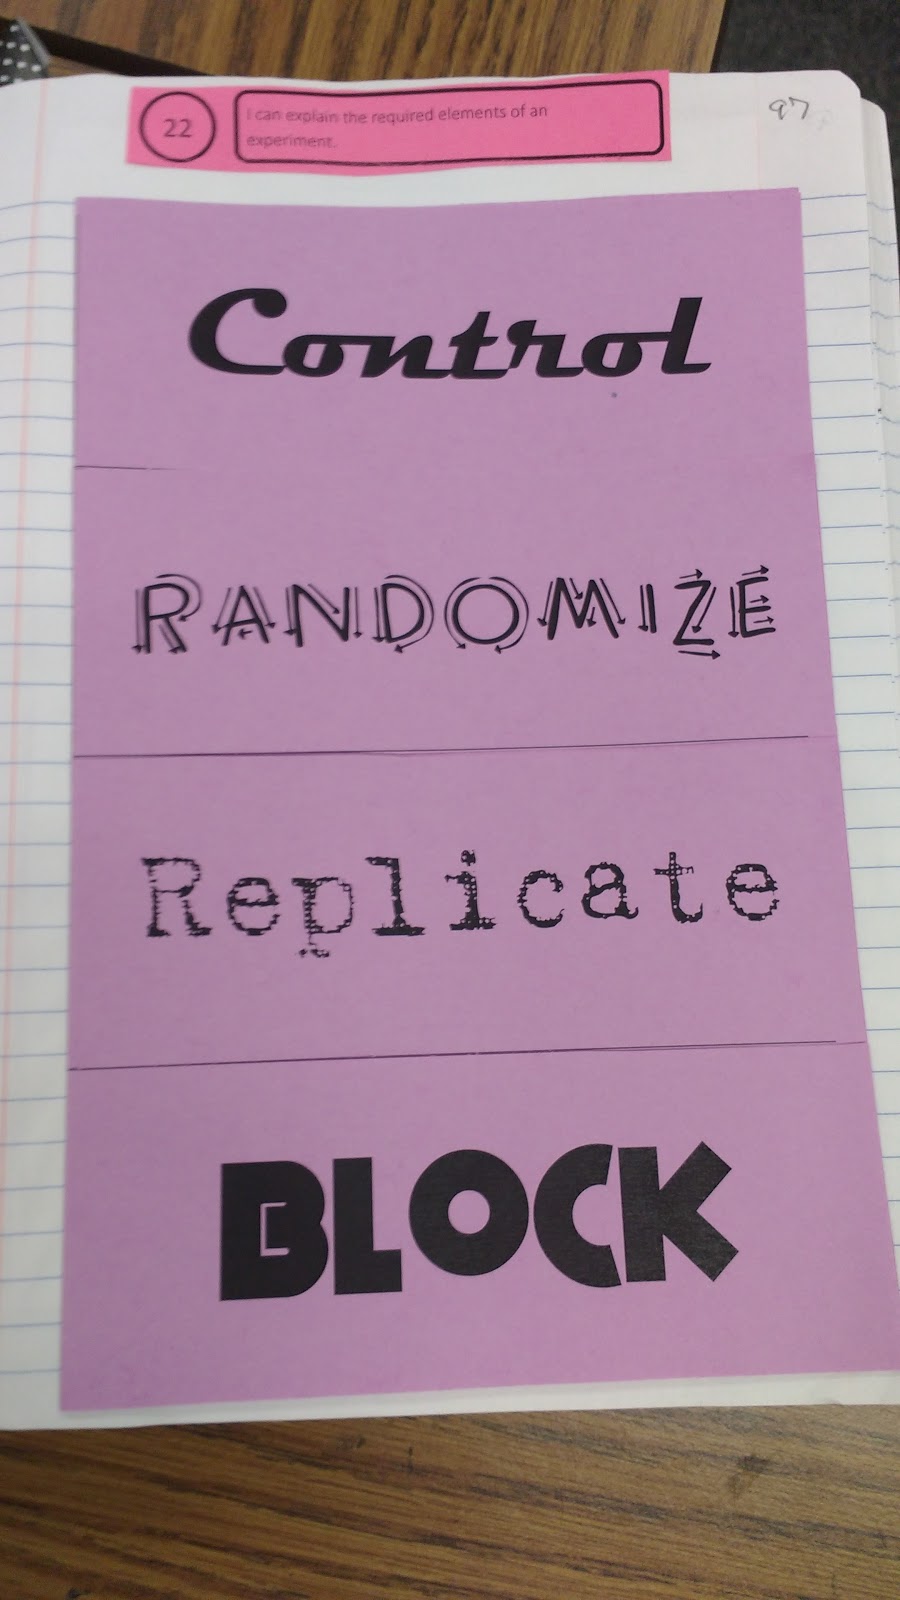
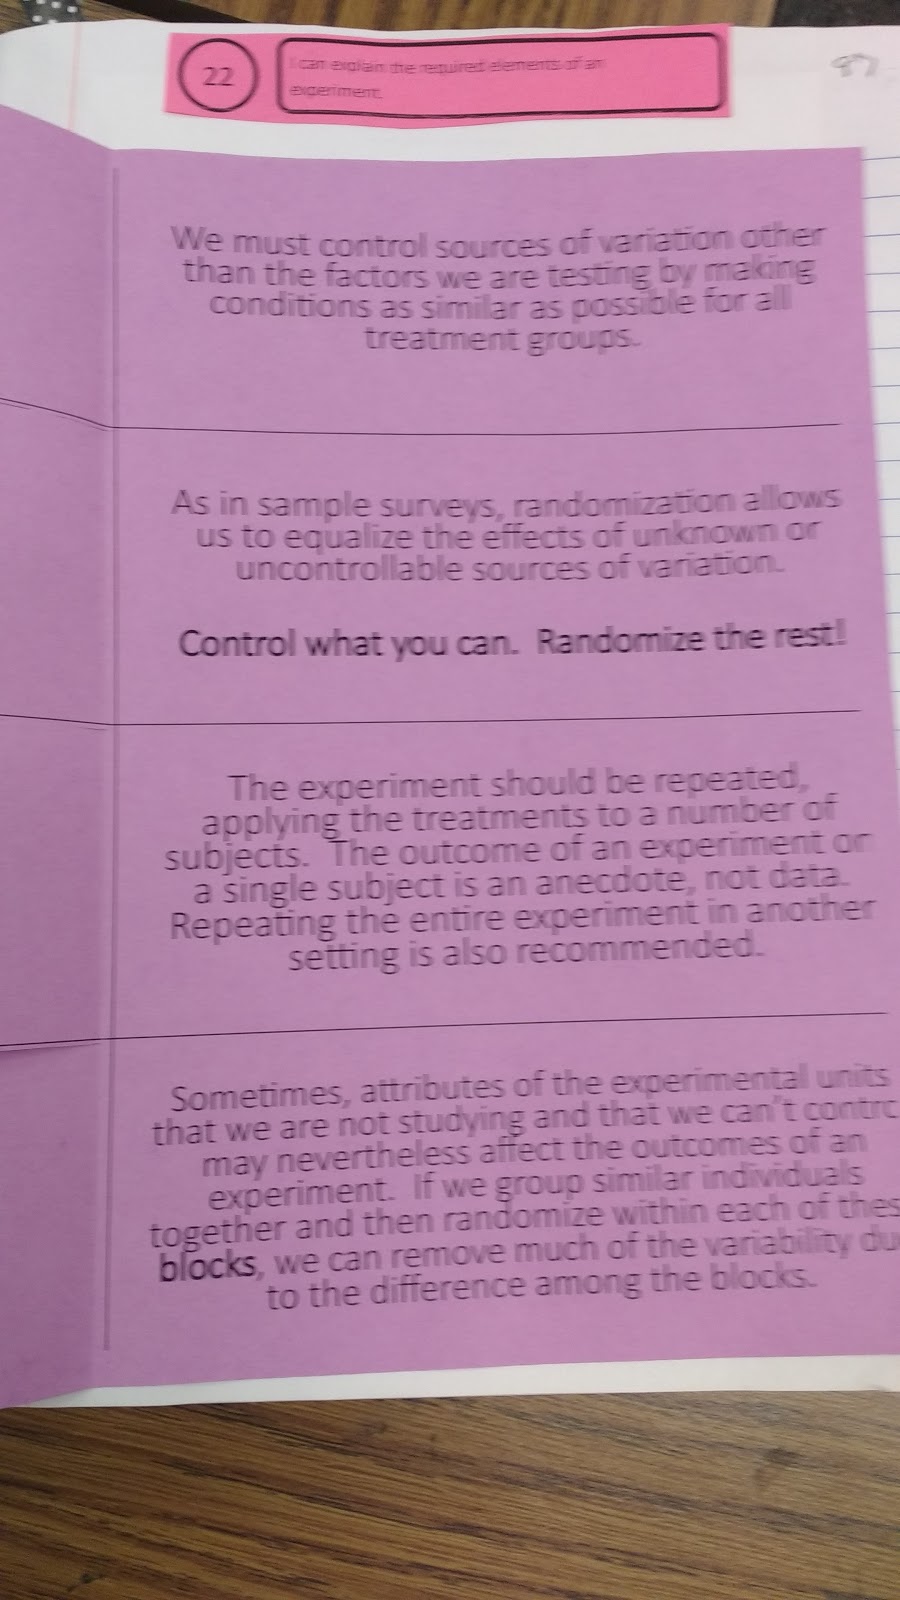
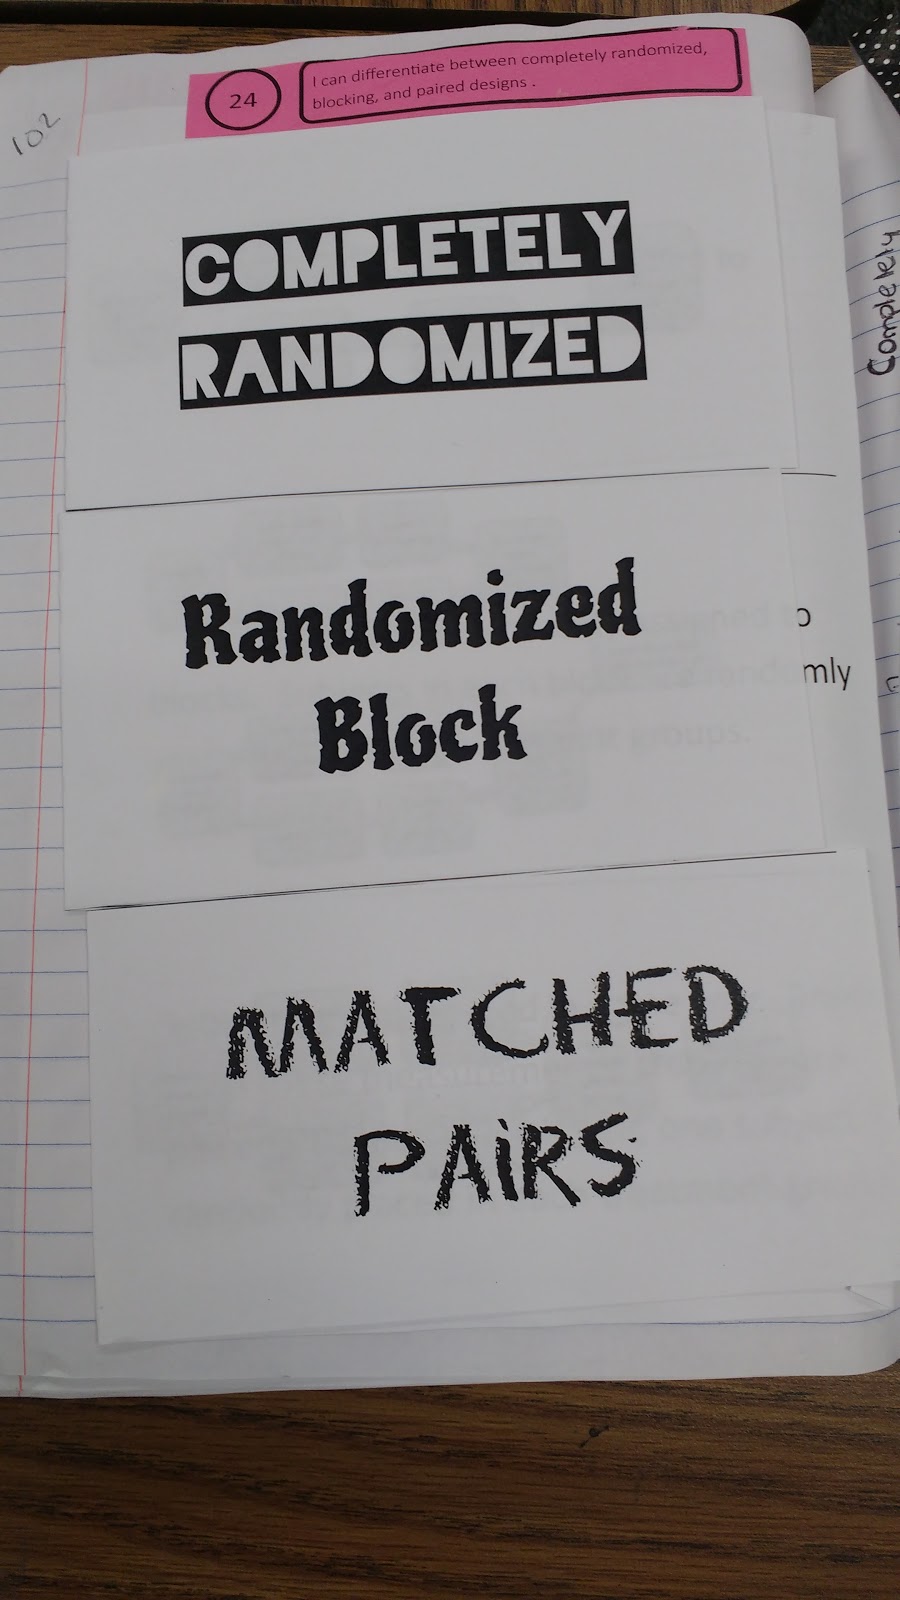
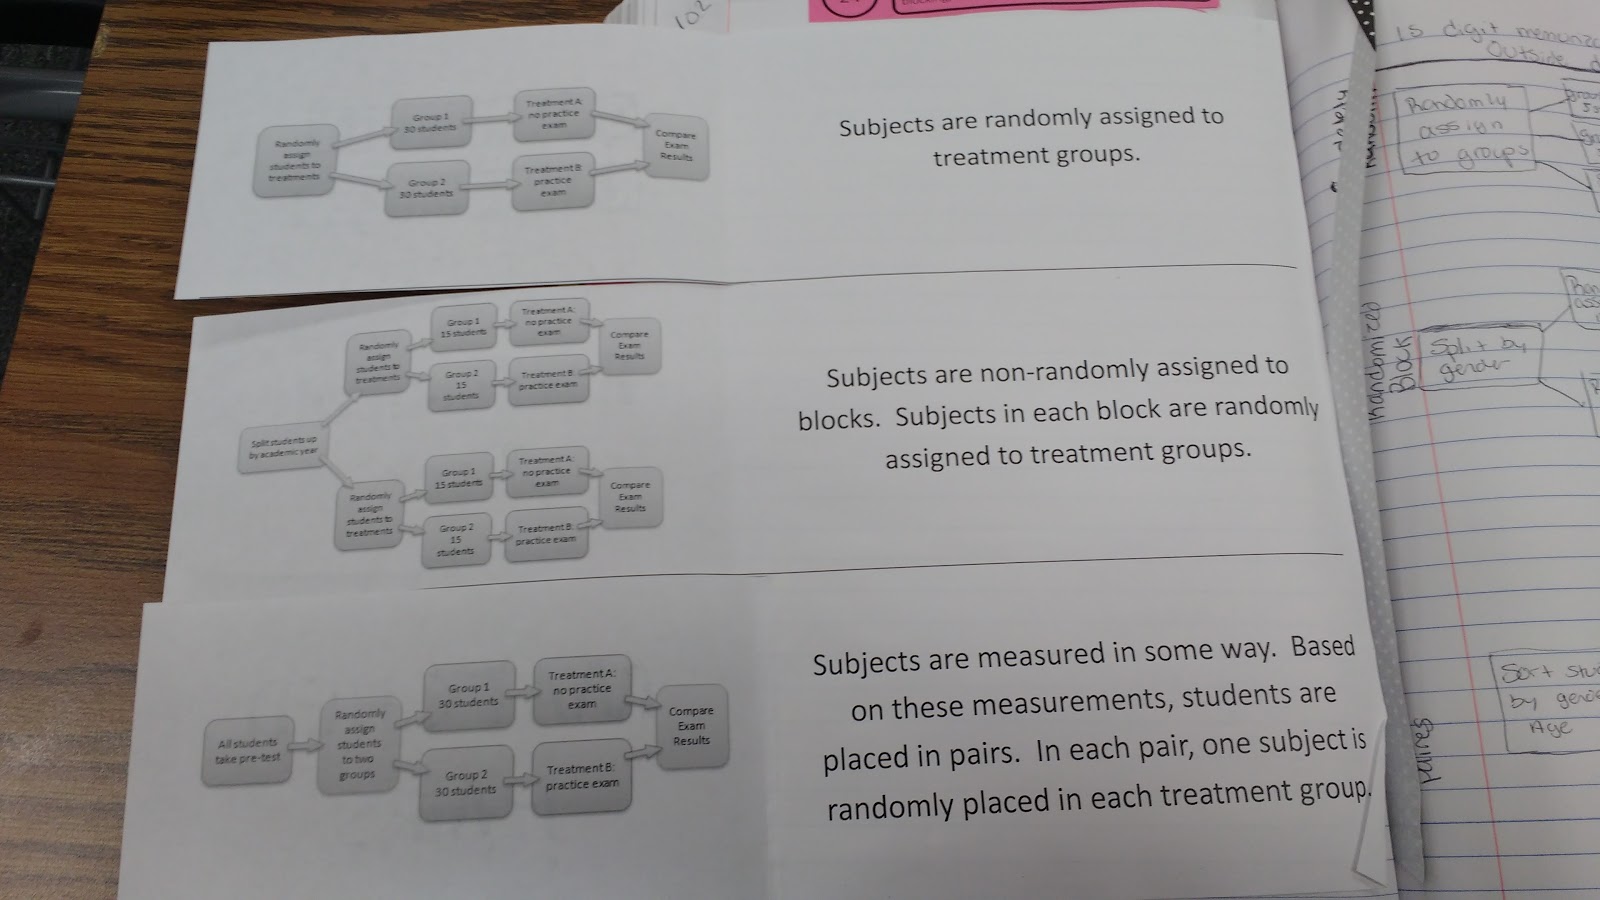
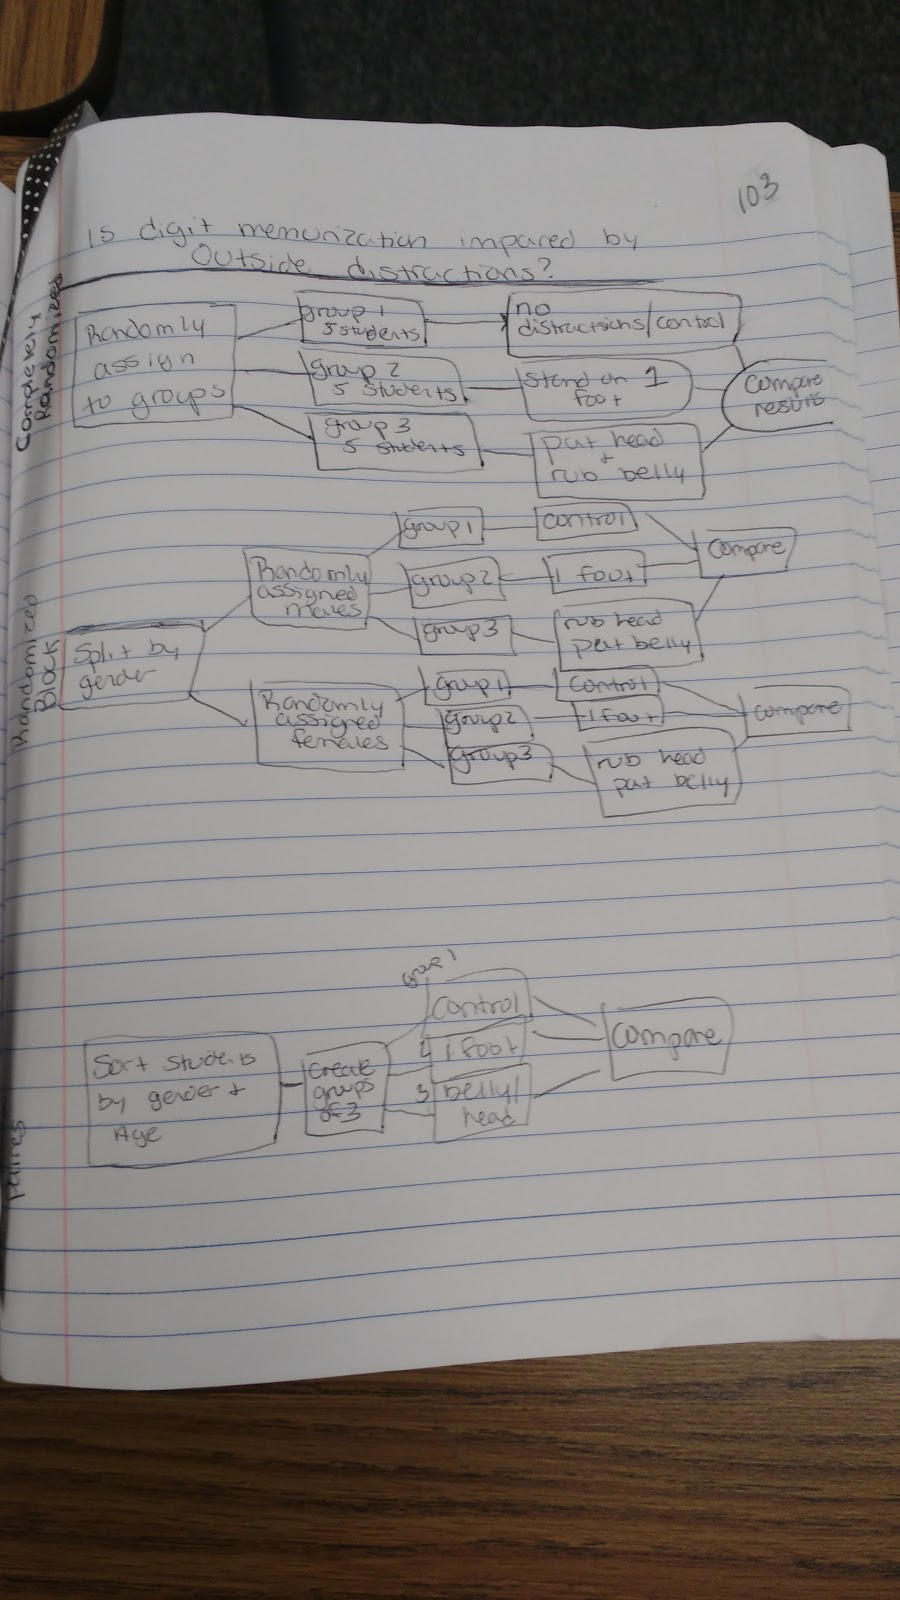
Types of Randomization:
And, that’s a wrap for Statistics 2015-2016. We did a bunch of projects as well, but those were made into posters and presentations. Hope you’ve enjoyed this jaunt through our notebook from last year! Someday, I hope to write blog posts for some more of these pages and post files/more details. If only I had more to just blog!
Hi Sarah, I love your blogs from teaching Algebra 1, Algebra 2, Trig and Statistics. I loved all your resources and they have been very helpful to me since last year was my first year teaching secondary math. This year I'd like to use interactive notebook for my statistics class since I didn't do that last year and I wasted so much time with writing on the whiteboard a lot and had the students copied it down in their notes. Would you mind sharing the link for the Stats INB with me? I really appreciate it! my email is diana.burkhart@osbornwildcats.org
Hi Sarah. I lost track of time reading your blog and admiring all your activities. I teach AP Stats and am hoping to use an Interactive Notebook this year. Would you mind sharing the resources you used? Thanks in advance! amanda71010[at]gmail.com
I love using your resources!!! I teach AP and regular Stats, can you share your resources? nancymariesmith80[at]gmail.com
Hi Sarah,
Im teaching a special education statistics class this year and they are LOVING their interactive notebooks, but I am drowning creating all of the pages – would you be able to share your units with me? emily.farrar@k12.dc.gov – thank you so much, I am a huge fan of your blog and all of your printables!
Hi Sarah,
You have awesome ideas, and I would love it if you would share your units with me. I am teaching "Stats for All" and you have convinced me that an interactive notebook is the way to go. gkgcollins[at]gmail.com
Hello Sarah. I am following you for years and I know you are married and dont find time to post. Do you have your statistics files posted, or would you mind sharing them with me?
kuzu@leibniz-privatschule.de
or
math.mustafa[at]gmail.com
Good morning! I love your enthusiasm for teaching and making sure that math makes sense to your students. In the past, I have done INB … absolutely love them. This is my first year teaching Statistics and would like to use them for this course. I appreciate all that you do.