Graphs In The News Statistics Foldable
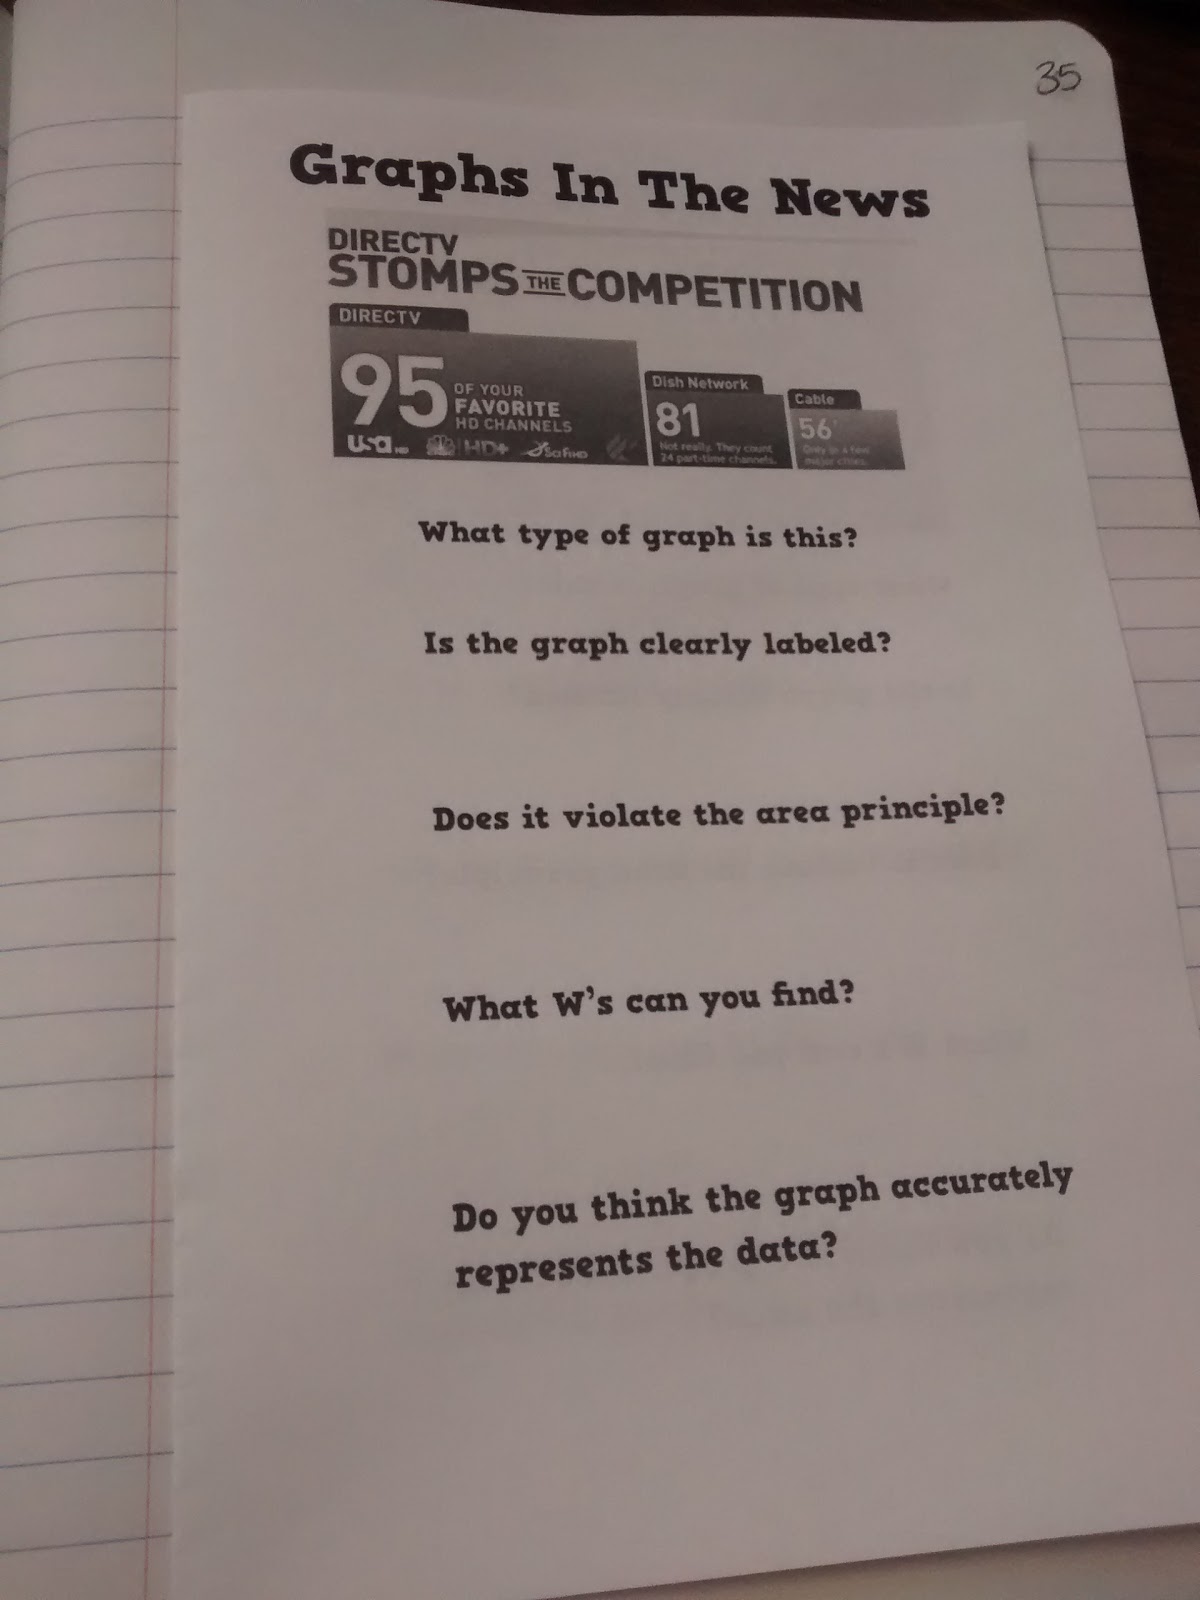
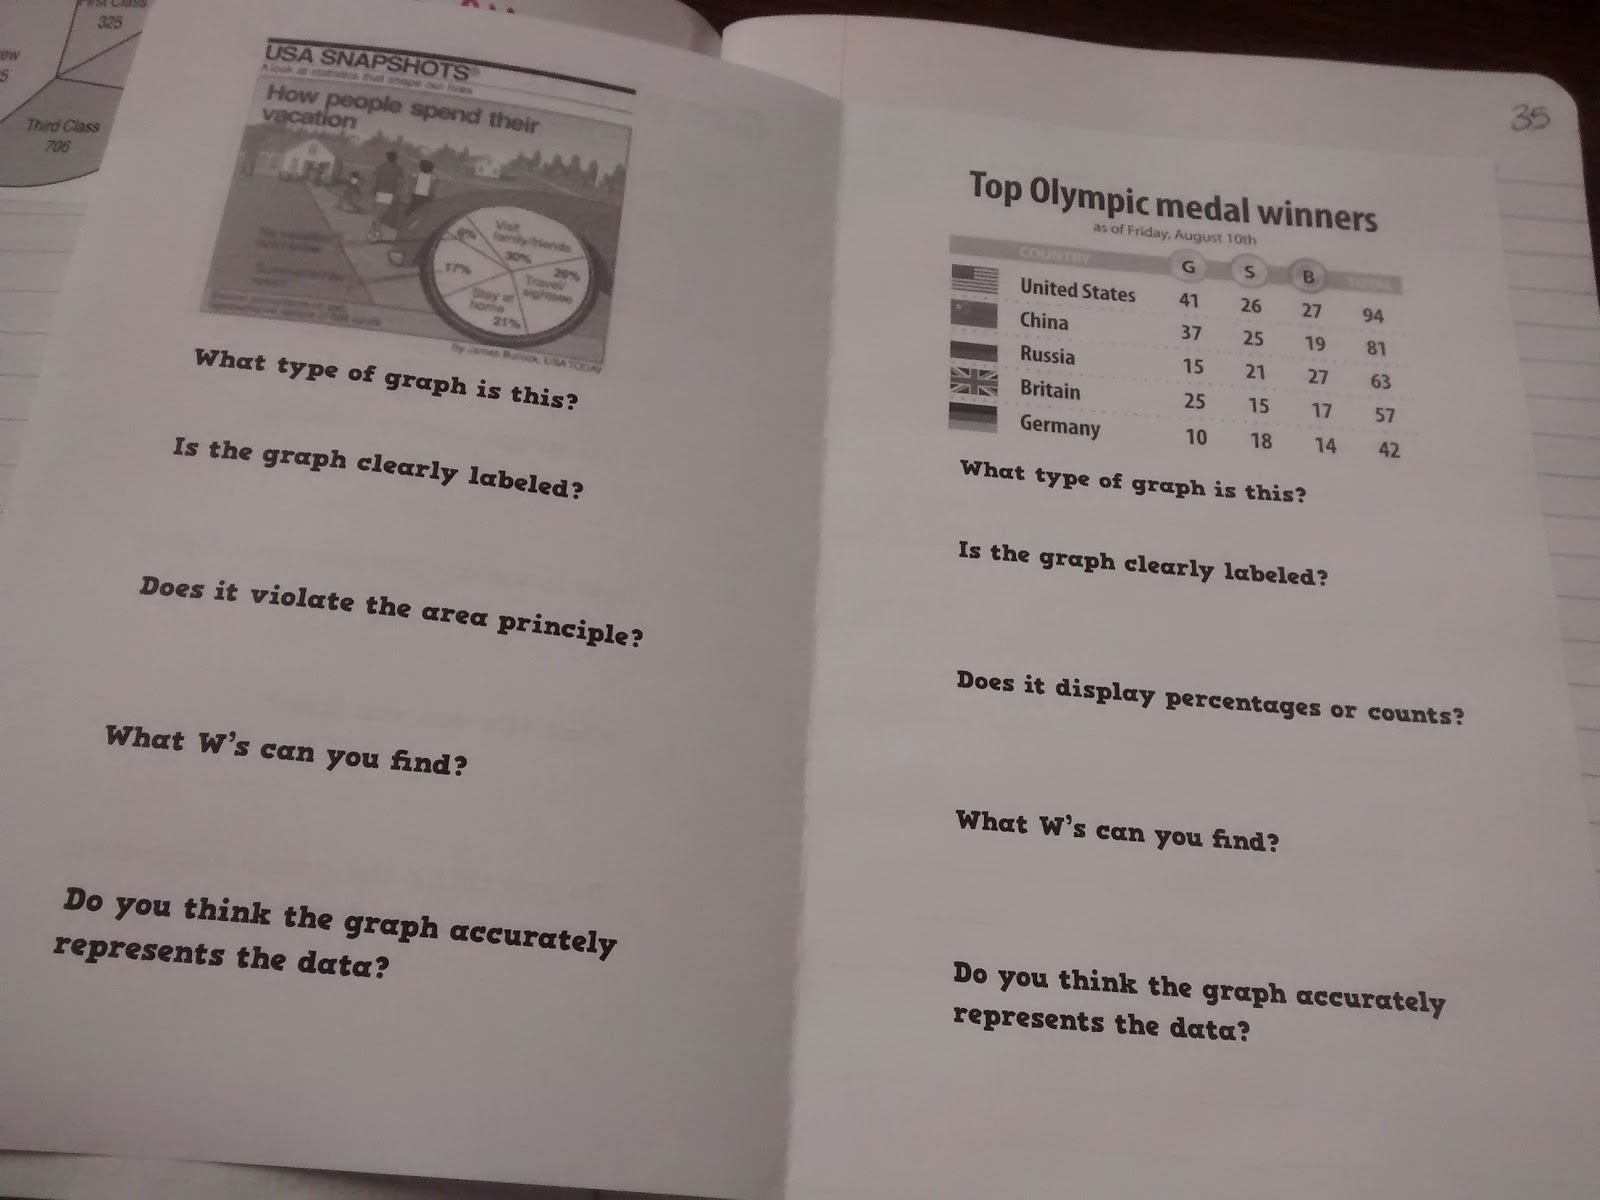
I made this Graphs in the News Statistics Foldable to give my stat students practice analyzing graphs of categorical data. I pulled some real-life data displays from the internet.

Then, I had students discuss these questions together as a group. I loved hearing my students reason through these!
I took the question prompts from Stats: Modeling the World. The original assignment was to find an example of each graph on their own and answer the questions.
I decided to just go ahead and pick out some graphs for them to use.
They thought it was cool to be able to find flaws in graphs created by real-life professionals.
I love this. This is great. I'm starting to realize that the best teacher resources are resources that teachers create themselves. I think it's awesome that you brought real-life data into the classroom and had students interact with it.
KUDOS to you!
Thanks Nateil! I've learned so much from the MTBoS myself!