Notes for Introducing Z-Scores
My statistics students are moving into z-scores. Z-scores are the sort of thing that sound terrifying, but they aren’t really that bad if you understand what the number actually means. While trying to figure out how to introduce the topic, I asked my fiance for advice.

Shaun suggested that I have students find z-scores based on the definition of a z-score before introducing them to the formula. Of course, he also informed me that they were pronounced as “zed-scores”.
That idea led to this handout:
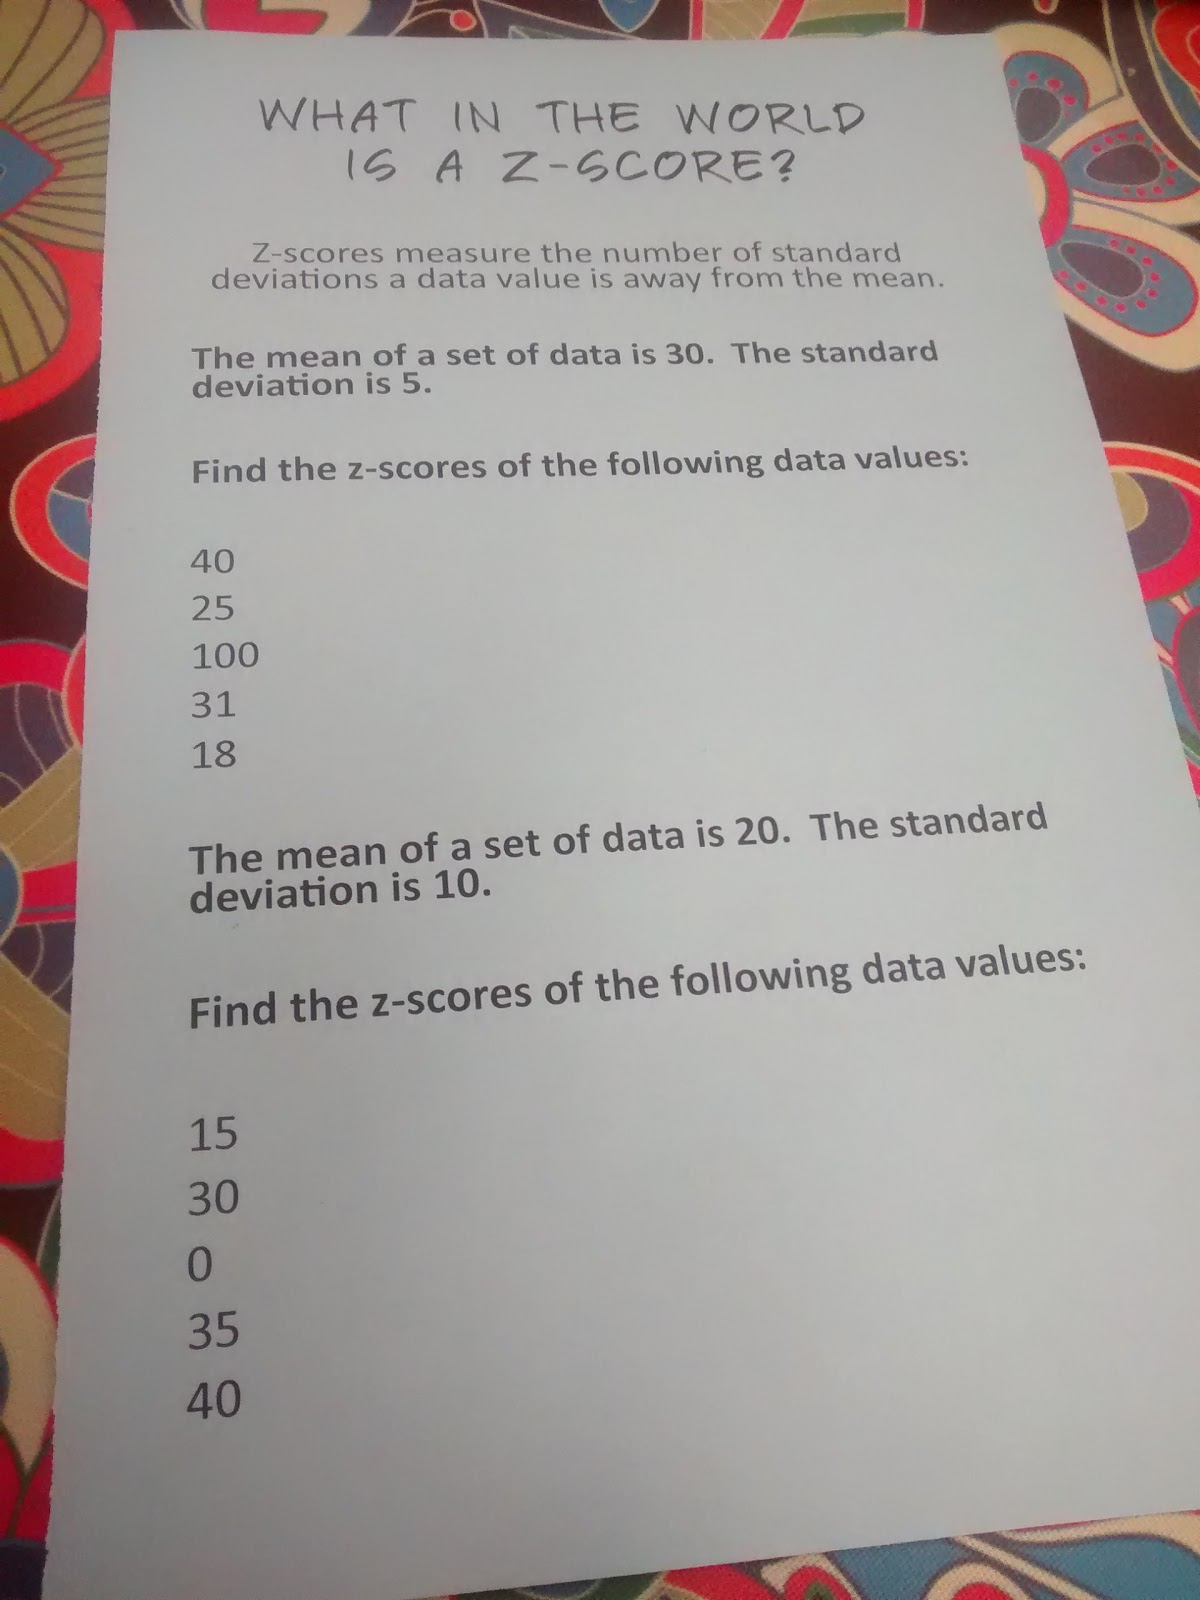
I read the definition of z-score to them and set them loose to work through the two problems in their groups. I did instruct them that values above the mean would have a positive z-score and values below the mean would have a negative z-score.
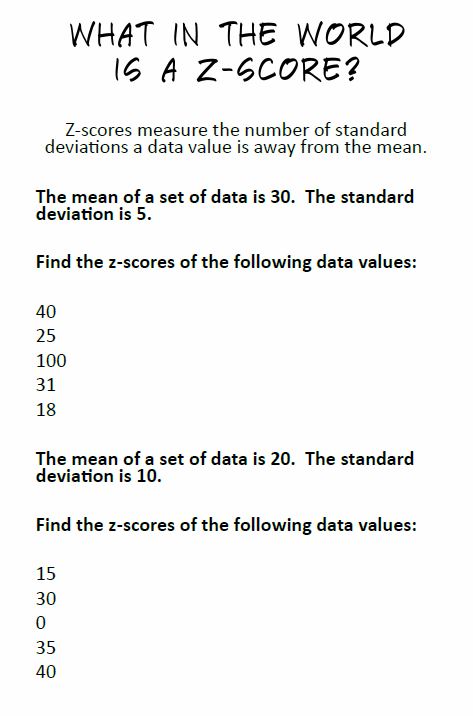
I expected them to struggle with finding the z-scores that ended up being decimals, but soon I heard groups throwing out decimals and fractions on their own.
After going through each answer, I decided to pose a few scenarios to see how they were understanding z-scores.
Imagine your teacher gave you back your test and instead of writing your score, they wrote your z-score. What type of z-score would you want to see?
What would a positive z-score mean? What would a negative z-score mean? What would a z-score of zero mean?
What if we measured everyone in class and assigned everyone a z-score based on their height? What type of z-score would you prefer? What would the worst possible z-score be? What would that look like?
I was amazed by the discussions that happened as a result of posing these scenarios. Only after I made sure they had a conceptual understanding did I pass out a formula sheet for my students to glue in their notebooks.
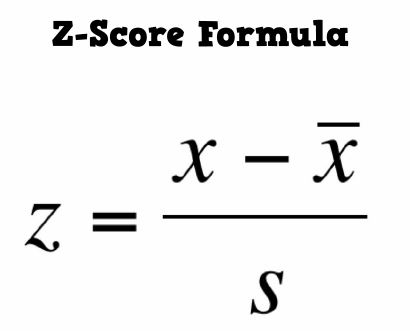
Next, I told them we were going to find out their z-scores for various things. We took a vote on three pieces of data we could collect. I quickly vetoed the idea of collecting data on how many people they had kissed. Teenagers…
We ended up with these three questions:
1) How many letters are in your first name?
2) How many sports do you play?
3) How many years have you attended school in Drumright?
The students wrote their answers on the SMART Board, and they calculated the mean and standard deviation for the class using their TI-84. Then, they found their z-score and wrote a sentence describing what their z-score meant.
I think I need to do this more often. I’m usually so quick to jumping to give my kids the formula that they just learn how to use the formula and never really grasp what the number we find means.
Free Download of Z-Score Notes
Z-Score Notes (PDF) (1016 downloads )
Z-Score Notes (Editable Publisher File ZIP) (822 downloads )




Hi Sarah. Your Fiance is pretty smart for an Aussie (us Kiwis can say that). This is a great resource that will greatly improve students' understanding of the z values. All of my students have graphics calculators so z-values have been an after thought – until a question turned up in the exam last year. Thank you for sharing so openly.
Thanks for reading my blog, Rochelle!
This is my favorite way to introduce new content. Either create a need for what the topic can deliver, or at least define a new object and then find lots of examples and debrief with the class. Great activity! Thanks for sharing.
I think the debriefing step is the one I skip most often. It's something I definitely need to work on as a teacher.
Yes! Z-scores prove an issue for my stats students, as well. One thing that has helped is making my students practice interpreting z-scores as the number of standard deviations above or below the mean. It really reinforces what the standard deviation is (although if they struggled with that it could make z-scores feel more difficult). It really comes in handy when we get to inference topics to have that practice. I am going to be spiraling back to z-scores in each unit, as well.
As both a student and future educator, I absolutely loved your post. I thought it was extremely interesting to see how you introduced z-scores to your students. By being able to interpret the meaning of z-scores, your students were able to get a better grasp on the concept. Then, the application of real world situations made it easier to understand. Great activity! I hope in the future, I can create a similar learning environment for my students by applying the ideas you discussed above. Thank you!
Thanks Katelyn!
Do you have the downloads posted for the pages you have after this z-score introduction, such as the normal model notes, the table and the z-score & normal distribution practice pages? they are all really good!