Starburst Scatterplot Activity
This blog post contains Amazon affiliate links. As an Amazon Associate, I earn a small commission from qualifying purchases.
This starburst scatterplot activity ended up being one of my favorite activities of the year!
This year, I switched up the order a bit in Algebra 1 and moved creating scatter plots and lines of best fit from our Data Analysis Unit (end of the year) to our Linear Graphs and Inequalities Unit (half way through the year). I have mixed feelings about this. I think that placing this skill in the unit on linear graphs shows my students a real-world application of linear graphs. It also gave my students much-needed extra practice with point-slope form. Last year, I felt like revisiting linear graphs at the end of the year helped tie what we were doing during our data analysis unit back to what we had studied previously during the year. I didn’t have to do as much reviewing this year because my students are still in the thick of graphing linear equations.
So, where is the best place for this skill? I’m still not sure! We’re behind where we should be this year, so I only had a few days to completely address scatter plots. I didn’t do the topic quite the justice it deserves (delving into the meaning and application of correlation coefficients), but I think it’s more important to move ahead and make sure that we have enough time to cover polynomials and radicals than to cover scatter plots in full detail. I’d love to be able to say that I teach 100% of the standards to the full extent they should be taught, but with only a 161 day school year with students, that’s just not possible.
Our second day of making scatter plots was a little less active and a lot more sweet. I saw this idea on twitter several years ago, and I wish I had made time to try it sooner!
First, purchase a large quantity of Starbursts.
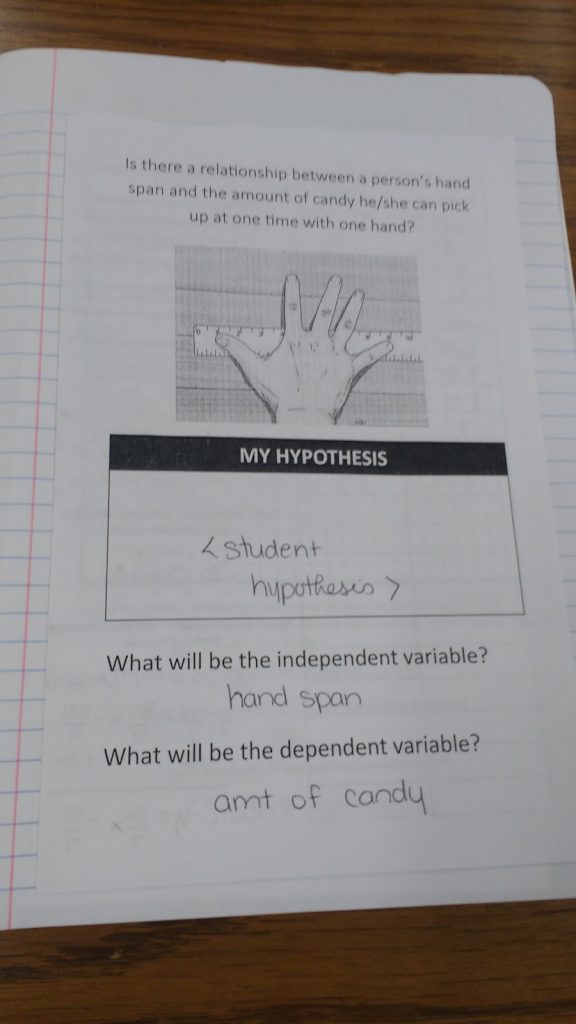
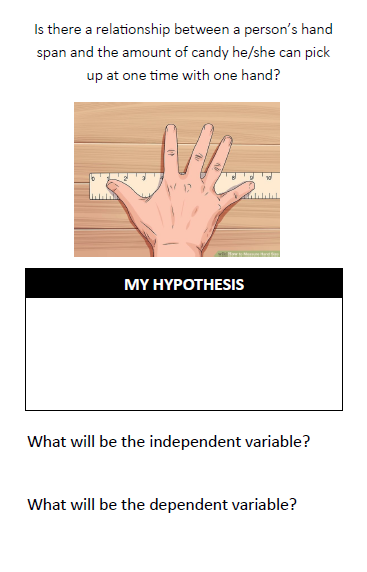
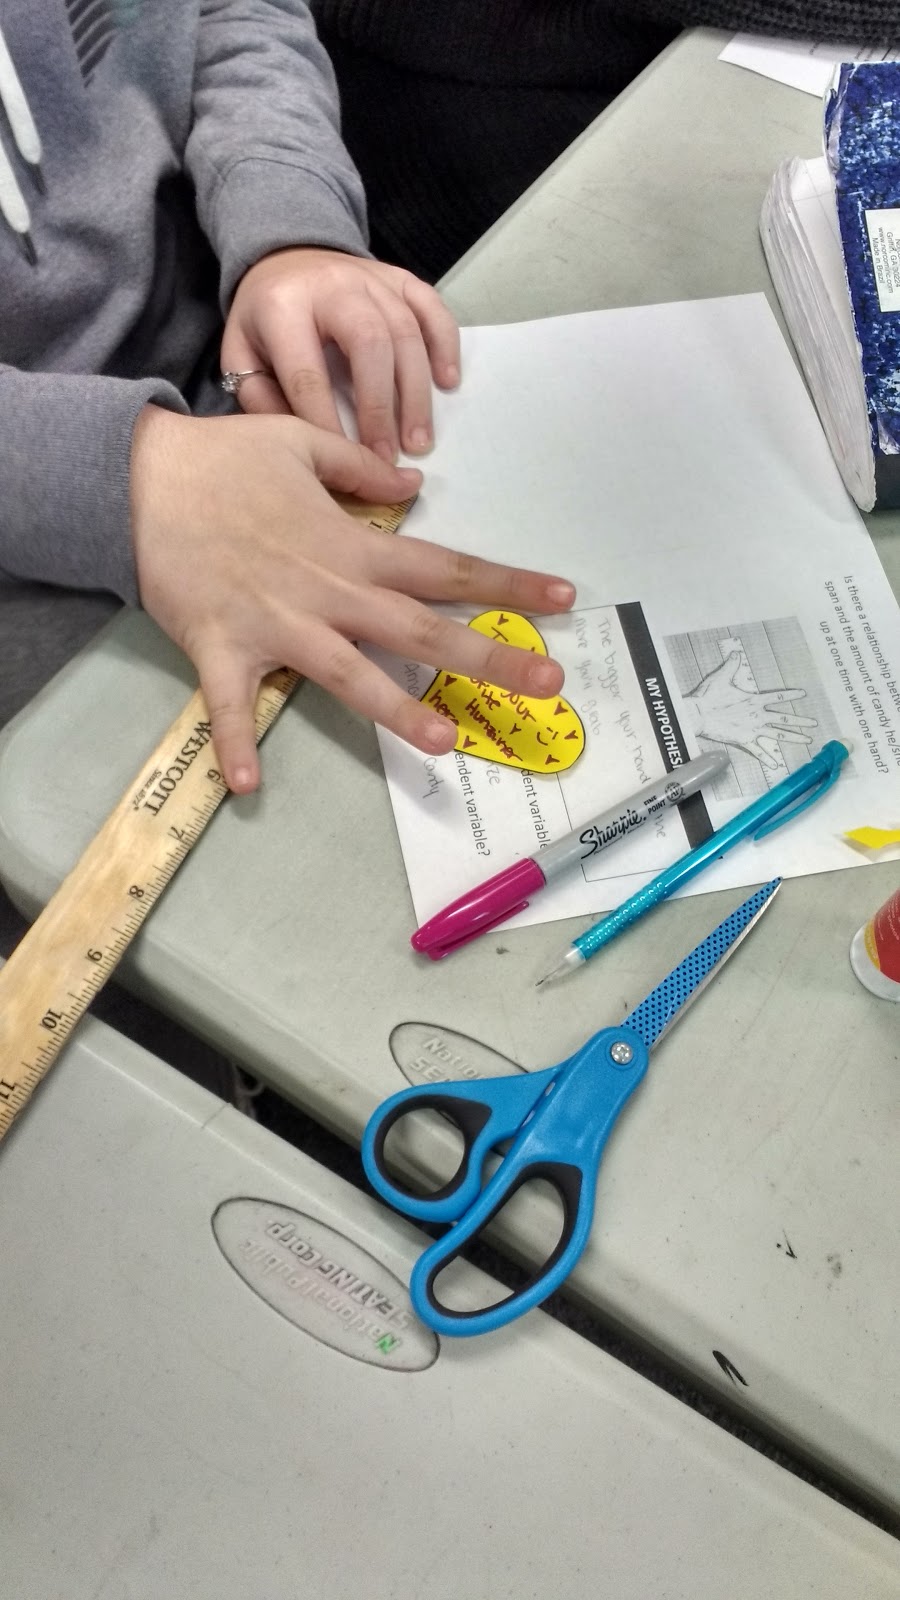
Next, pose this question to your class: Is there a relationship between a person’s hand span and the amount of candy he/she can pick up at one time with one hand?
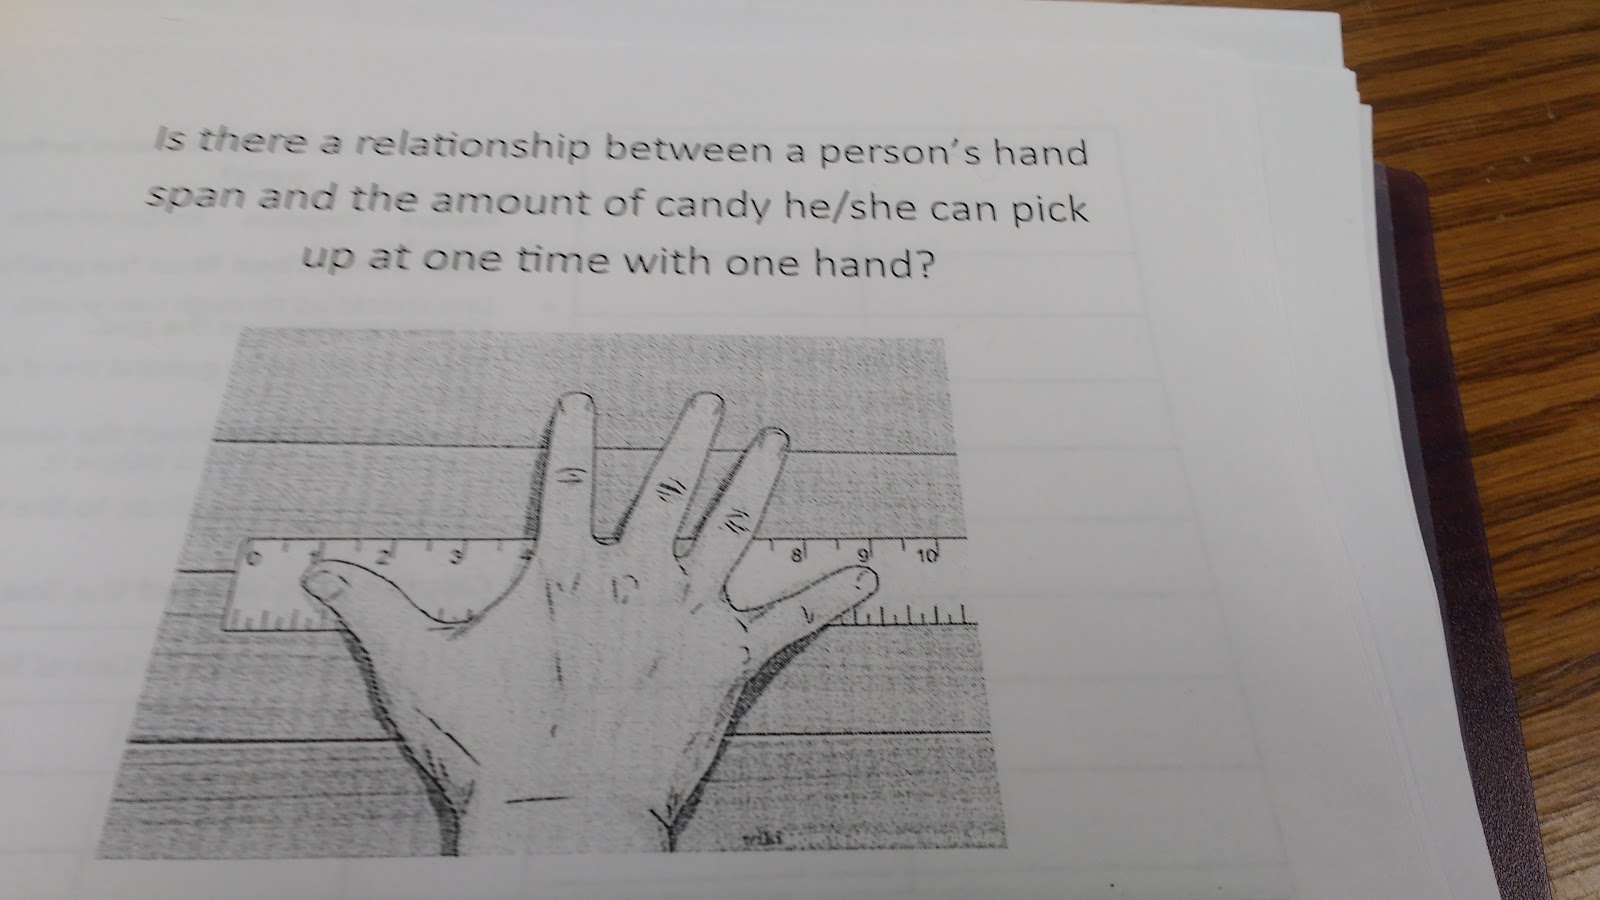
Quite a few of my students read this question and froze. They had no clue what they had just read or what they were actually being asked. I told them that they could change the word to “pattern.” This helped many of them better see what I was asking for.
In each class, one student would say something along the lines of “Well, if you have a bigger hand, you’re going to be able to pick up more candy. And, if you have a smaller hand, you’re going to be able to pick up less candy.” Usually, most of the class would nod in agreement upon hearing this. Several students were frustrated that they had realized this, but they had failed to realize that this was what I was looking for. I’m not sure if I need to reword my question or if I need to spend more time helping students dissect questions?
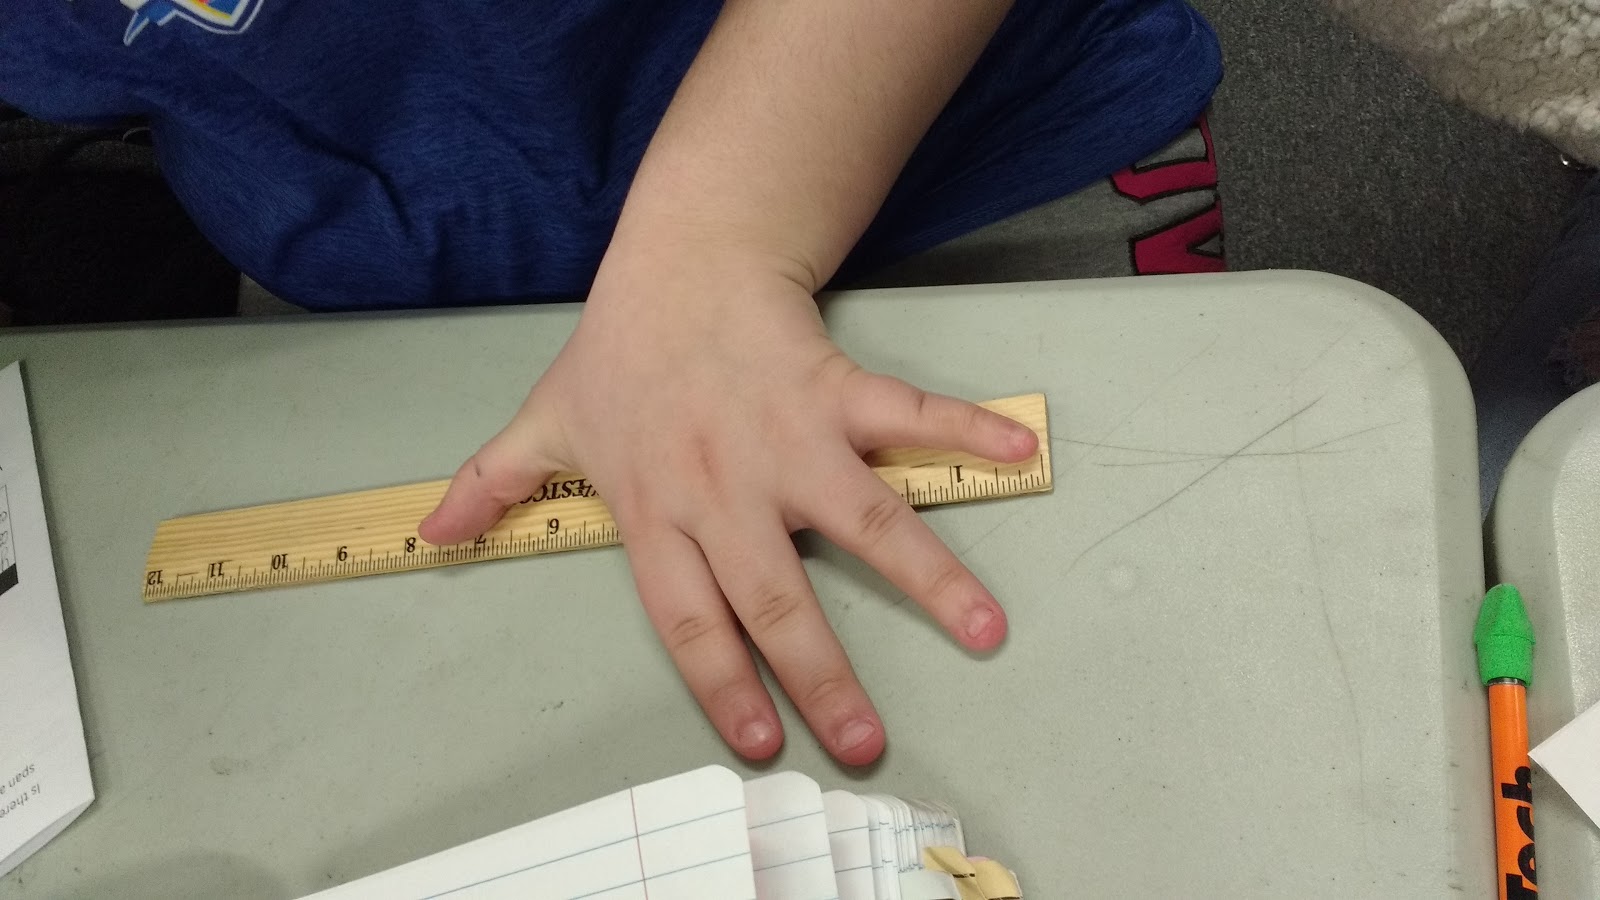
Now, it’s time to figure out our hand spans. We measured our hand spans in inches because some of the rulers in my classroom have only inches printed on them. Plus, I teach in America, and my students freak out any time I try and make them use the metric system.
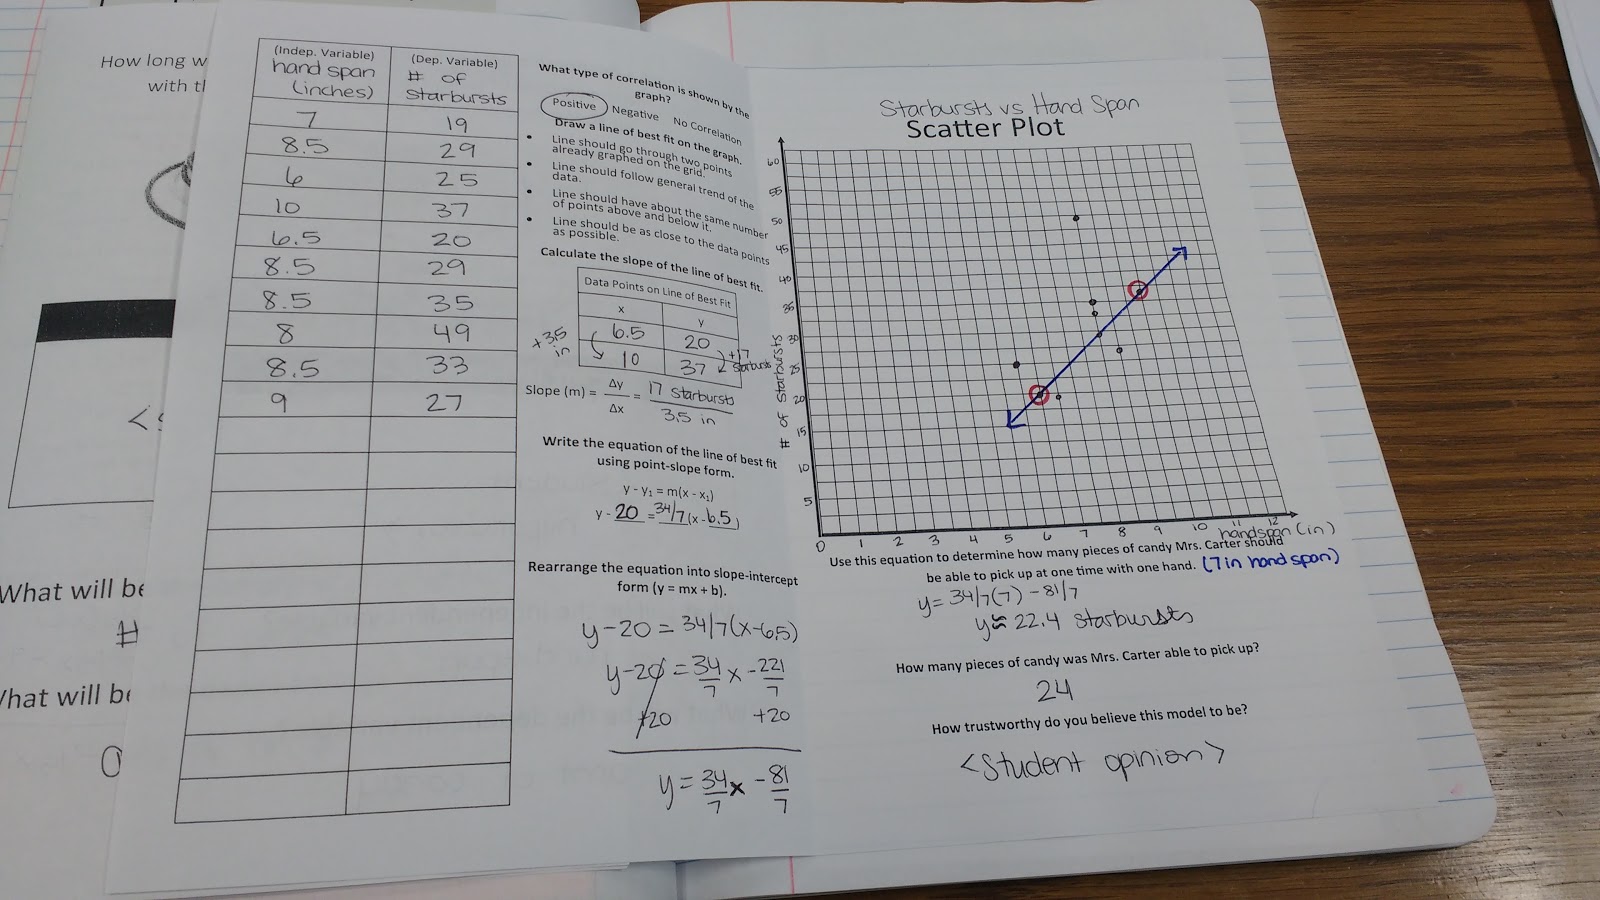
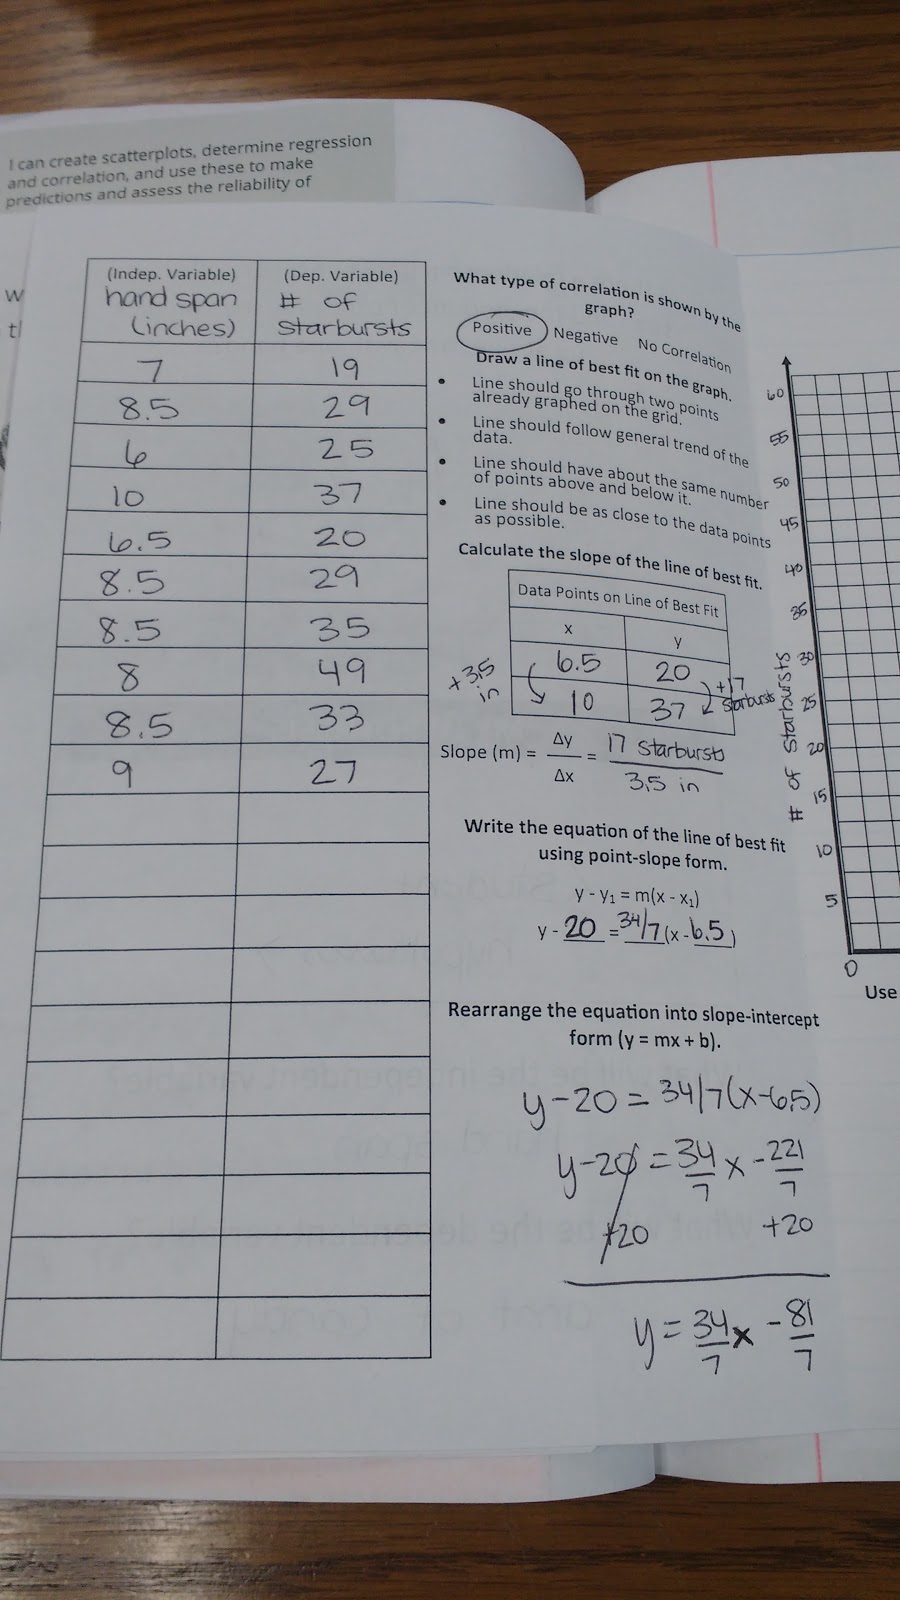
My students’ hand spans ended up ranging from 6 inches to 10 inches.
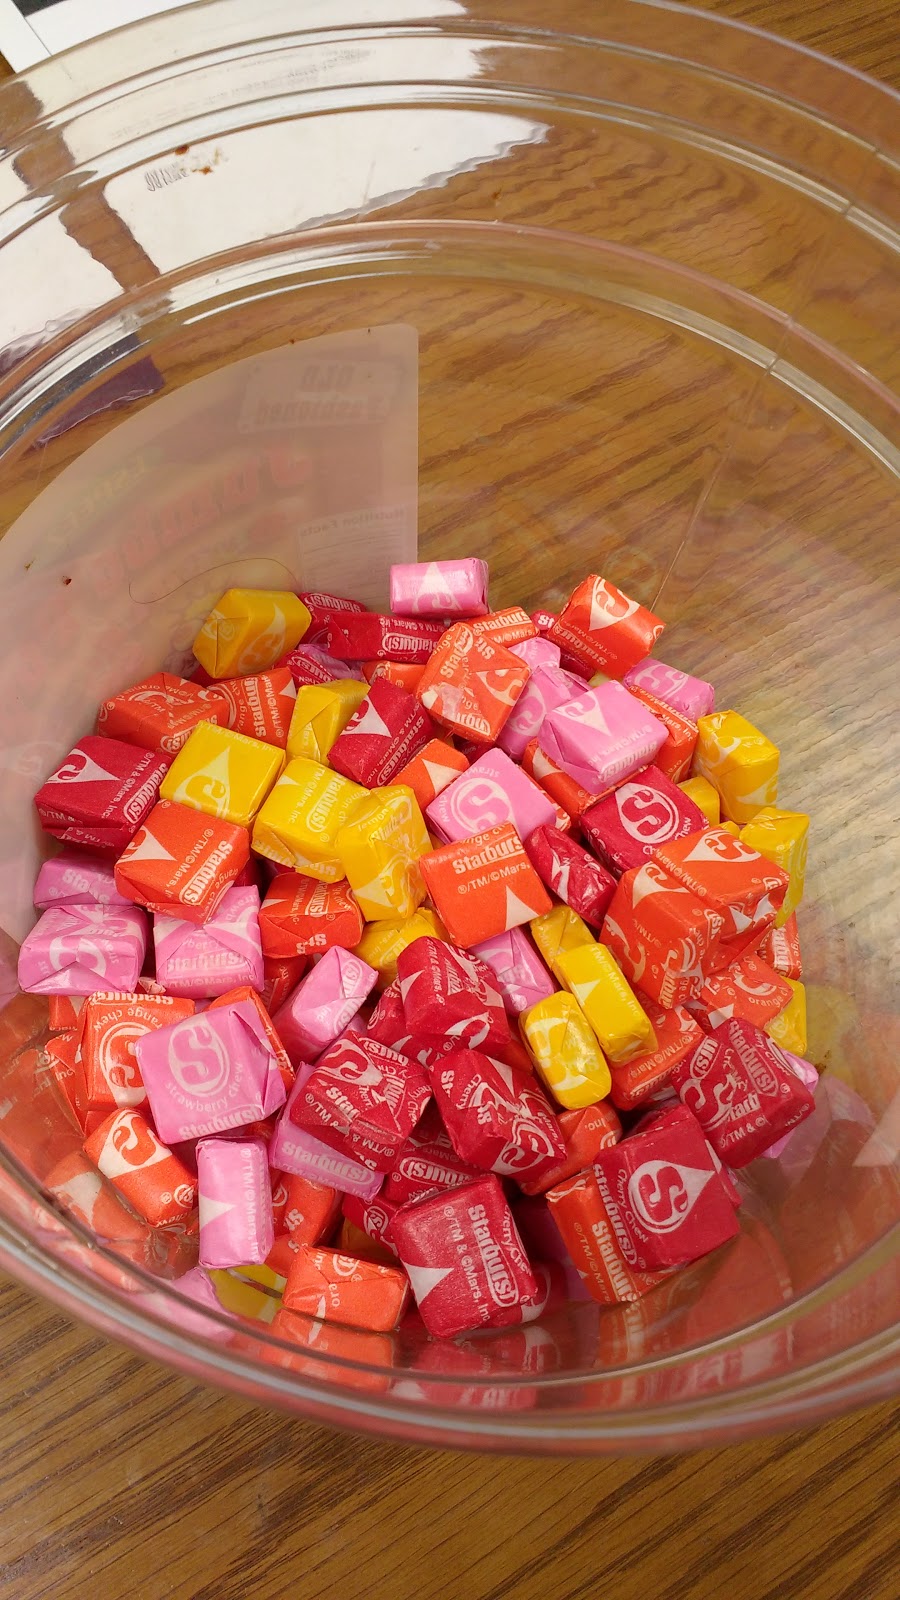
Finally, it’s time to break out the candy! I poured my bag off Starbursts into an old candy container that I had stuck in the cabinet.
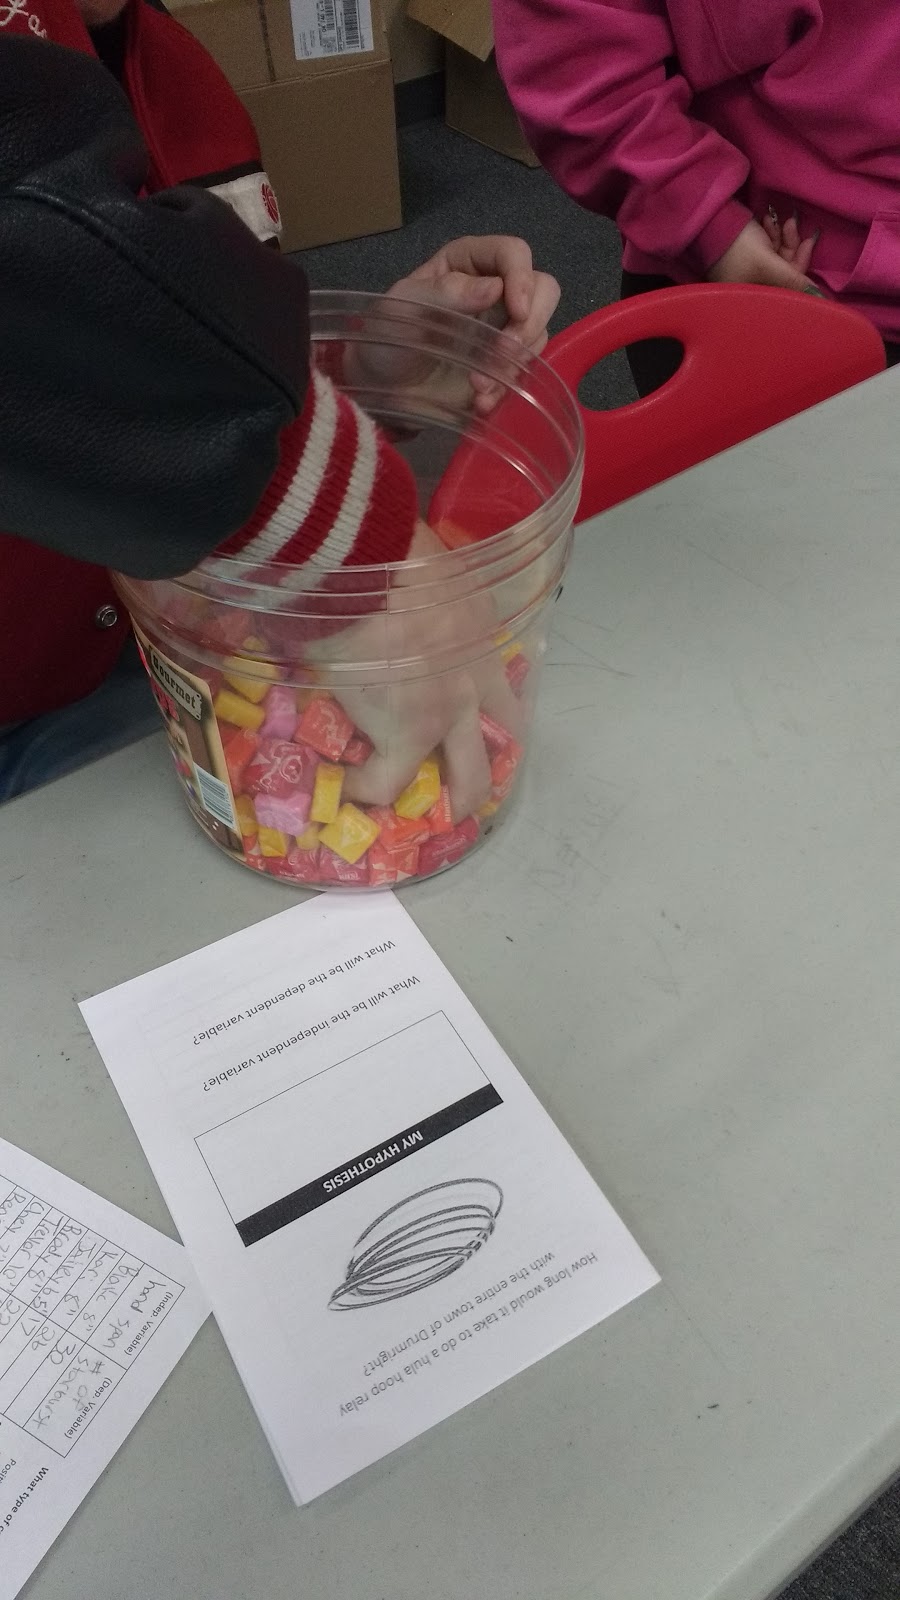
Students had one chance to pick up as many starbursts as they could at one time with one hand. I had to watch students closely because some tried to cheat by dragging up some of the candy up the wall of the container. It turns out that teenage boys get very competitive when it comes to figuring out how many pieces of candy each person can pick up at once!
Each student would take a turn grabbing a handful of candy. They passed the candy bucket to the next person to grab their candy while they counted their Starbursts. When each student finished counting their Starbursts, they would report the data to me to record on the SMARTBoard. Then, they would return their Starbursts to the candy bucket that had since moved on down the row. I found that ~5 students could grab Starbursts out of the bucket (I bought the 41 oz bag!) before we needed students to put their counted Starbursts back in. This was almost perfect timing!
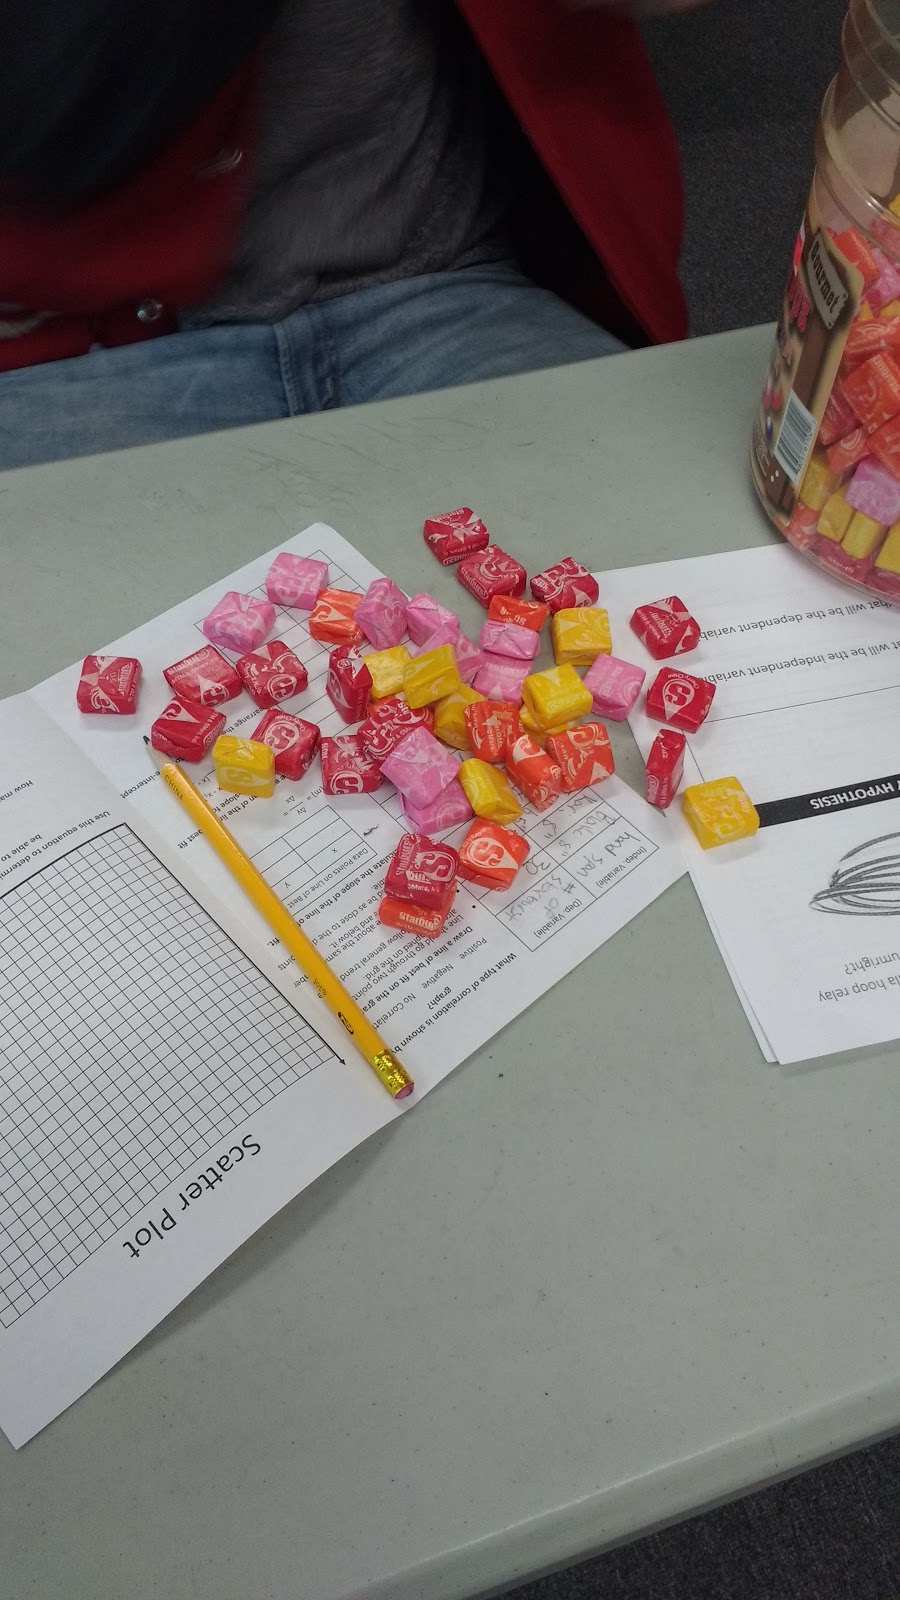
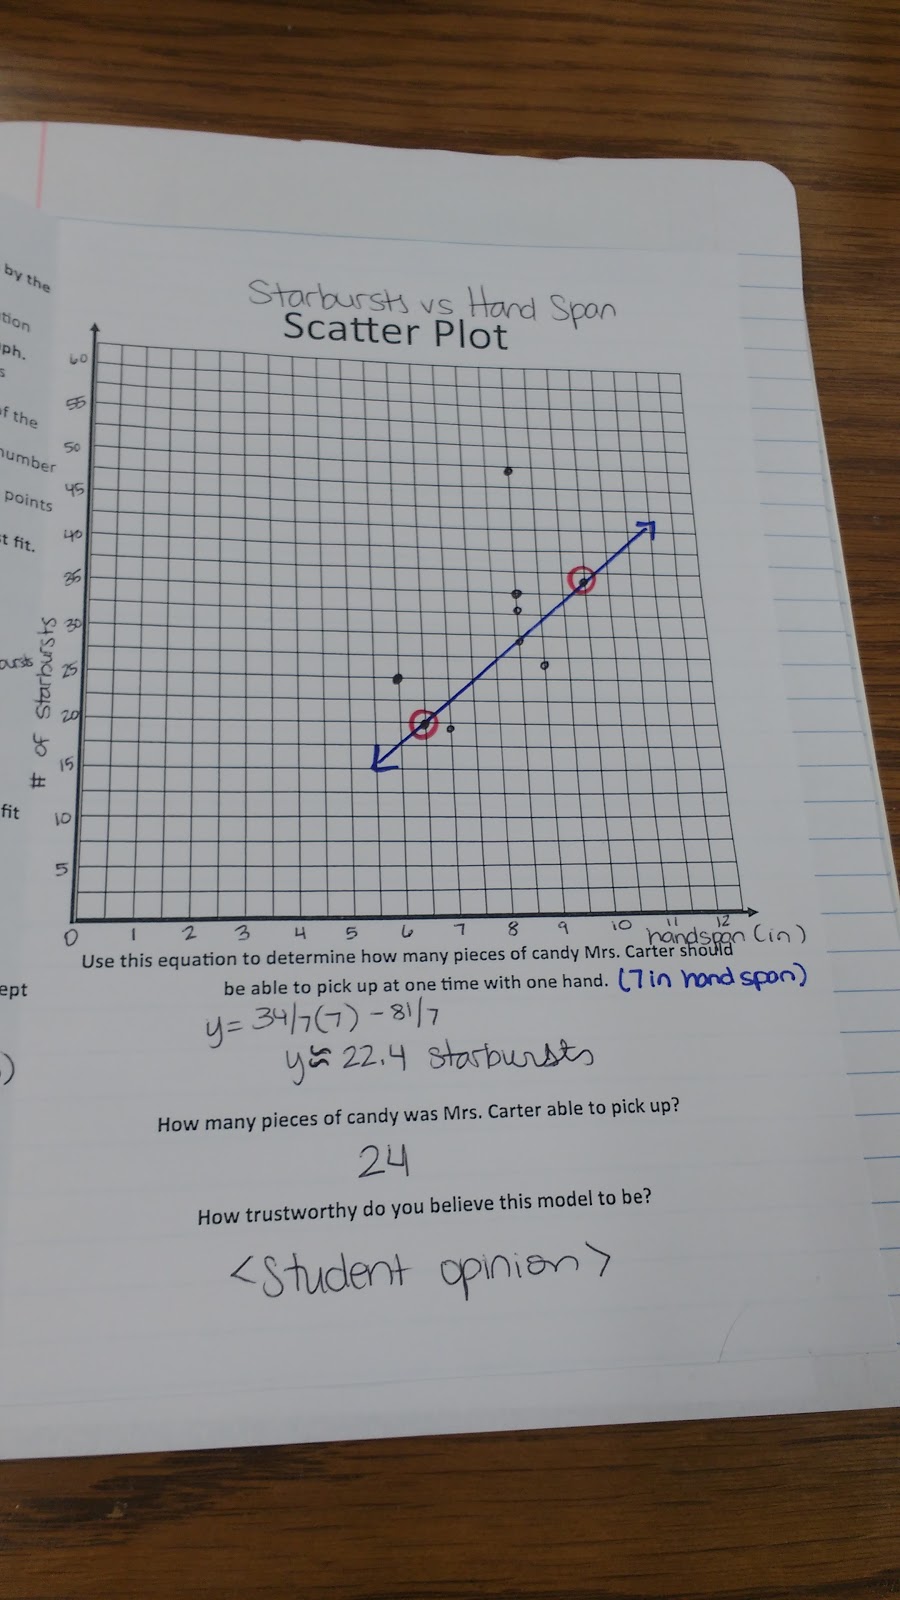
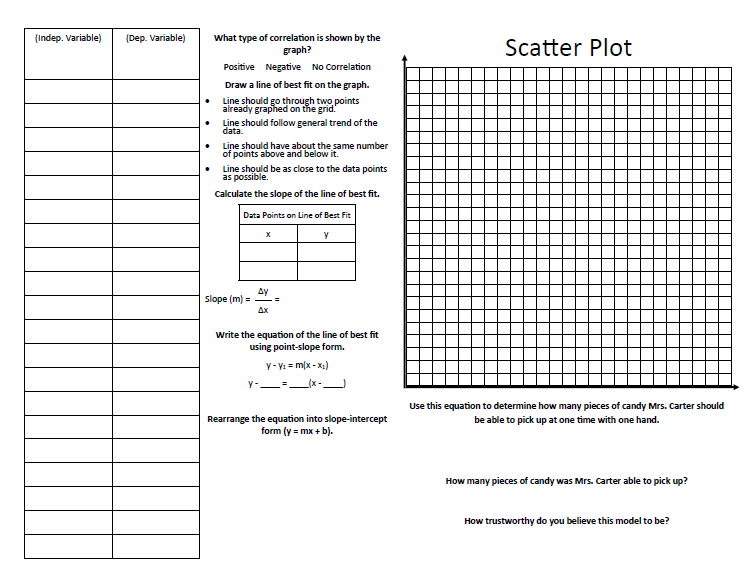
After collecting all of our data, we made a scatter plot. I thought the graph would have a much stronger correlation than it ended up having!
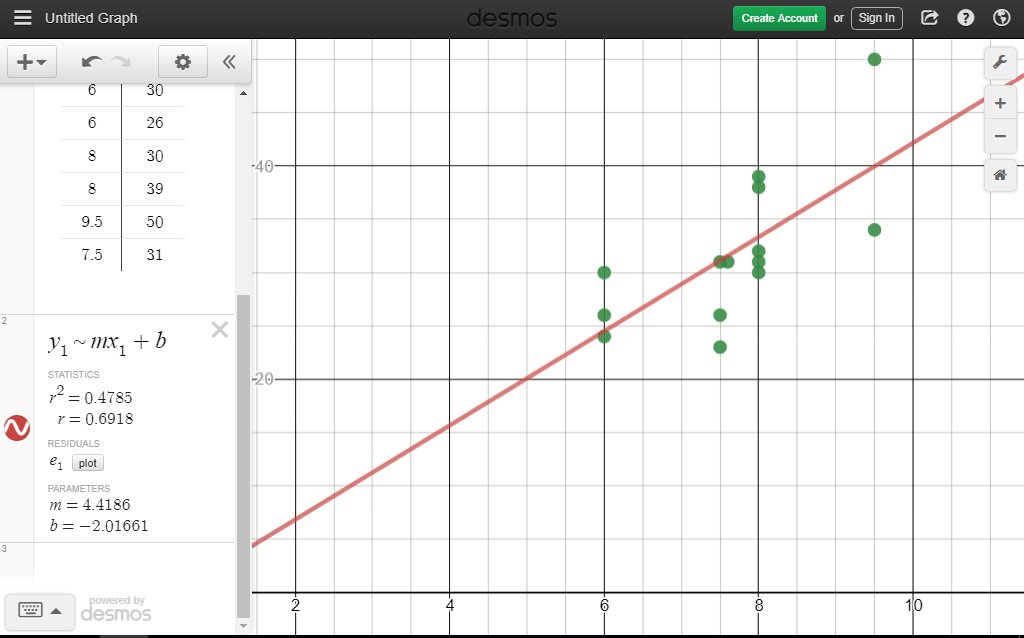
One class decided that the number of Starbursts you could pick up didn’t just depend on hand span. They theorized that it also mattered how skinny or fat your individual fingers were! Many students complained that they could grab quite a few Starbursts, they just slipped through their fingers back into the bucket!
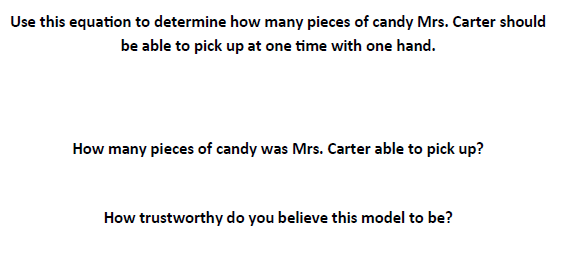
We used our line of best fit to determine how many Starbursts I should be able to pick up. None of my classes were able to determine the value exactly. It didn’t help that some hours I picked up 24 Starbursts and other hours I picked up 34! Obviously, there is something else at play than just hand span…