The Constant Chair Regression Activity
This blog post contains Amazon affiliate links. As an Amazon Associate, I earn a small commission from qualifying purchases.
I got a chance to experience the constant chair regression activity at a common core workshop that I attended (OGAP) during the summer of 2013. I have never seen this activity posted anywhere online, so I am not sure of the original source.
I am blogging about the activities that we worked through in an effort to both make them easier to find in the future and to hopefully inspire others.
For this activity, each group of students needs a chair (a plain jane straight back chair works best for this – you don’t want one with wheels or a folding chair that might collapse) and a meter stick or measuring tape.
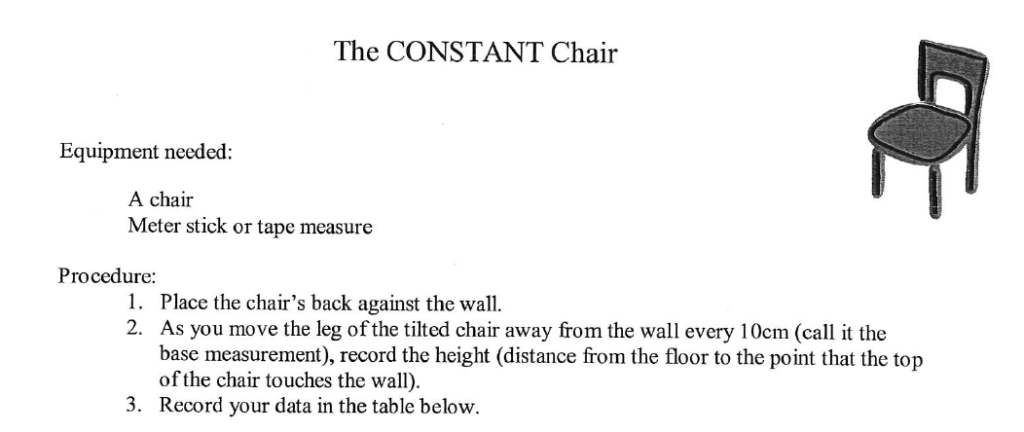
Procedure:
- Place the back of the chair against the wall. Measure and record the height of the chair.
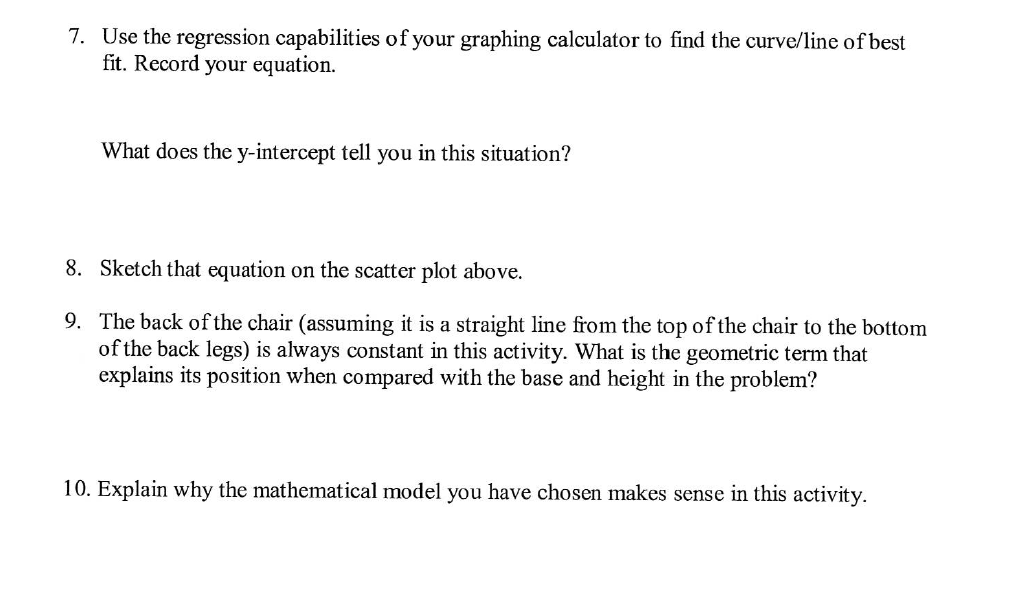
- Move the chair so it is 10 cm away from the wall. Tilt the chair backwards until the chair touches the wall. Measure the new height of the chair (the distance from the floor to the point that the top of the chair touches the wall.)
- Repeat this process, moving the chair 10 cm further away from the wall each time.
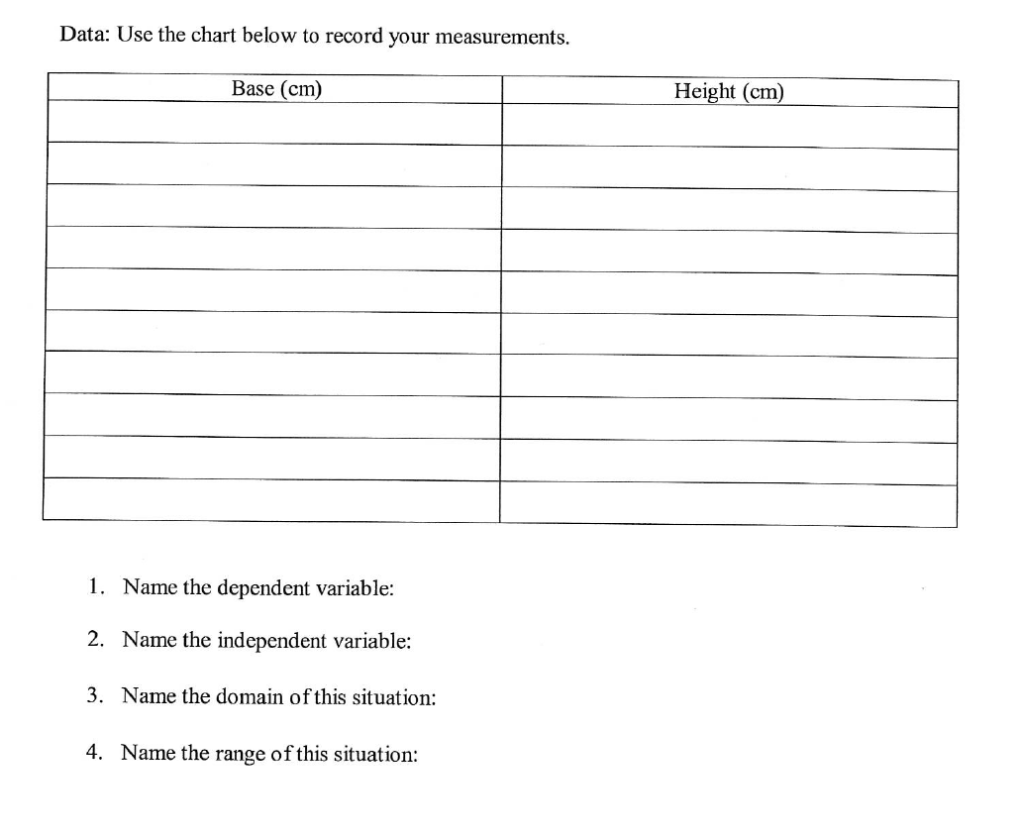
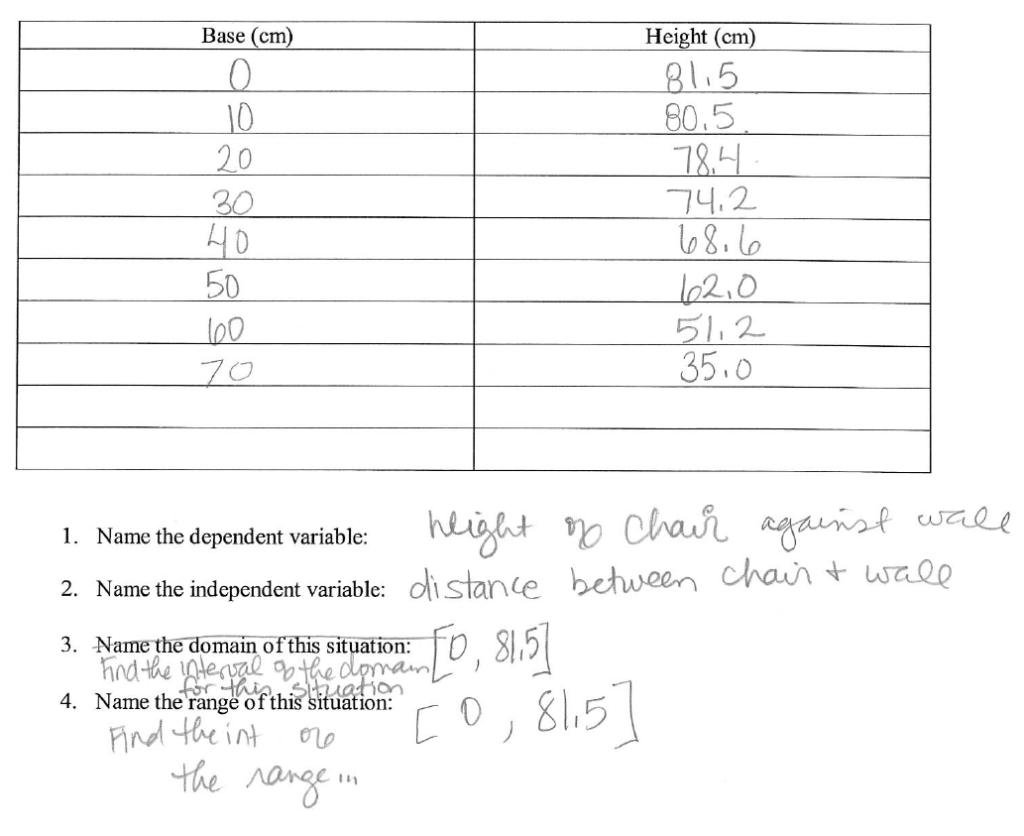
- Record your data in the given table.
I really wish I had taken pictures of us actually doing this activity. It is kind of hard to explain exactly what the chair should look like.
Here’s what my group’s data looked like for our 81.5 cm tall chair:
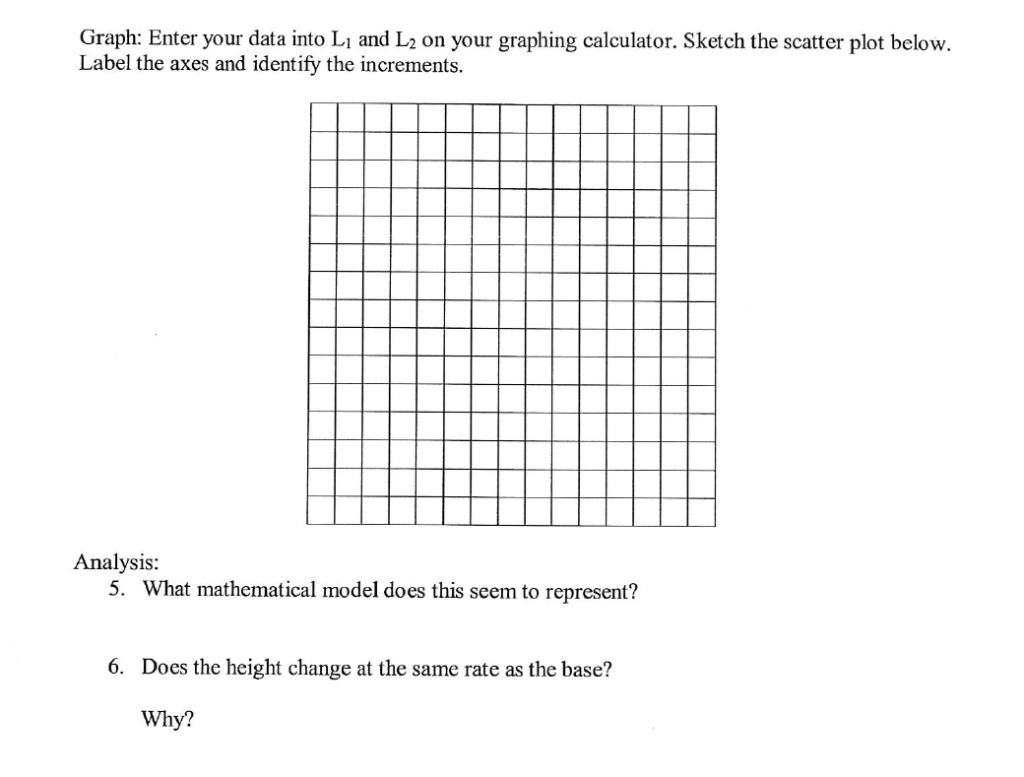
When we created our scatterplot, we ended up with a quadratic-looking graph.
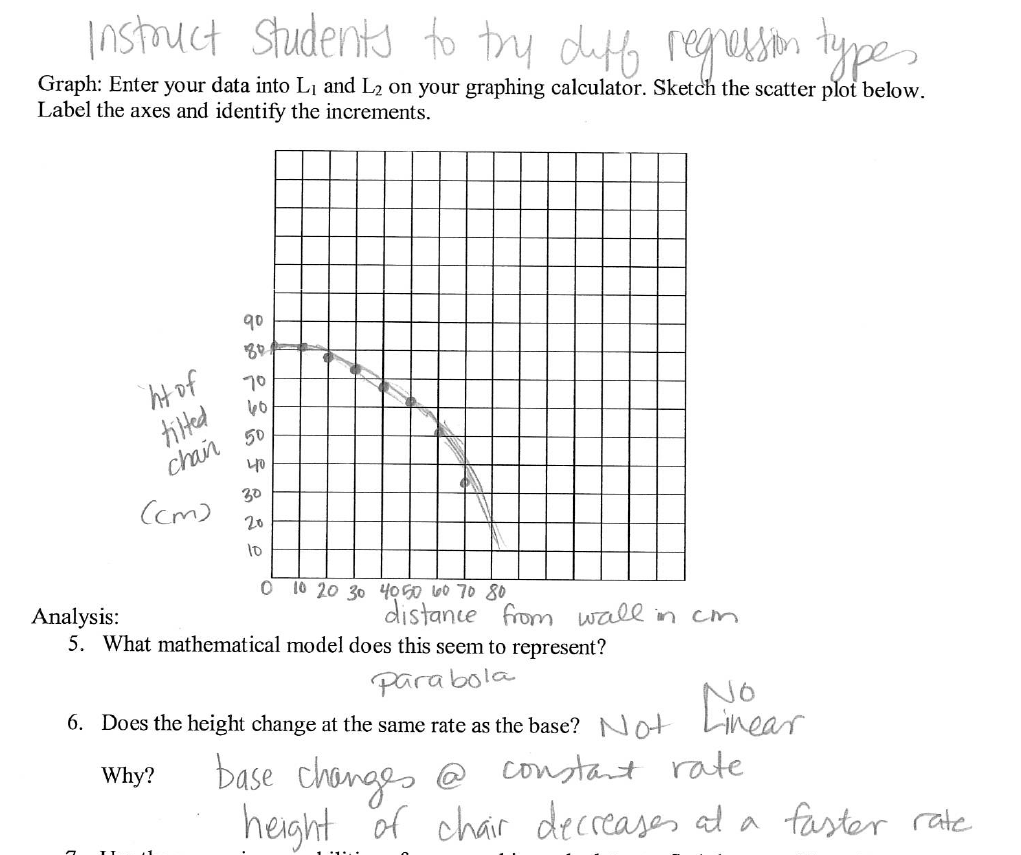
We performed a quadratic regression, and we were quite satisfied with our results.
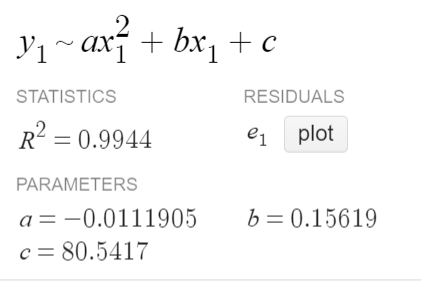
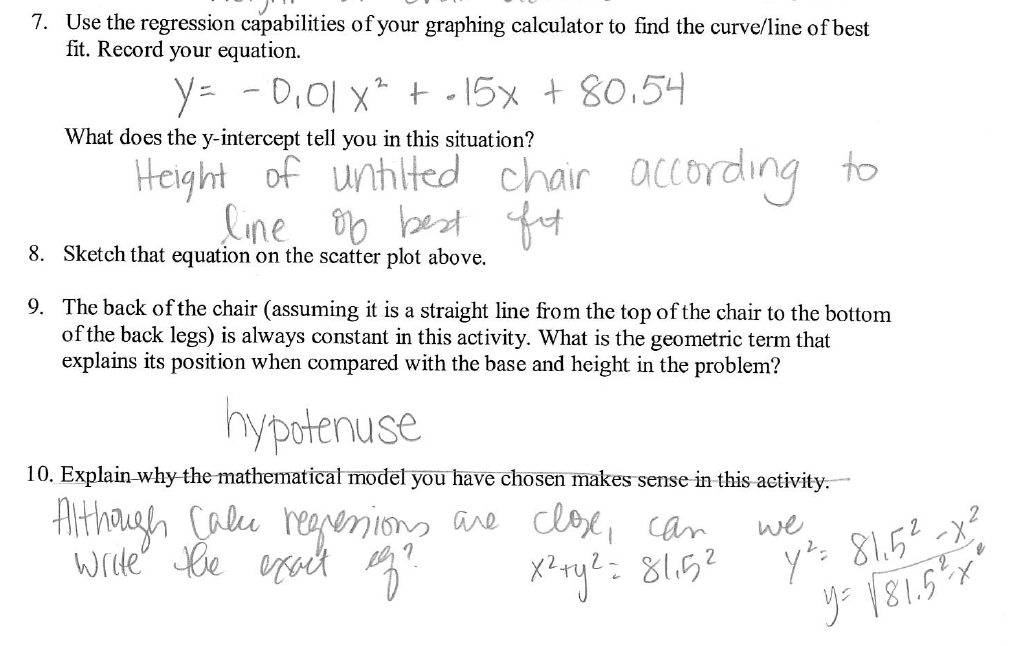
It was very interesting then, when the facilitators revealed that the best equation model for this was not a quadratic expression but a radical expression. What?!?
Our graph was actually 1/4 of a circle. It made sense when they explained it. Our y-intercept of 81.5 cm was the height of the chair. If we were to lay the chair entirely flat, it would have an x-intercept of 81.5 cm.
The height of the chair never changes, so the scatterplot we created is composed entirely of points that are 81.5 cm away from the origin.
Thus, we were able to write an exact equation for our graph by rearranging the equation of a circle with a center of (0,0) and a radius of 81.5. My mind was BLOWN.
We had a group discussion about how we often go about teaching modeling and regression in a less than ideal way in the math classroom. We study linear regression. Then, we give students situations that can be modeled linearly.
Then, we study quadratics and give students situations that can be modeled with a quadratic. Students never really have to think about what model they need to use. They just use whatever model they have been using. I
nstead, we should give students situations and let them determine the best model. Throw in a linear or exponential problem when you are studying quadratics just to see what students will do with it.
If students use a less than ideal model, that is okay. That is a way to jumpstart a conversation just like this activity did for us. I was convinced our graph was a parabola.
The thought had never even crossed my mind that it was a quarter of a circle.
I have scanned and uploaded the handout for this activity that I was given at the workshop.
The Constant Chair Regression Activity Files
Click here to SAVE the file to your device.The Constant Chair Regression Activity
1658 saves – 573.13 KB