Bouncing Tennis Balls Linear Regression Lab
I learned about this bouncing tennis balls linear regression lab through the OGAP Common Core Training I attended this summer. It is based on an Illuminations activity from NCTM.
Students are given a tennis ball to bounce for two minutes. Every ten seconds, the number of bounces is recorded. I learned a lot from doing this activity for the first time.

Things I Learned from Doing This Activity
1. When you teach in a building that was built in 1919 and your room is on the second floor, it’s not a good idea to do this lab in your classroom. The science teacher whose classroom is directly beneath you will send a student upstairs to ask you to stop doing whatever you are doing because it is distracting them. Oops… I guess five bouncing tennis balls can make quite a bit of racket. We ended up going down the hall to the auditorium and doing our tennis ball bouncing on the stage.
2. Do not hand out the tennis balls to the groups until the last minute possible. Otherwise, students will start their practice bounces before you demonstrate the proper way to bounce a tennis ball for this lab. Then, you will find yourself in a scenario like this.
Student – Can we have another tennis ball?
Me – What did you do with the tennis ball I just gave you?
Student – We might have lost it?
Me – How could you lose it? I just gave it to you a few seconds ago!
Student – Well, I only bounced it once, but…
Immediately, all eyes in the classroom were drawn to the ceiling. Other perks of working in such an old building are that there are incredibly high ceilings and random pipes running EVERYWHERE. Okay, maybe only one of those is a perk. I looked up above the light fixtures to see the tennis ball resting on some pipes. If you look closely, you should be able to see it.

I told the students that they would not be given another tennis ball. If they could get the tennis ball up there, they could find a way to get it down. Eventually, one of the students stood on top of their desk and used an umbrella to dislodge the tennis ball.
3. Even if you show students the proper way to bounce a tennis ball so their data is linear, they will not listen.
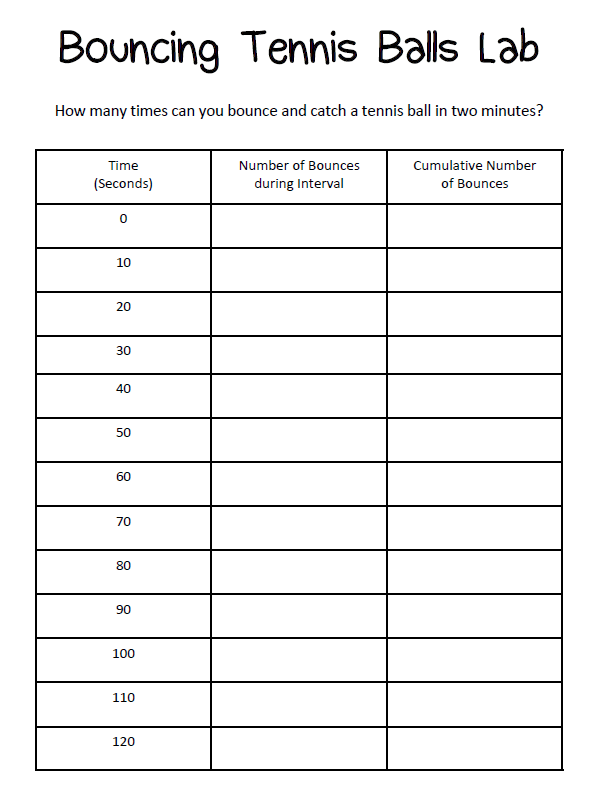
4. The provided table asks students to count the number of bounces in each ten-second interval. Then, afterwards, they are supposed to fill in a third column with the cumulative number of bounces. This will confuse students INCREDIBLY. Have students mark out the middle column and ONLY record the cumulative number of bounces.
5. Yes, having each student collect their own set of tennis ball data sounds like a great idea. But, you will be much saner if you have each group collect one set of data. That was a lesson learned the hard way!
I created a handout to use with my students. After the data collection and regression activity was over, I had them fold the handout in half and glue it in their interactive notebooks.
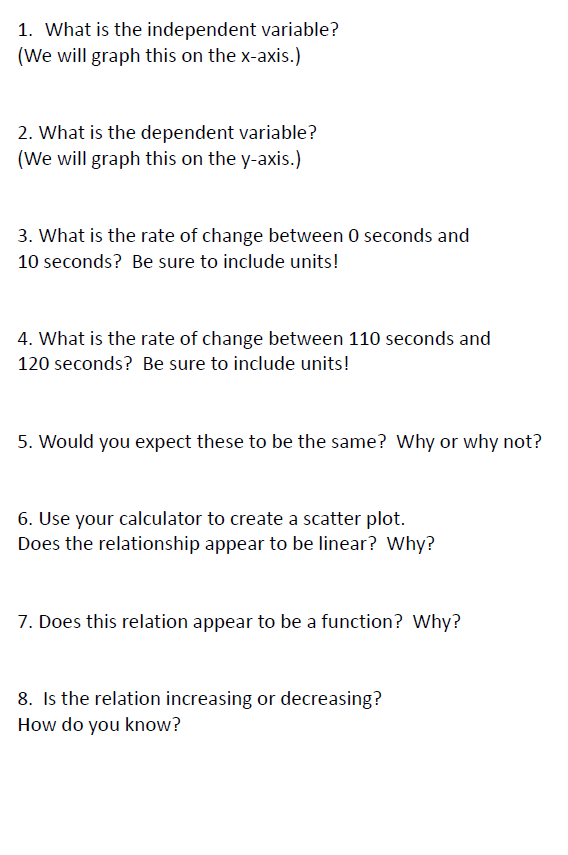
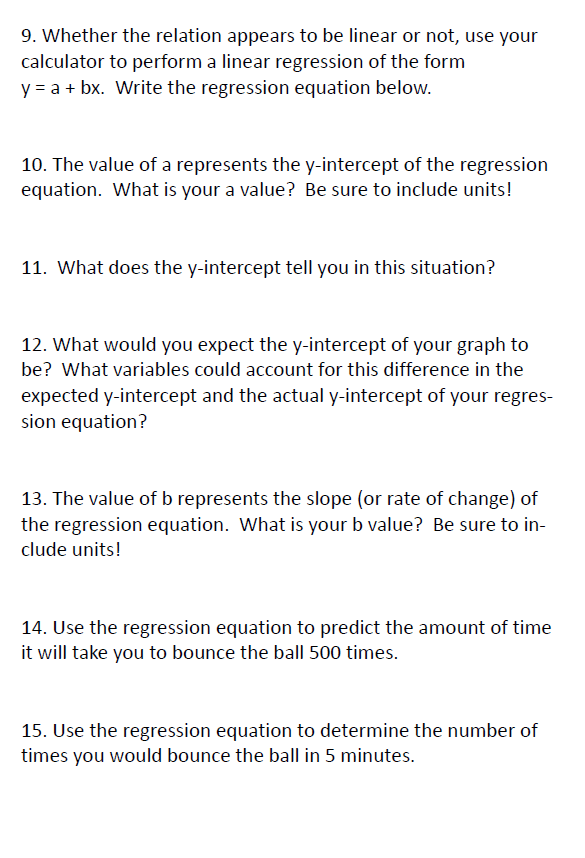
I took the activity a step farther than Illuminations did and used it as an opportunity to review a lot of the concepts that we had started working with in Unit 1. Students were asked to classify variables as dependent and independent, calculate the rate of change between various intervals, classify a scatter plot as linear or non-linear, determine if the produced scatter plot is a function, describe the relation as increasing or decreasing, perform a linear regression using their calculator, interpret the meaning of the slope and y-intercept in this particular situation, and use the regression equation to make predictions.
Free Download of Bouncing Tennis Balls Linear Regression Lab
Click here to Download
Bouncing Tennis Balls Lab (PDF)
2186 downloads – 108.13 KB

