Skip to content
Facebook
X
Instagram
Threads
YouTube
Pinterest
Email
Trending Resource
:
Tape Sudoku
- A New Circular Sudoku Variant
About
Expand
About Me
Puzzles
Expand
All Printable Puzzles
Math Puzzles
Logic Puzzles
Seasonal and Holiday Puzzles
Word Puzzles
Hands-On Puzzles
Mazes
Puzzle Solutions
Answer Key Database
Resources
Expand
Sort by Season or Holiday
Sort by Theme
Sort by Grade Level
Expand
Lower Elementary K-2
Upper Elementary 3-5
Middle School 6-8
High School 9-12
Sort by Math Topic
Expand
Number & Operations
Algebra & Functions
Geometry & Measurement
Statistics & Probability
Trigonometry
Calculus
SEARCH
Search
Facebook
X
Instagram
YouTube
Toggle Menu
SEARCH
Search
Home
»
Statistics
»
Page 2
Statistics
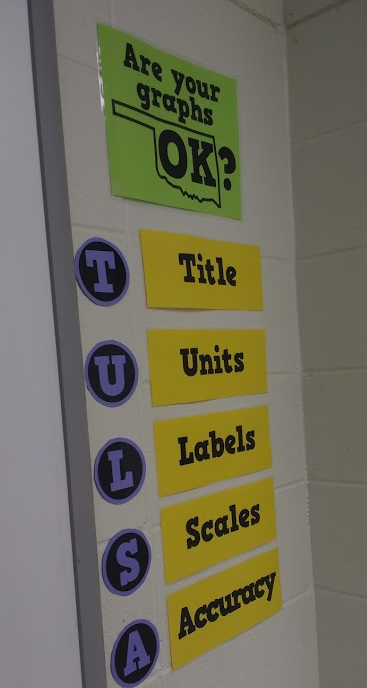
Are your graphs OK? TULSA Graphing Posters
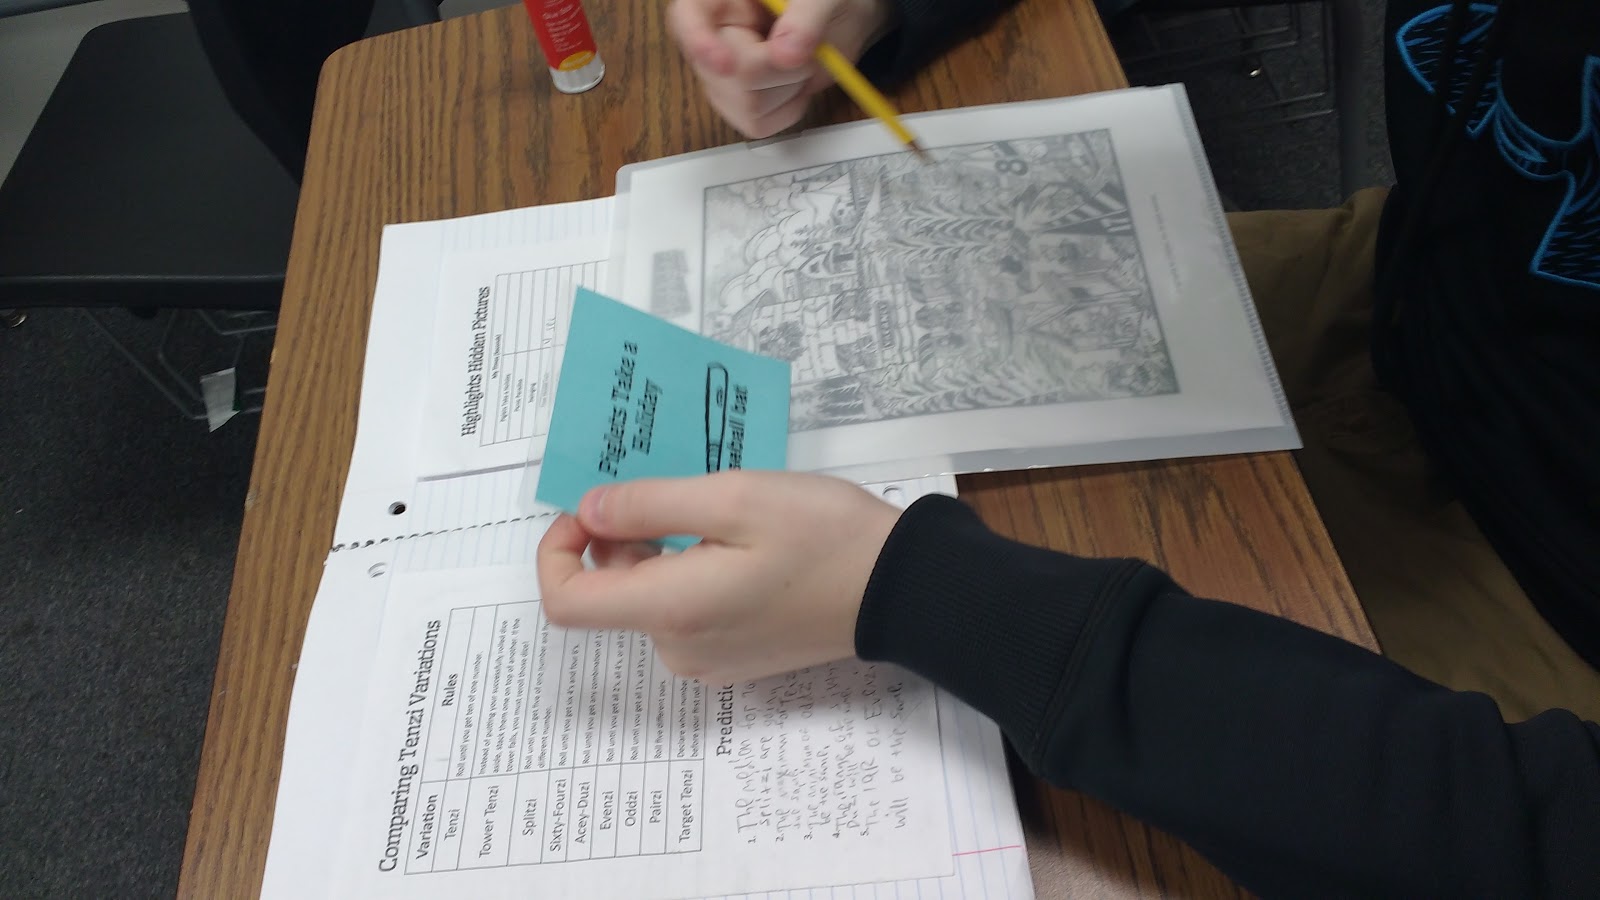
Highlights Hidden Pictures Activity for Comparing Data Sets
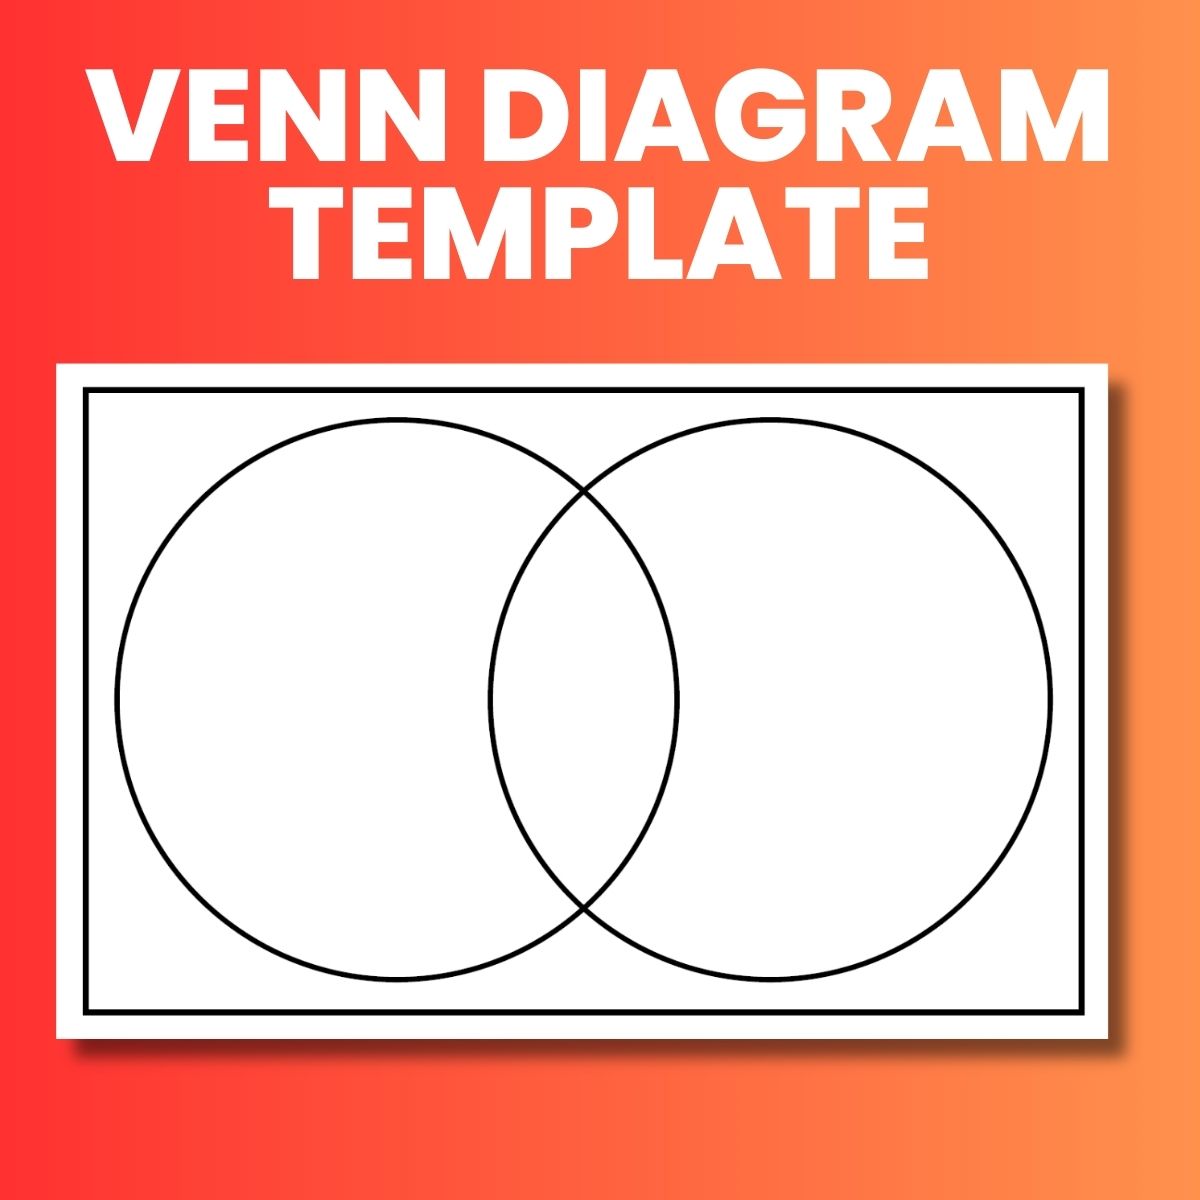
Venn Diagram Template (2 Circles)
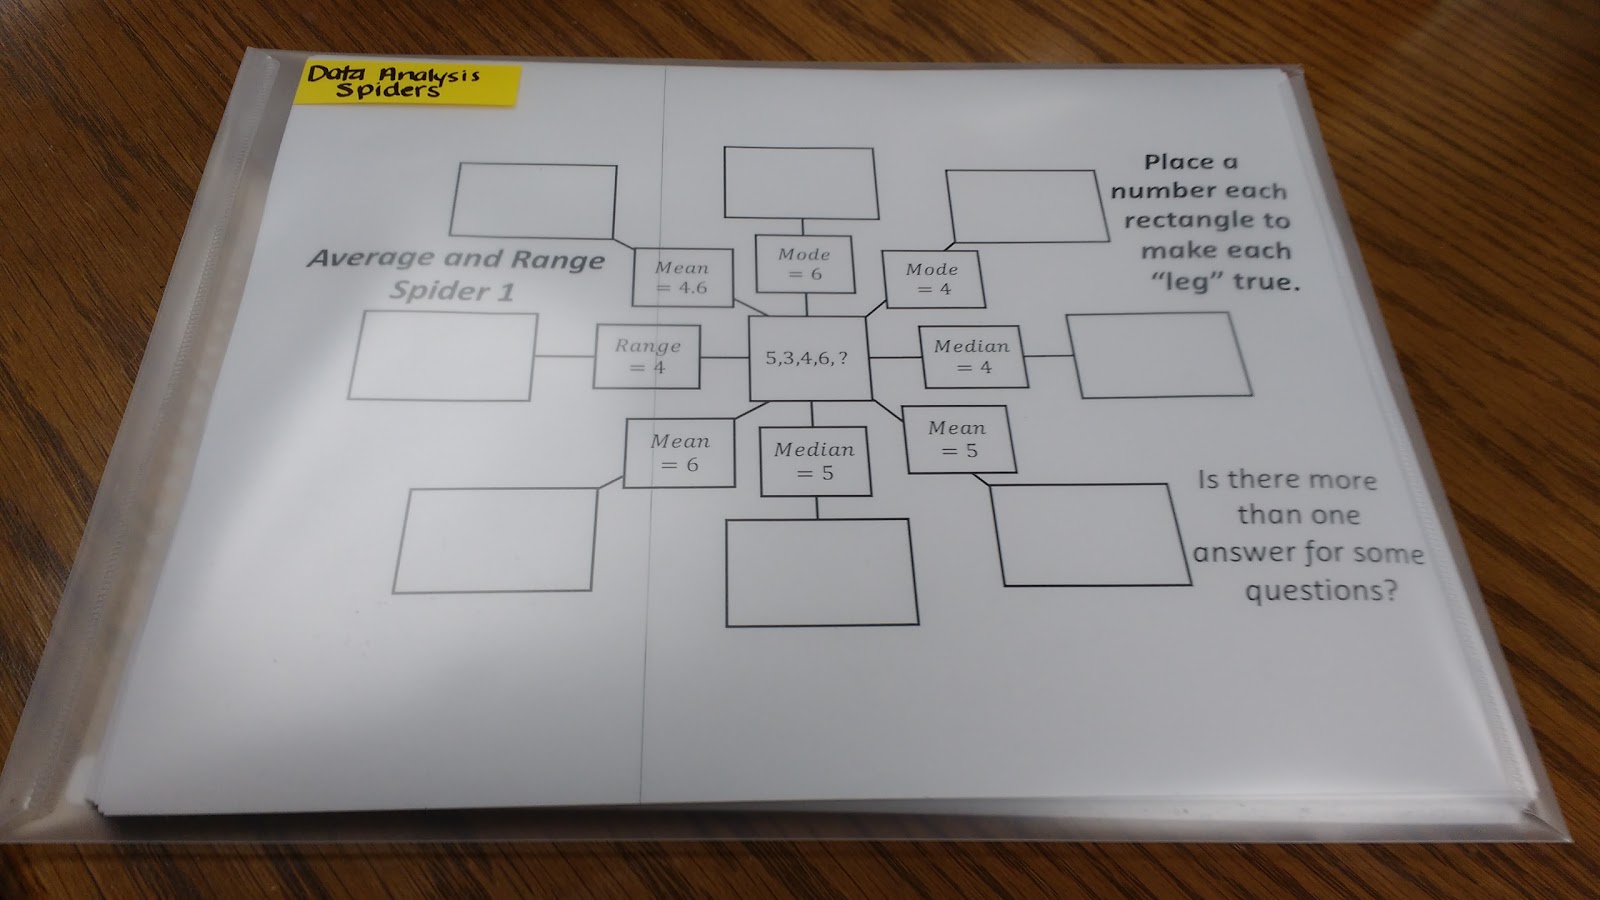
Mean, Median, Mode, and Range Spider Puzzles
Blind Stork Test for Data Collection
Hex Nut Probability Activity
Hula Hoop Scatterplot Activity
Mystery Box Probability Activity
Blocko Probability Game
Looking for Outliers in the OKC Thunder
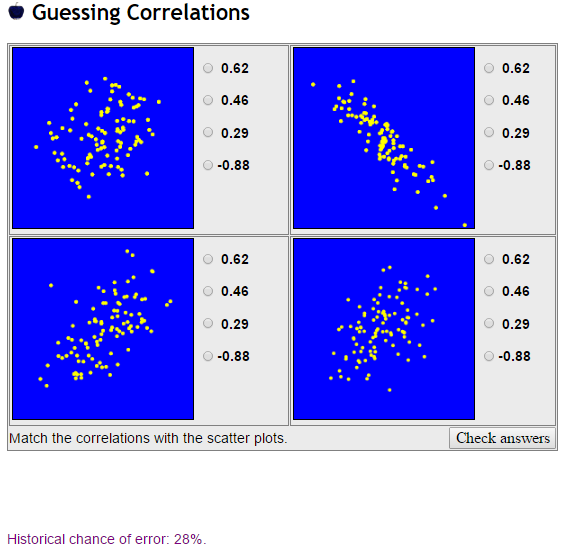
Guessing Correlation Coefficient Game
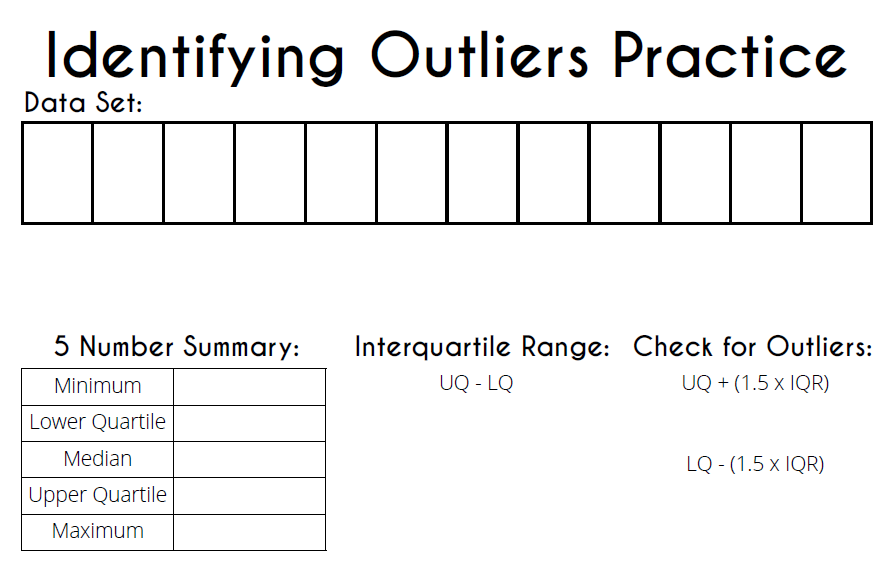
Dry Erase Workmat for Finding Five Number Summary, IQR, and Outliers
Estimating 30 Seconds Data Collection Activity
Always Sometimes Never Activity for Mean, Median, Mode, & Range
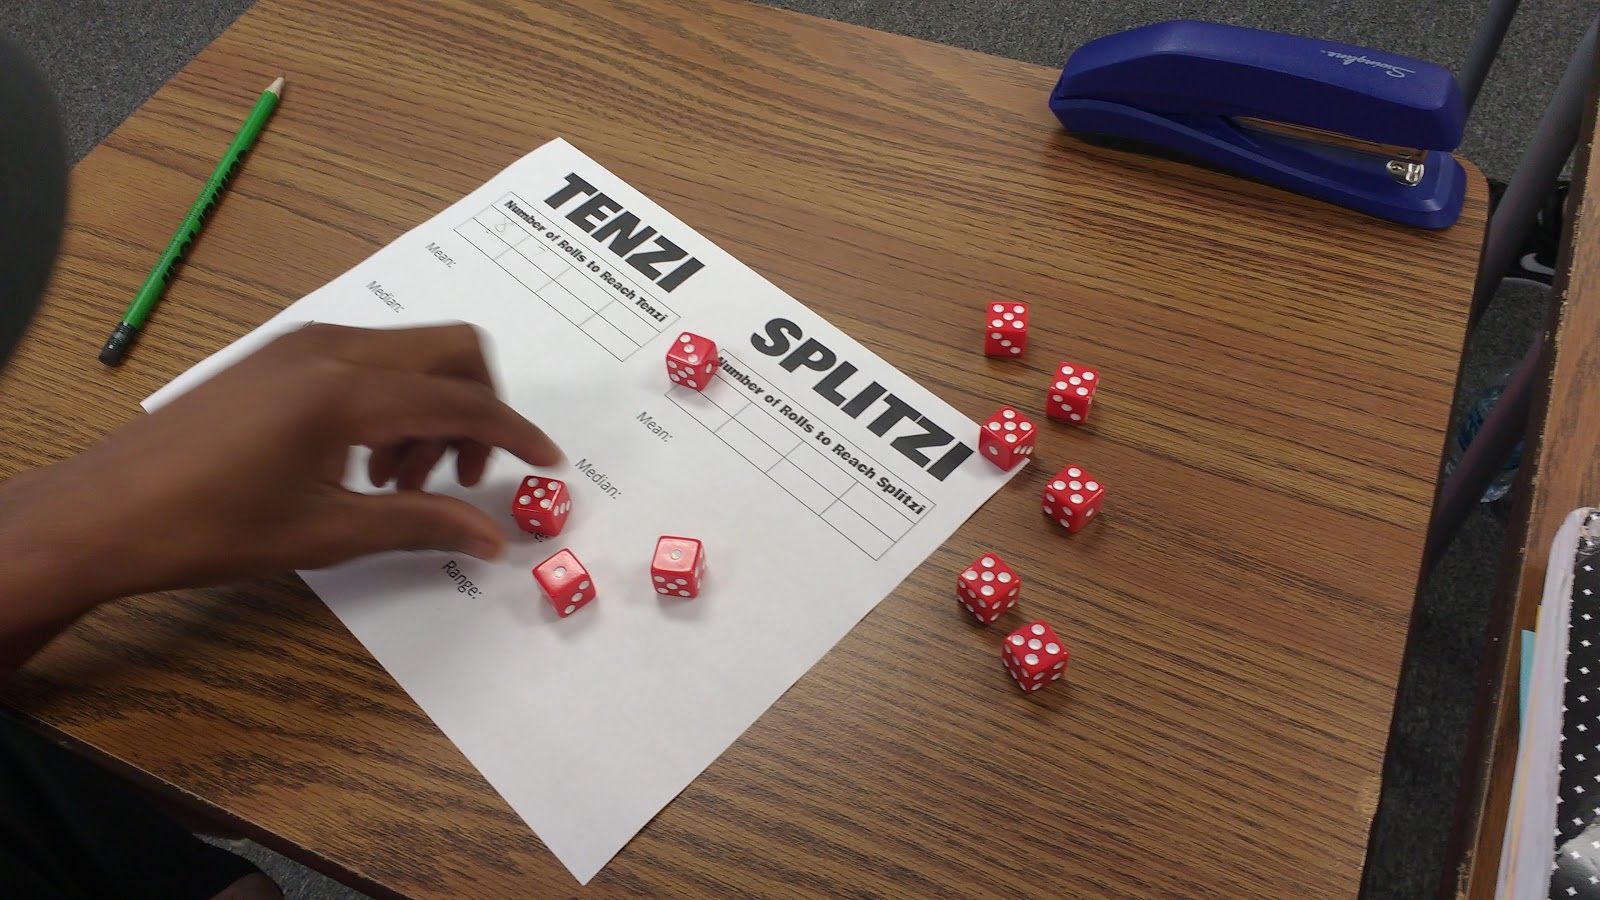
Tenzi vs Splitzi Measures of Central Tendency Activity
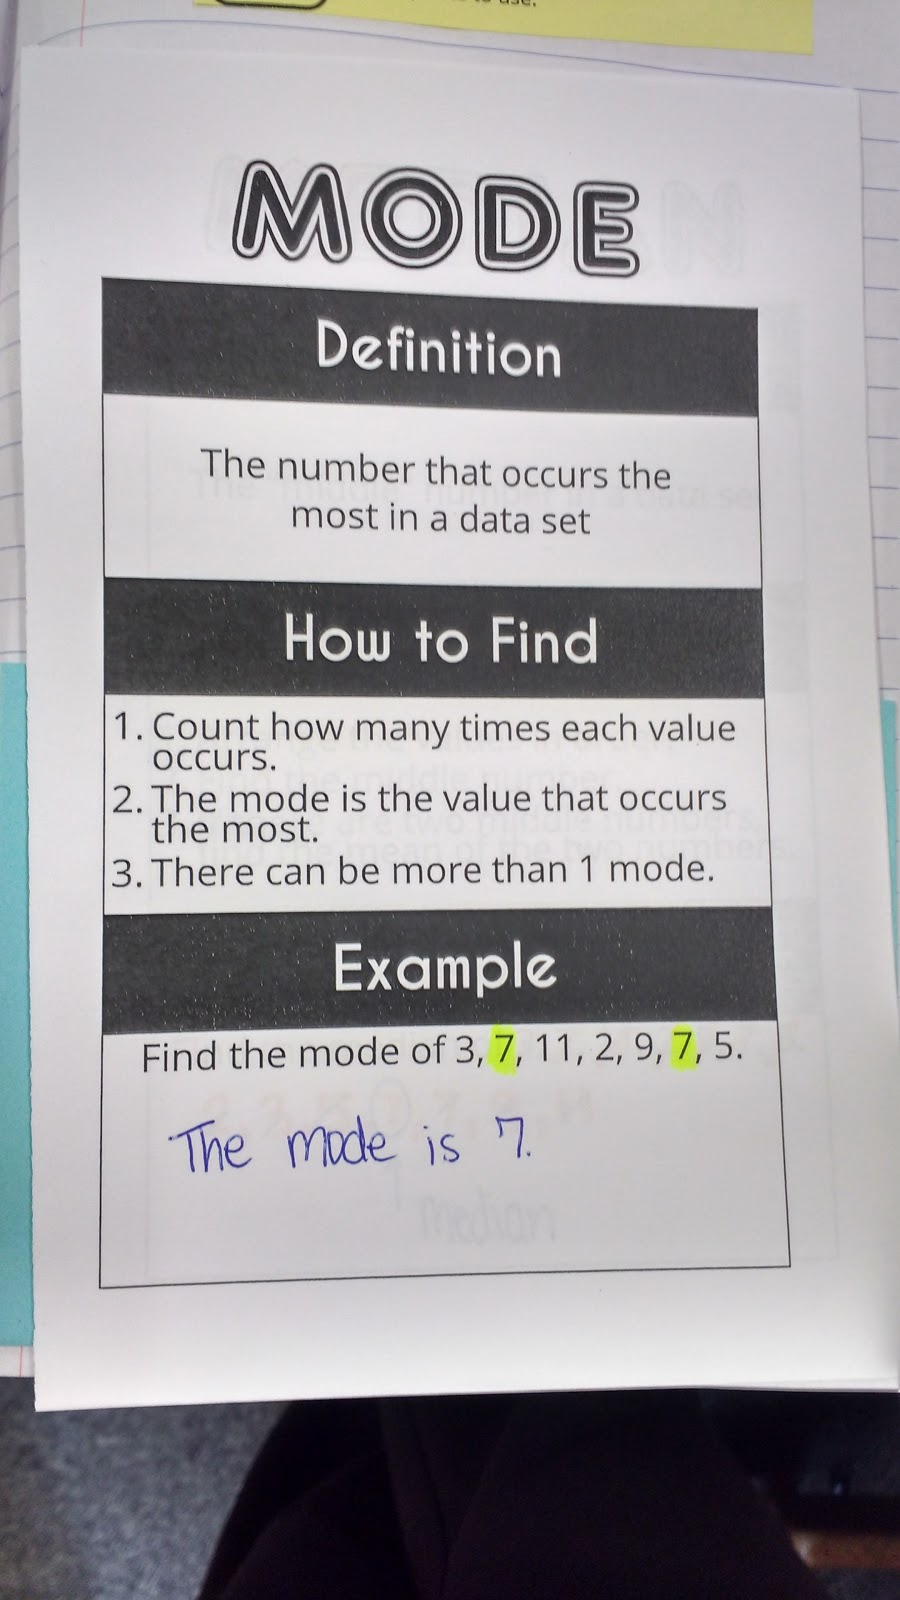
Measures of Central Tendency Graphic Organizers
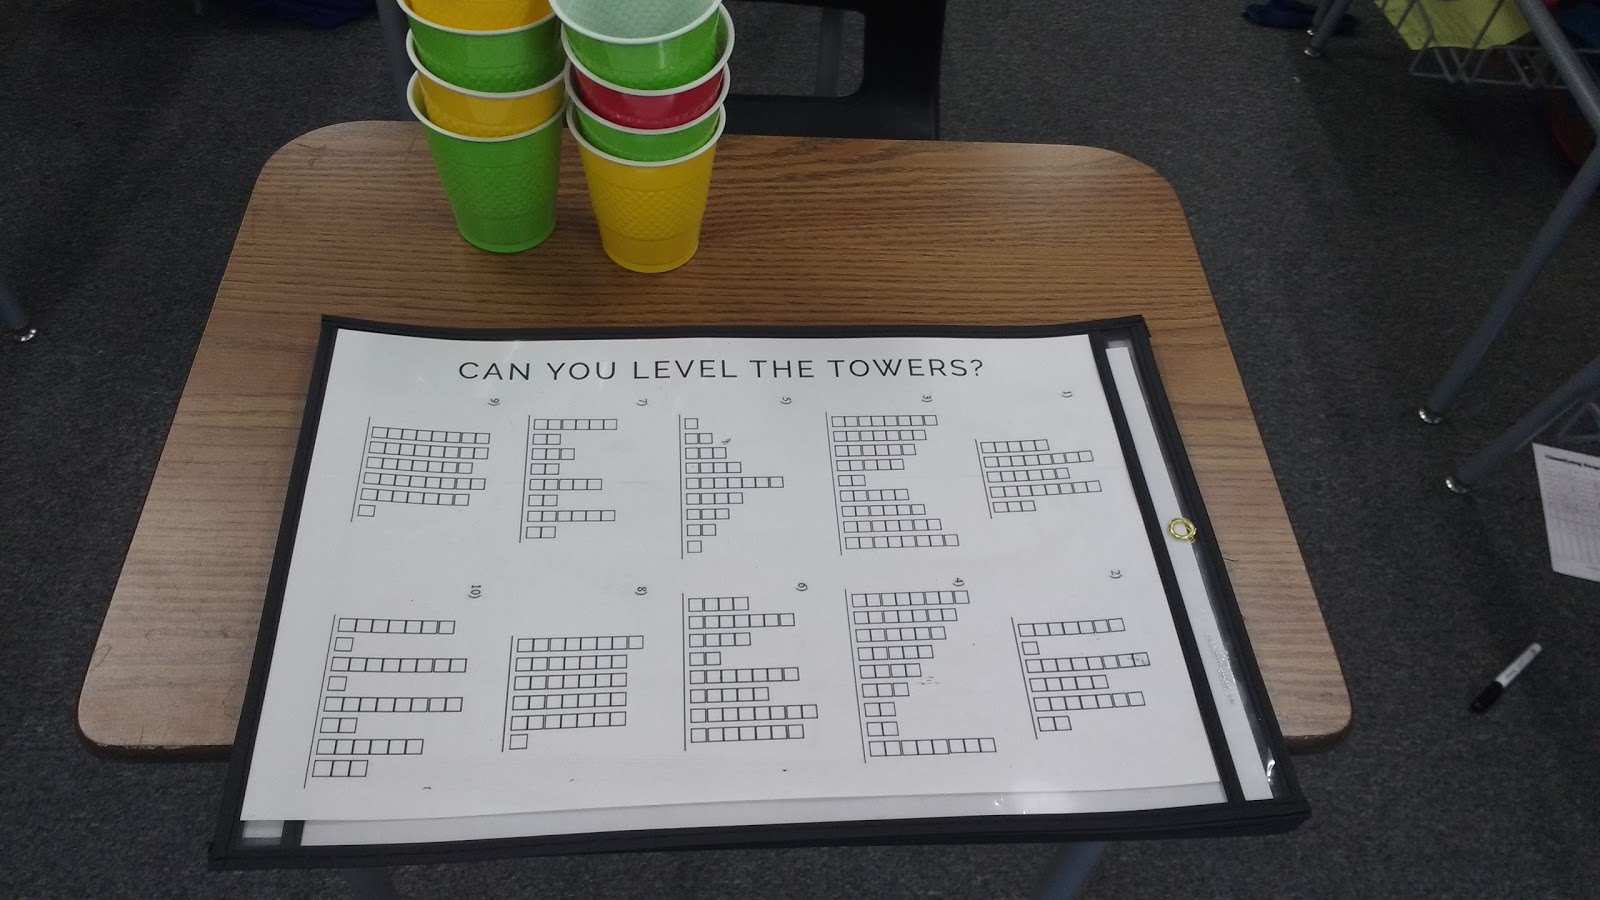
Level the Towers Activity for Introducing Mean
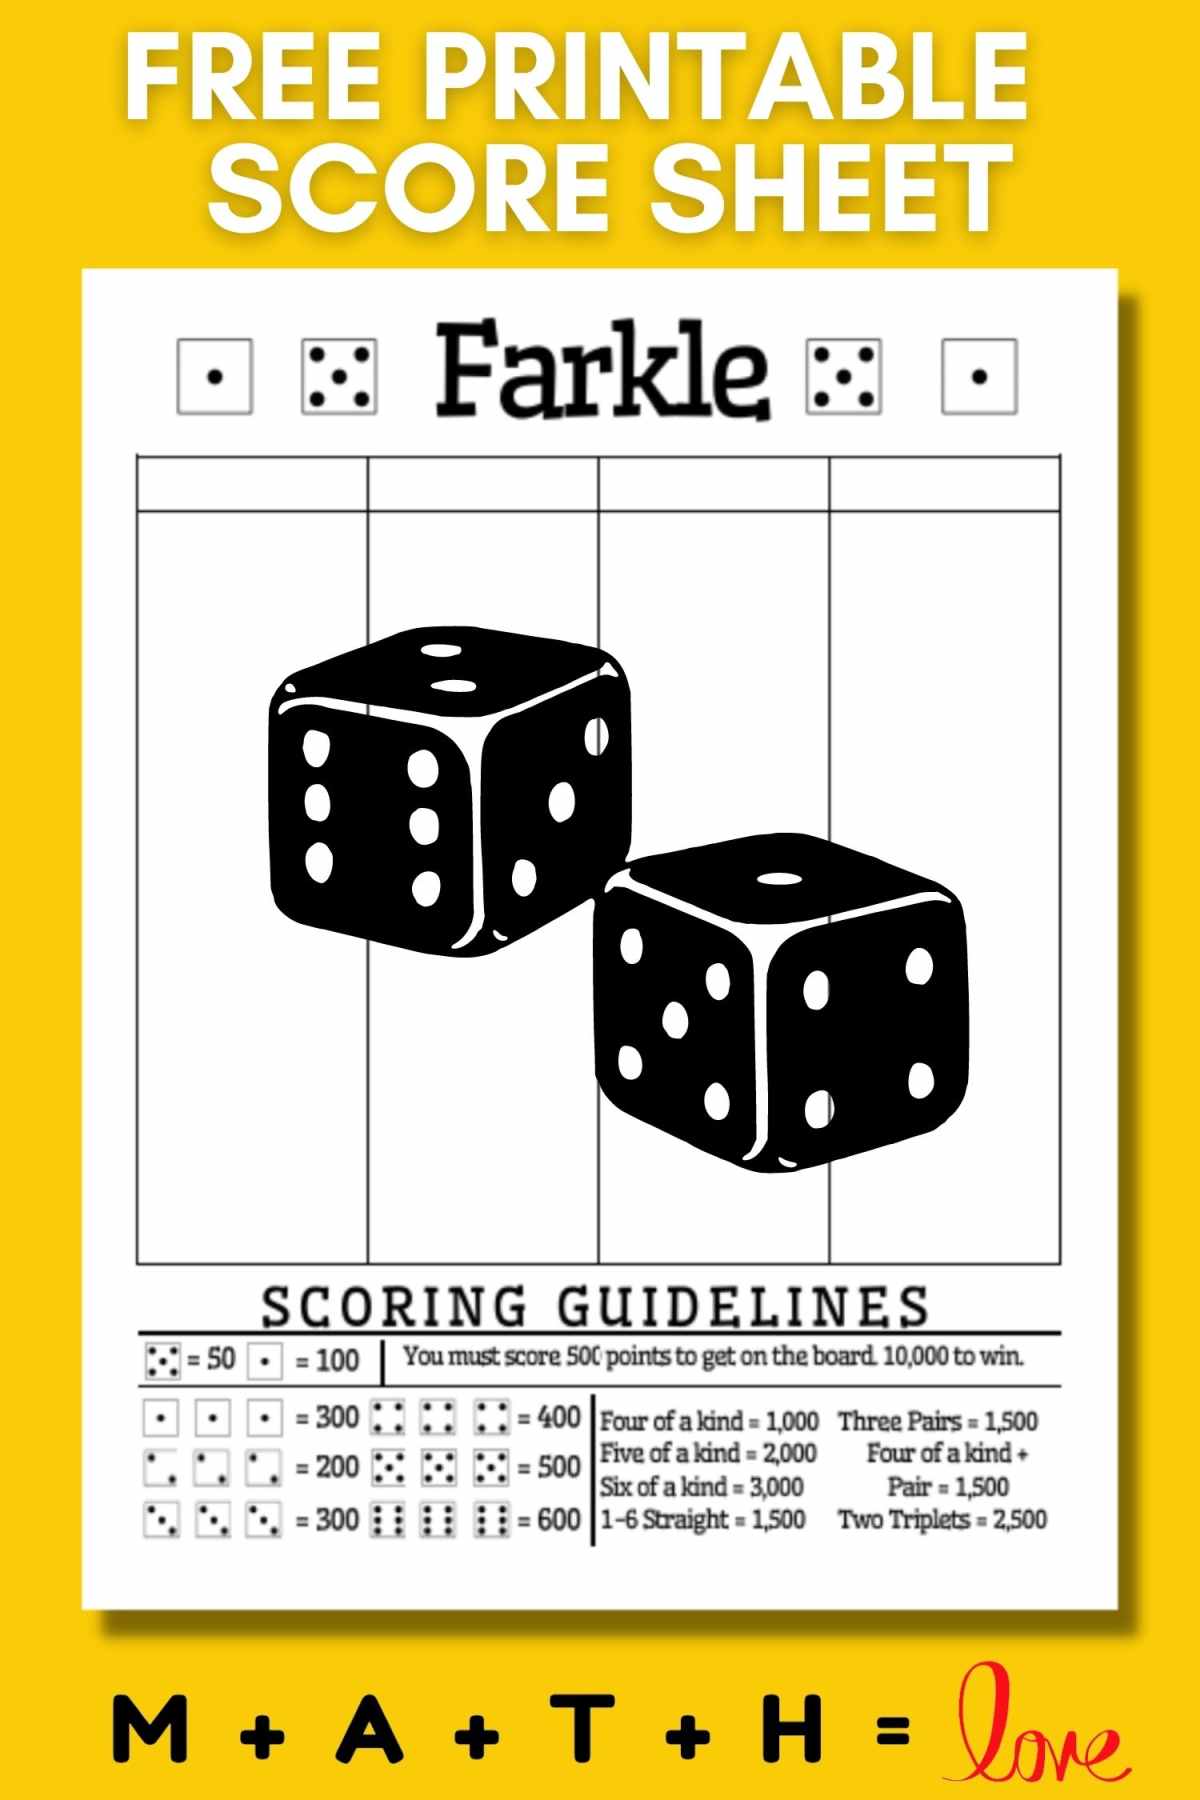
Free Printable Farkle Score Sheet (with Scoring Guidelines)
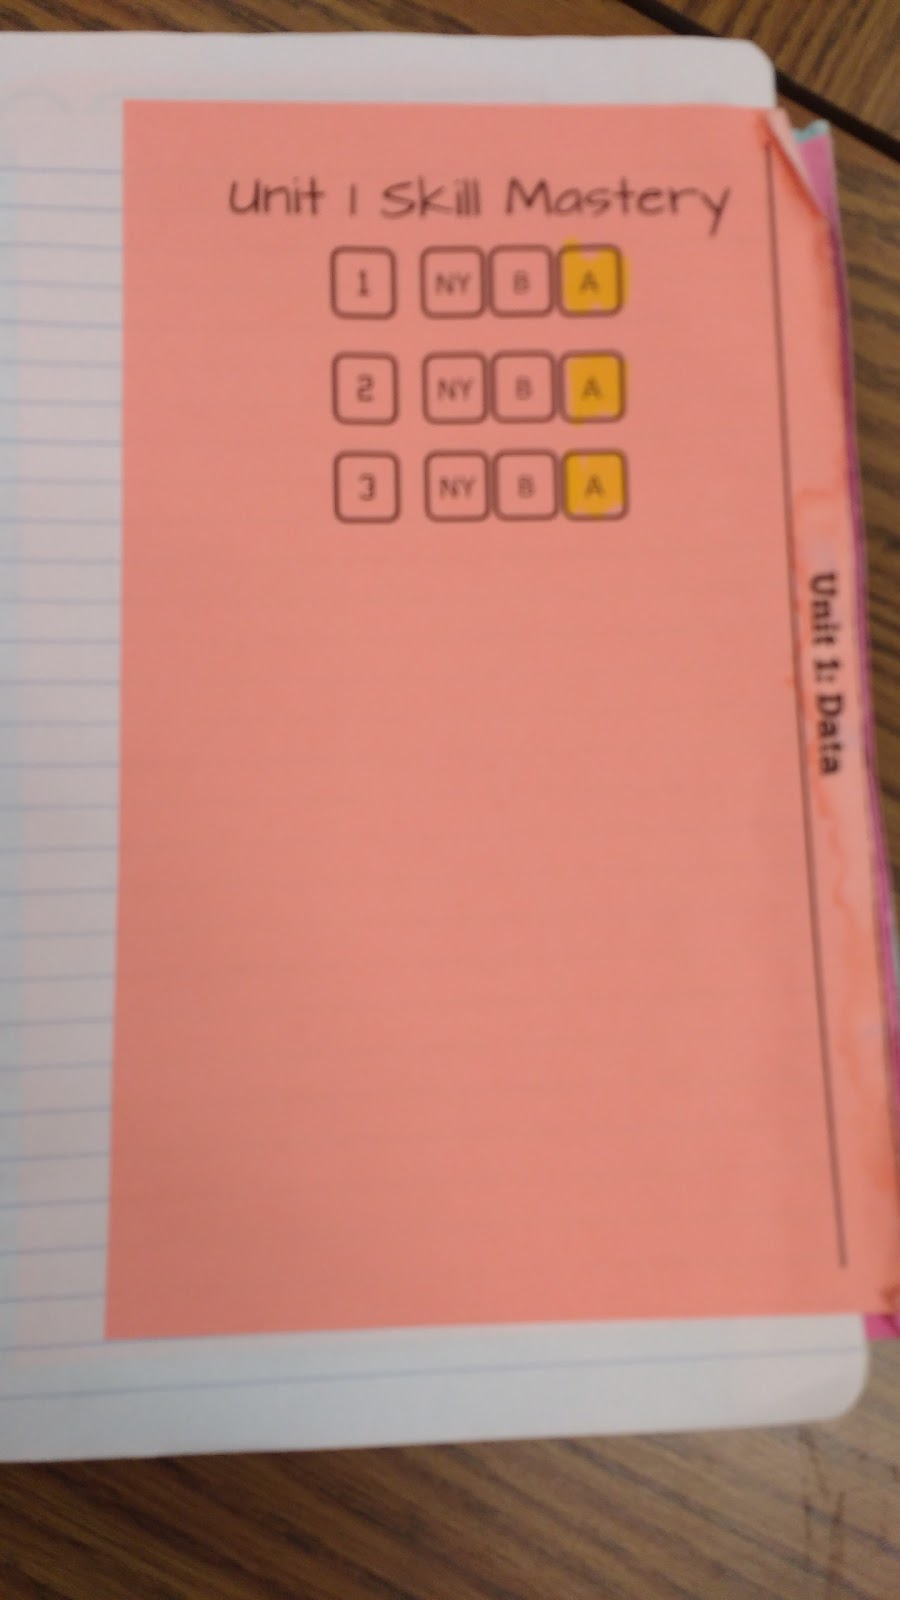
Statistics Interactive Notebook Pages 2015-2016
Statistics Survey Project
Best Line of Best Fit Contest
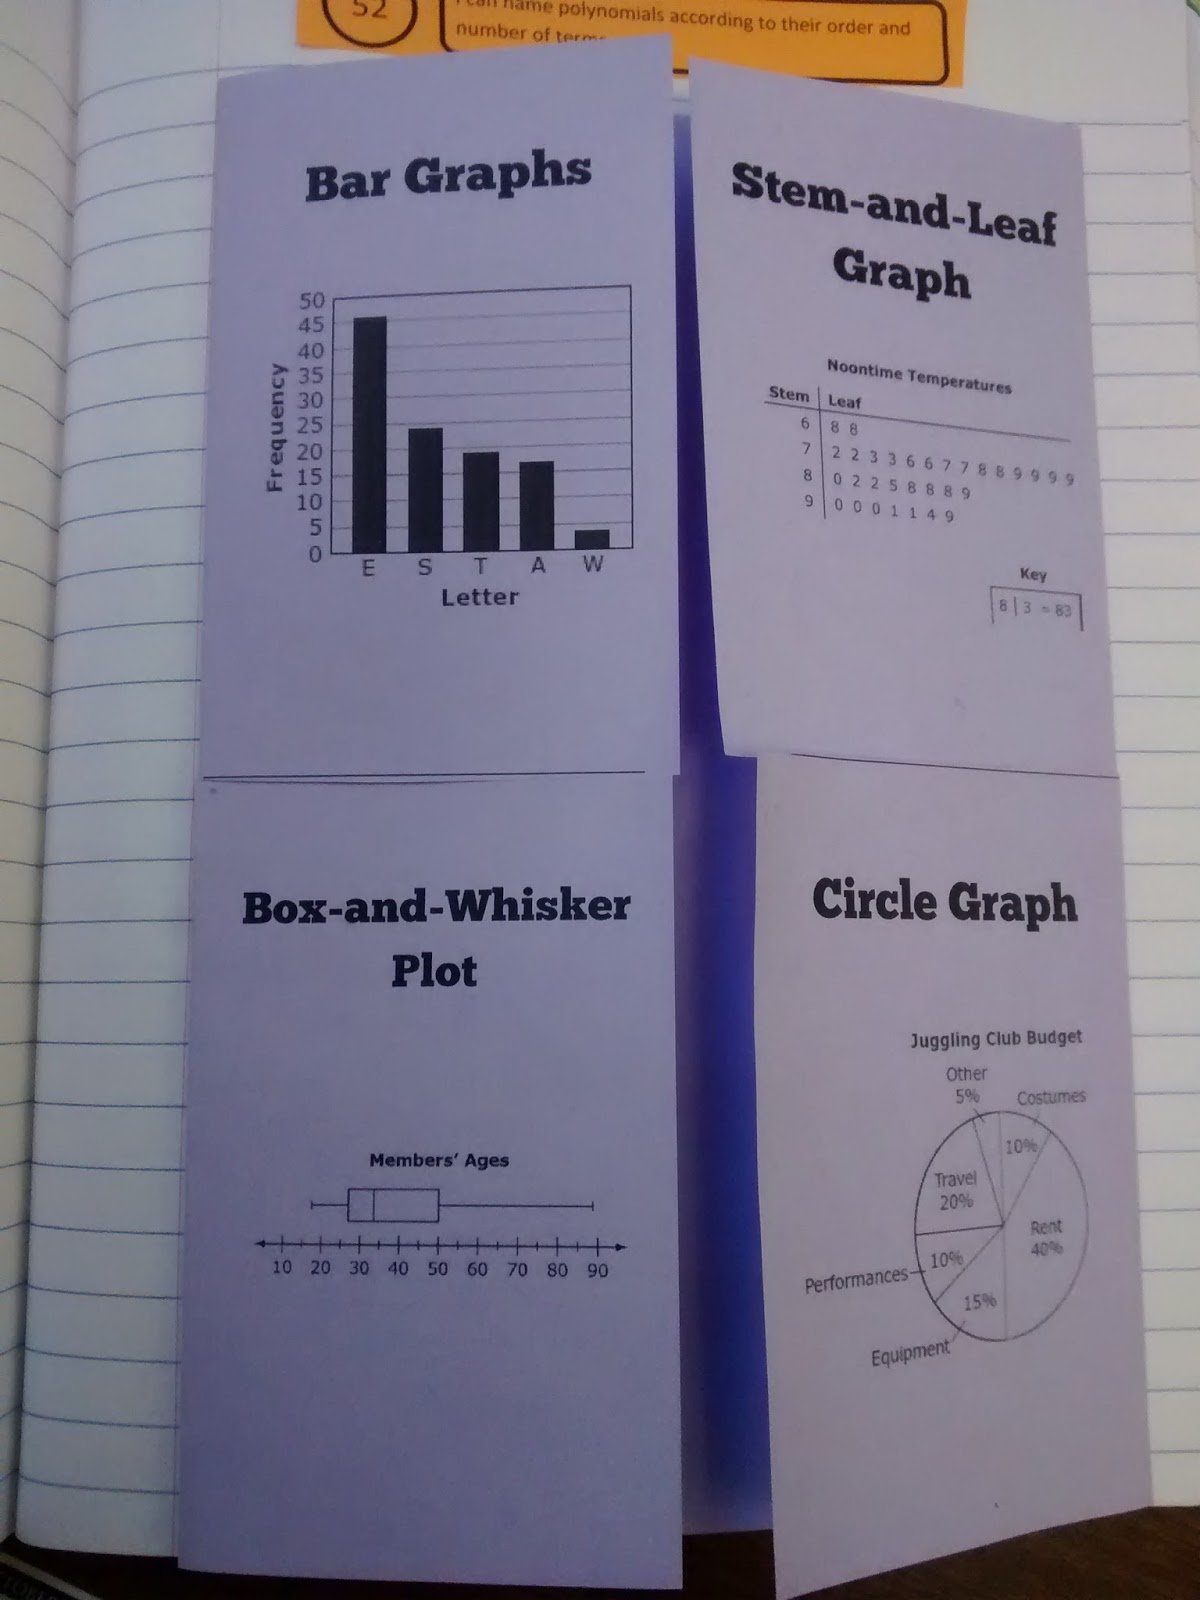
Types of Data Displays Foldable
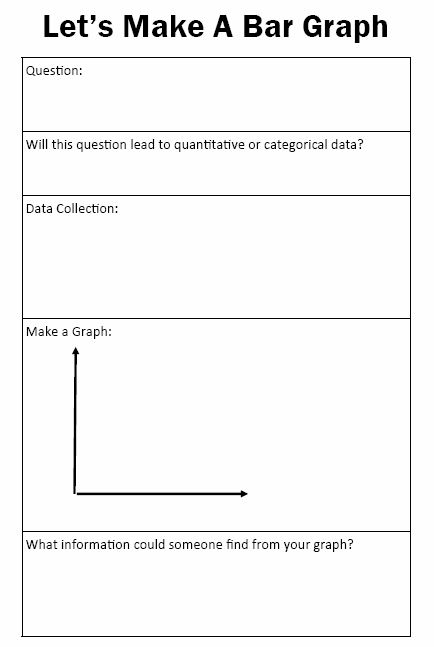
Let’s Make a Graph Activity
Hiring Discrimination Simulation for Statistics
Game of Greed Statistics Foldable
Notes for Introducing Z-Scores
Graphs In The News Statistics Foldable
Page navigation
Previous Page
Previous
1
2
3
Next Page
Next
Scroll to top
Scroll to top
About
Toggle child menu
Expand
About Me
Puzzles
Toggle child menu
Expand
All Printable Puzzles
Math Puzzles
Logic Puzzles
Seasonal and Holiday Puzzles
Word Puzzles
Hands-On Puzzles
Mazes
Puzzle Solutions
Answer Key Database
Resources
Toggle child menu
Expand
Sort by Season or Holiday
Sort by Theme
Sort by Grade Level
Toggle child menu
Expand
Lower Elementary K-2
Upper Elementary 3-5
Middle School 6-8
High School 9-12
Sort by Math Topic
Toggle child menu
Expand
Number & Operations
Algebra & Functions
Geometry & Measurement
Statistics & Probability
Trigonometry
Calculus
Toggle Menu Close
Search for:
Search