Hula Hoop Scatterplot Activity
This hula hoop scatterplot activity gets students moving in math class while learning about how to create a scatterplot and use that scatterplot and linear regression to make predictions.
Five or so years ago before I ever started teaching, I purchased a hula hoop at a yard sale. I paid a whopping 10 cents for it, and I just knew it would make the perfect addition to a math lesson!
My initial idea was to use it in a ratios and proportions lesson, but that never happened. Instead, it spent most of its life hanging out between a wall and a filing cabinet.
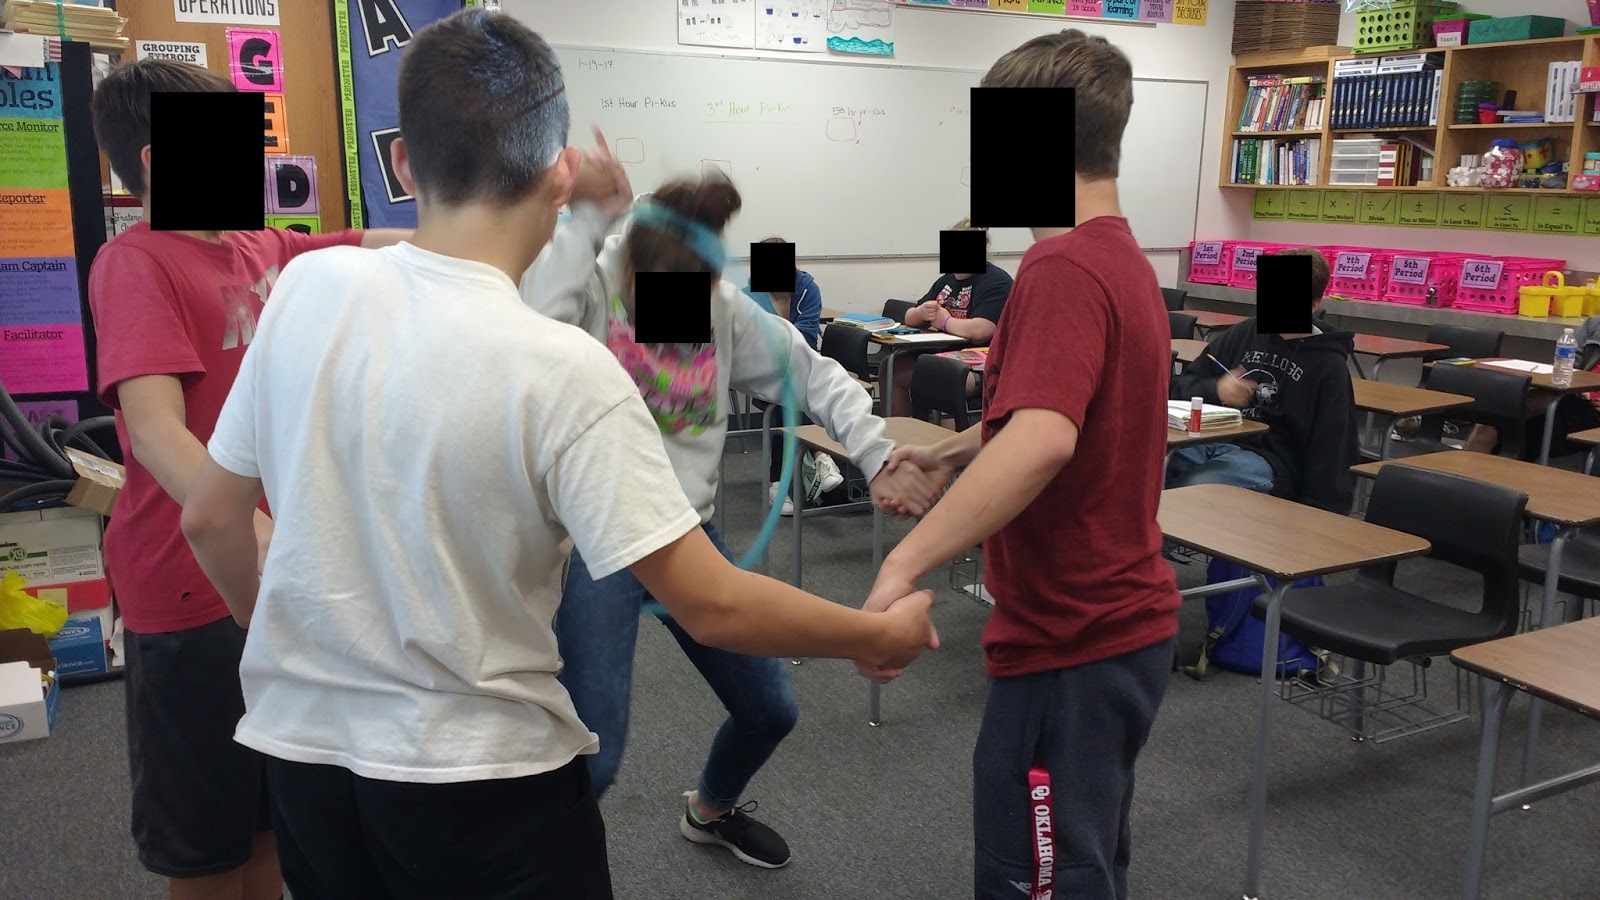
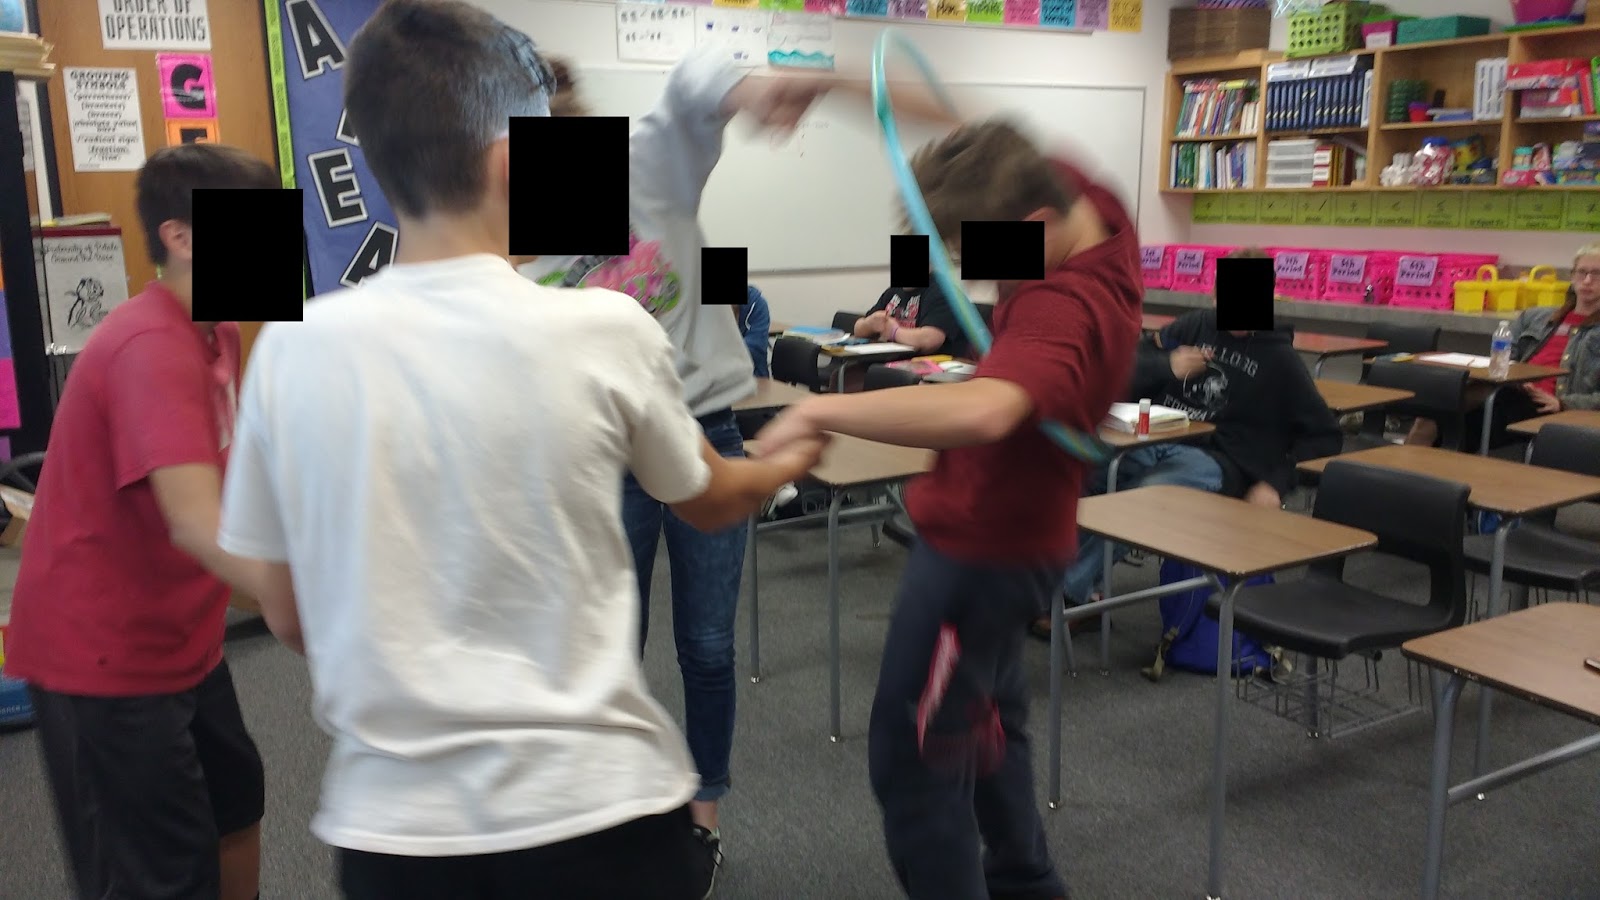
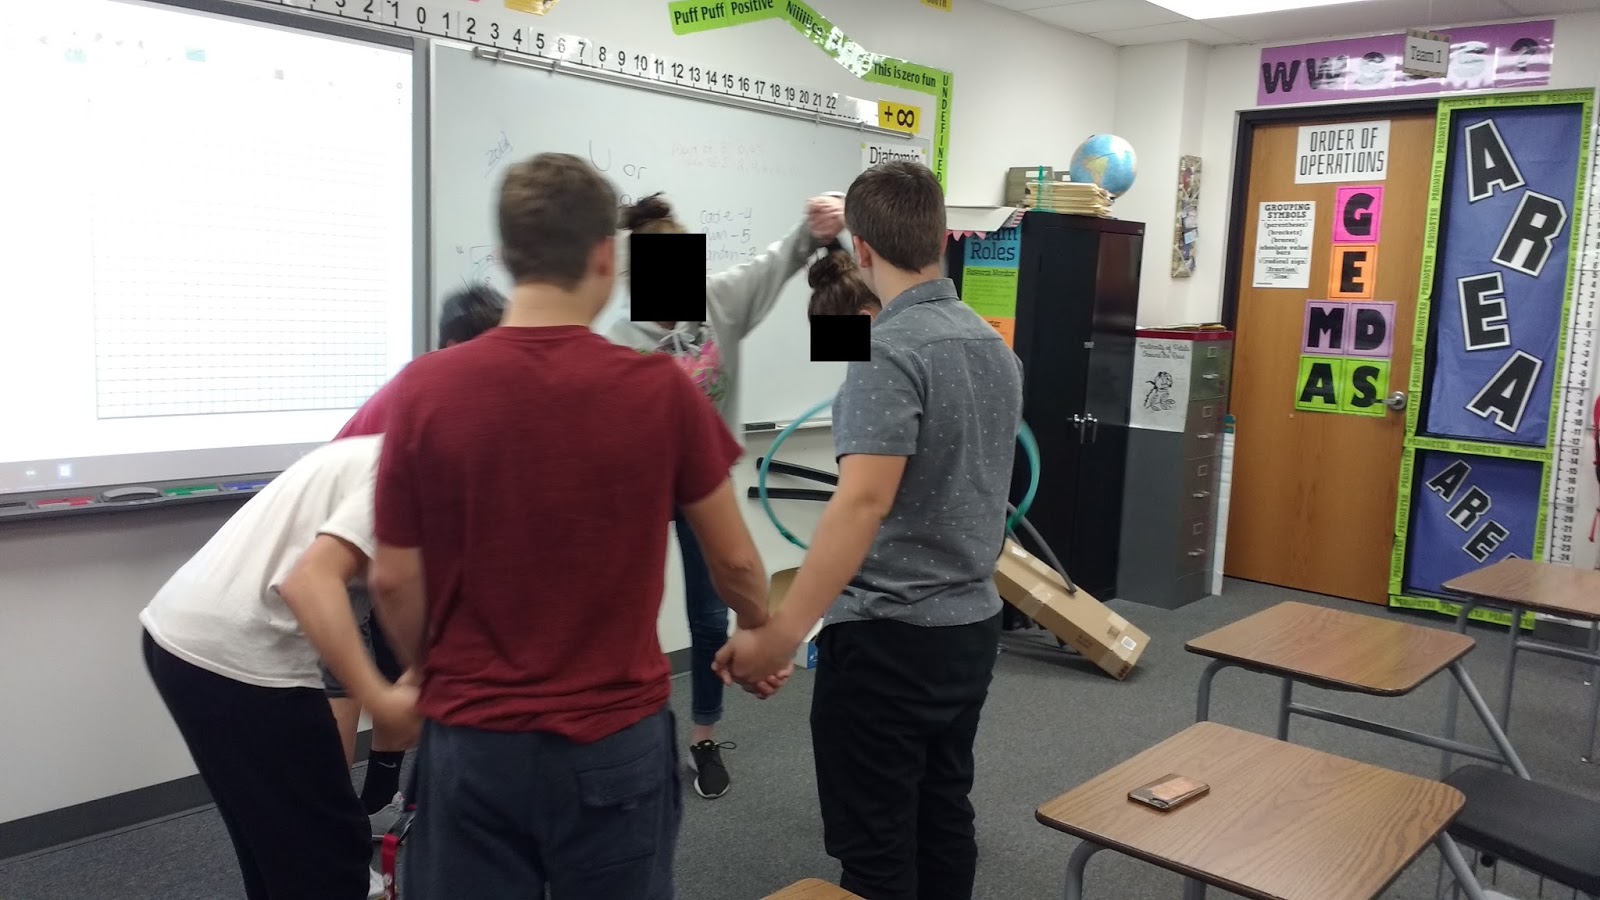
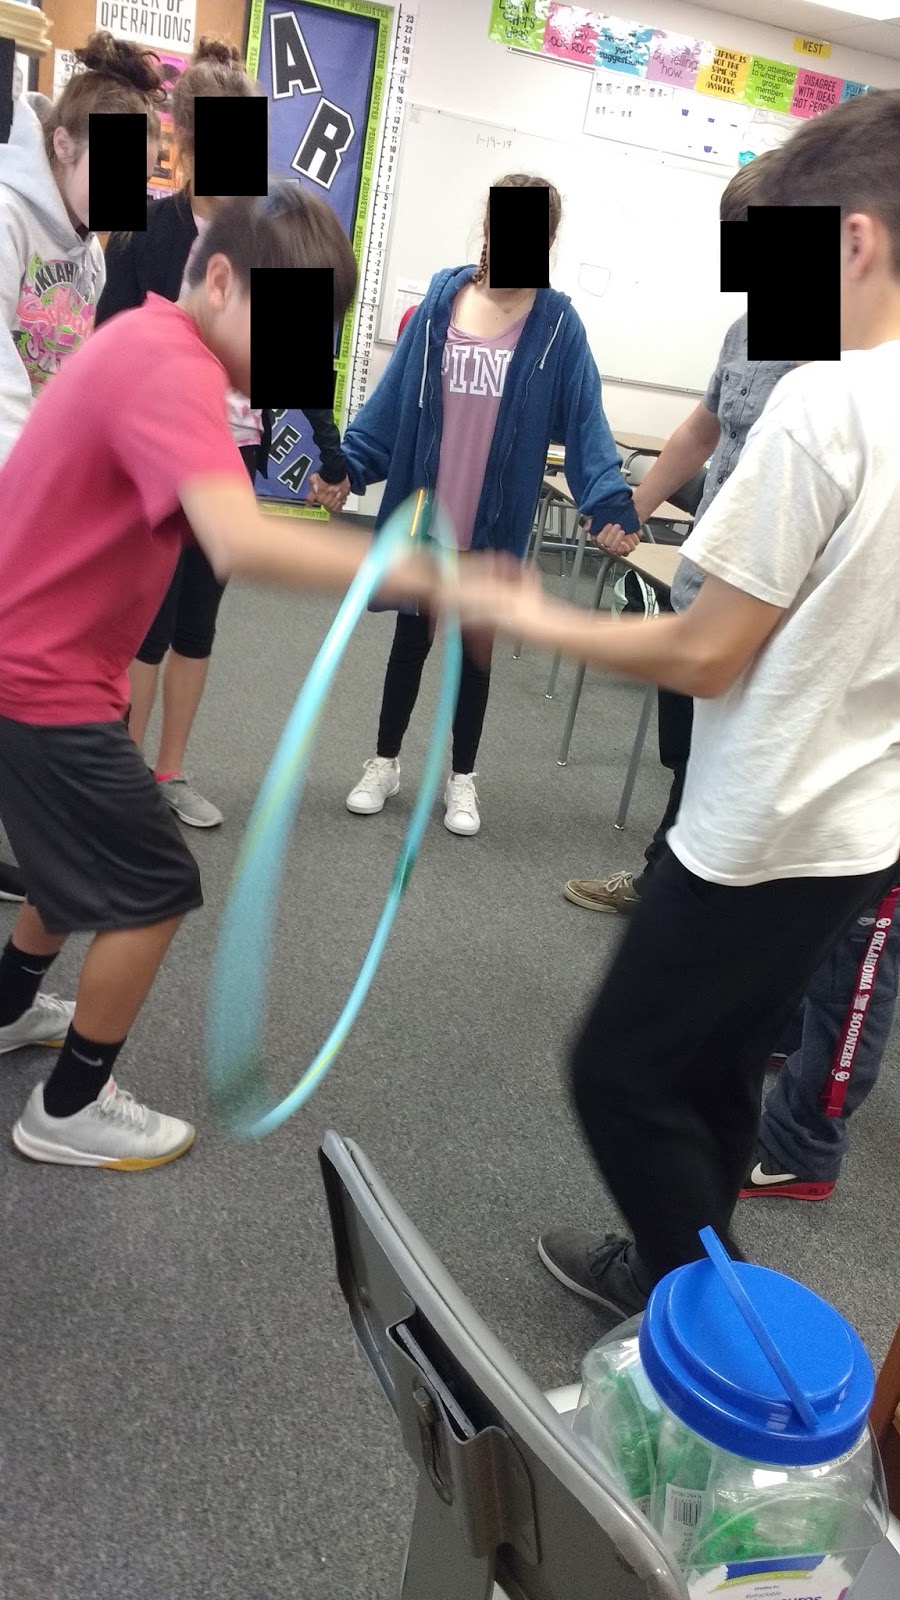
This year, though, it made its classroom debut in a hula hoop relay race for one of our lessons on scatter plots. Hula hoop relays are often used as team-building activities. The main idea is that all of the participants join hands to form a large circle. A hula hoop must be passed around the circle which each player stepping in and out of the hula hoop to pass it to the next person. Hands must stay interlocked at all times. Still confused? I found this description and illustration of the game.
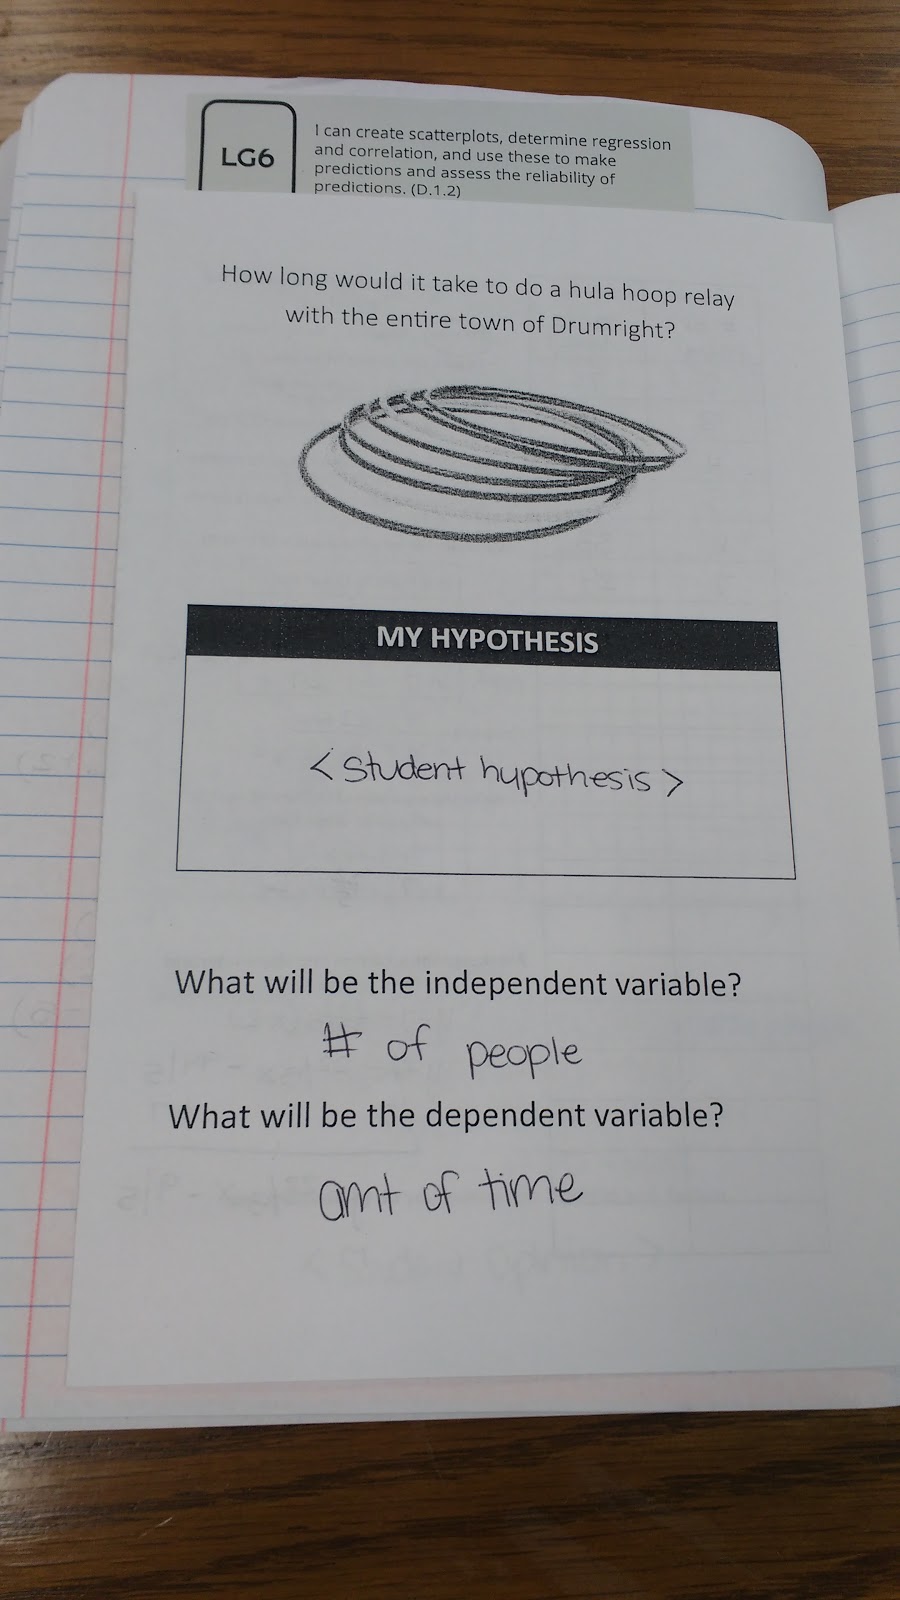
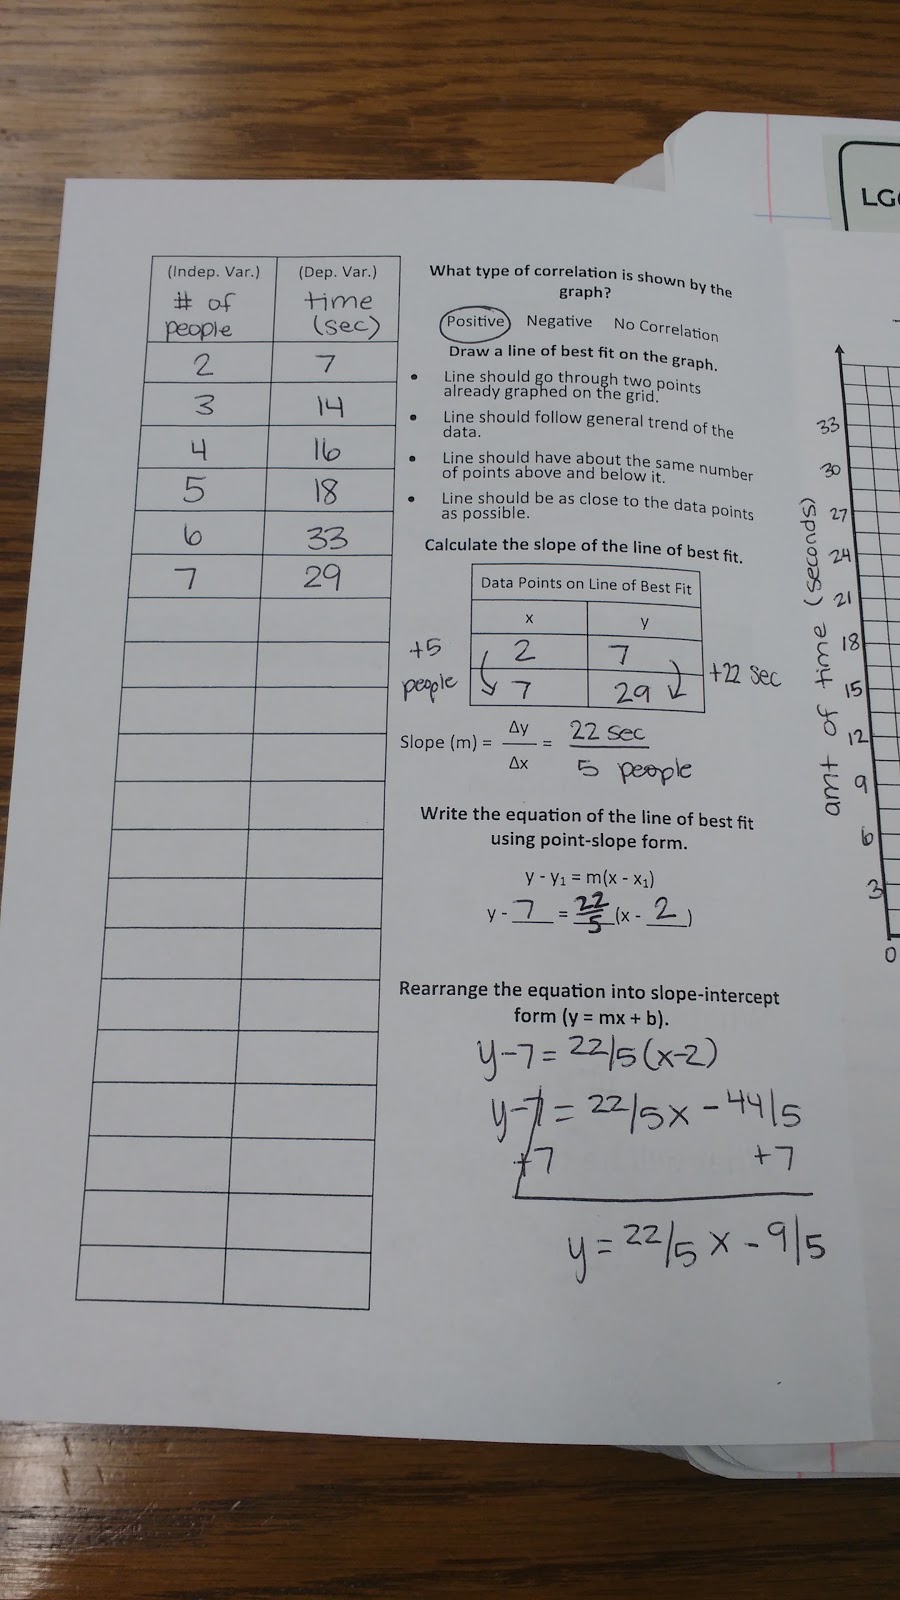
I prepared a note-taking sheet for my students to glue in their interactive notebooks.
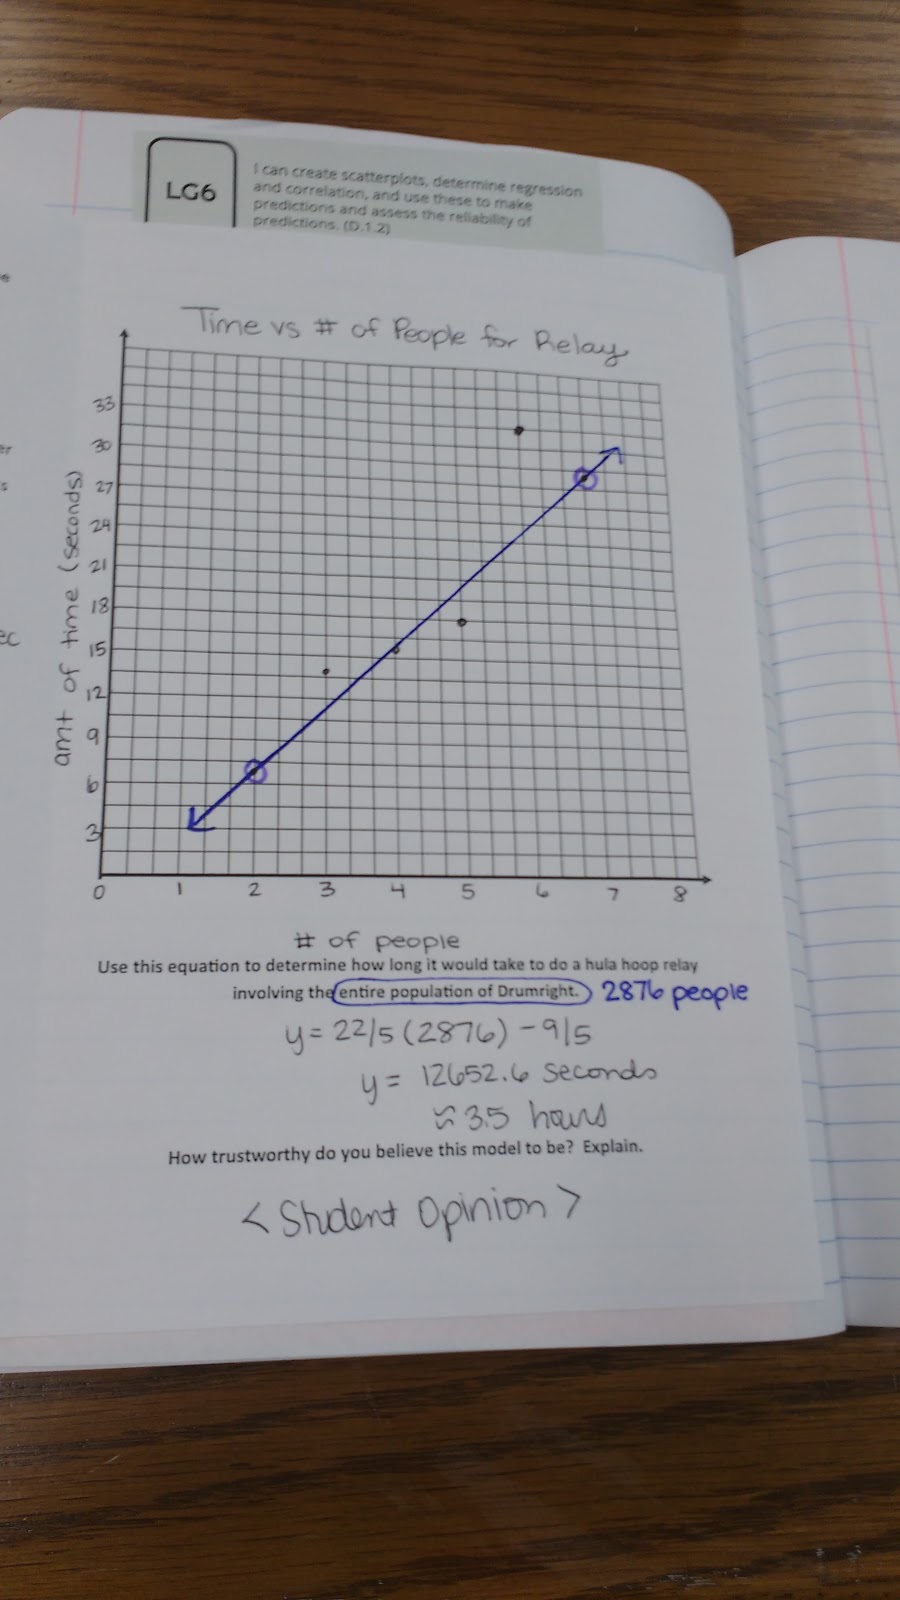
First, I had them make a hypothesis regarding the length of time it would take to do a hula hoop relay with our entire town.
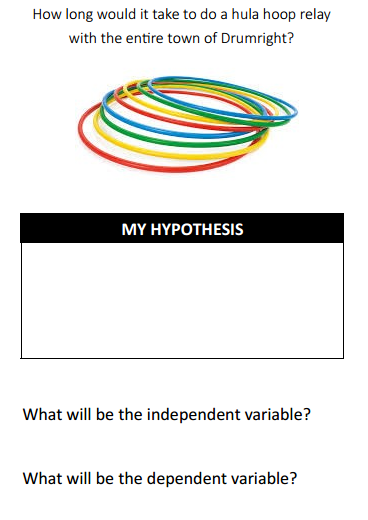
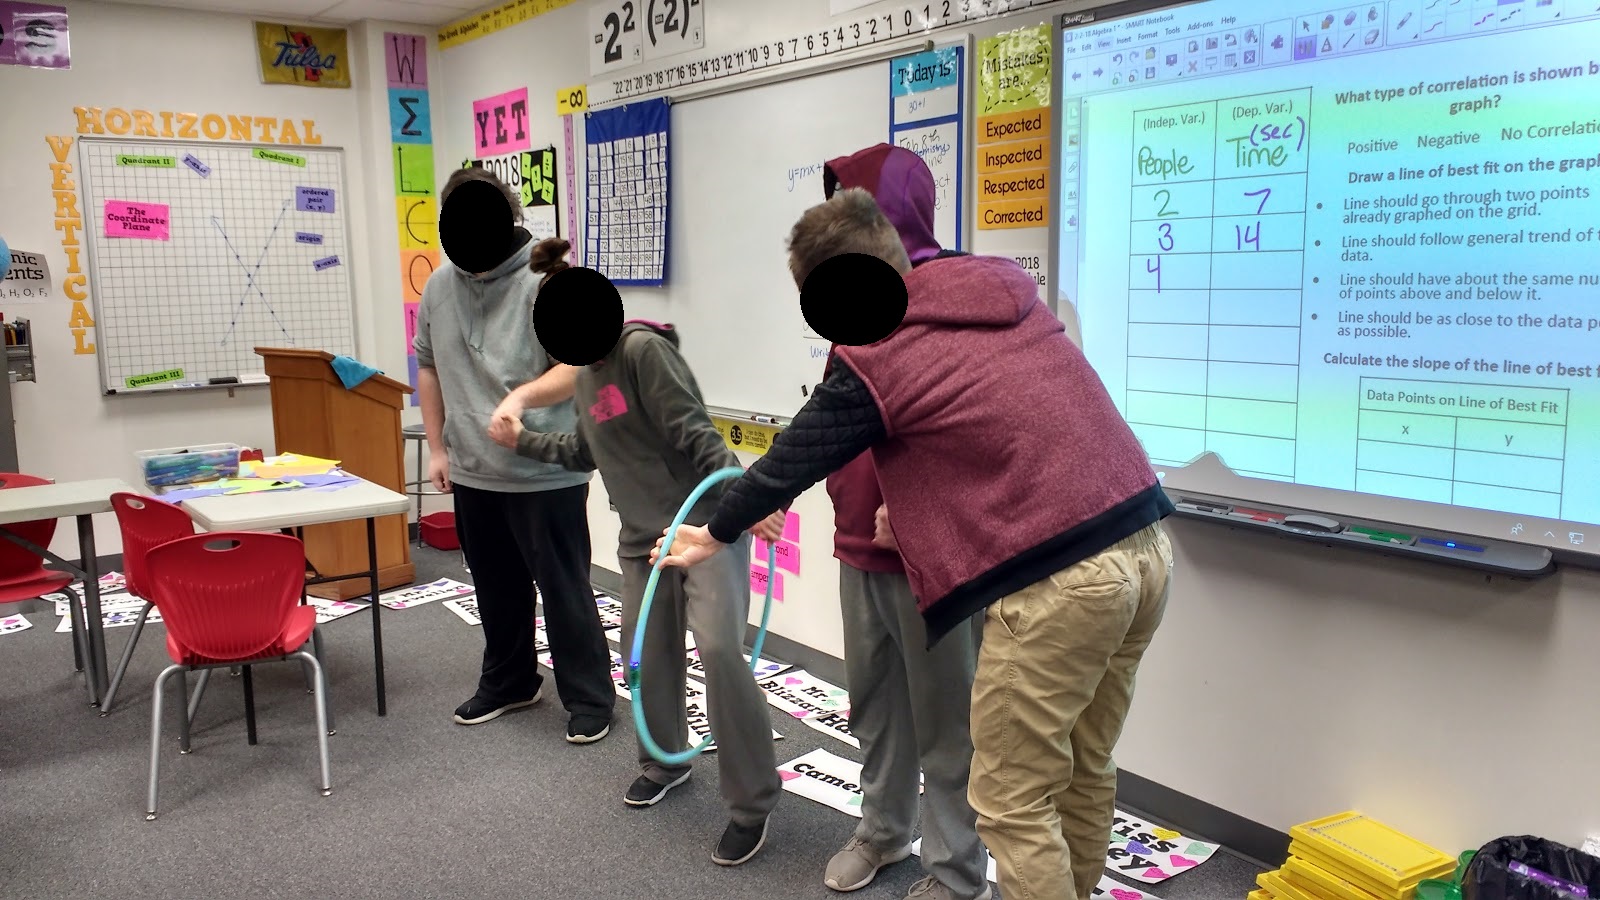
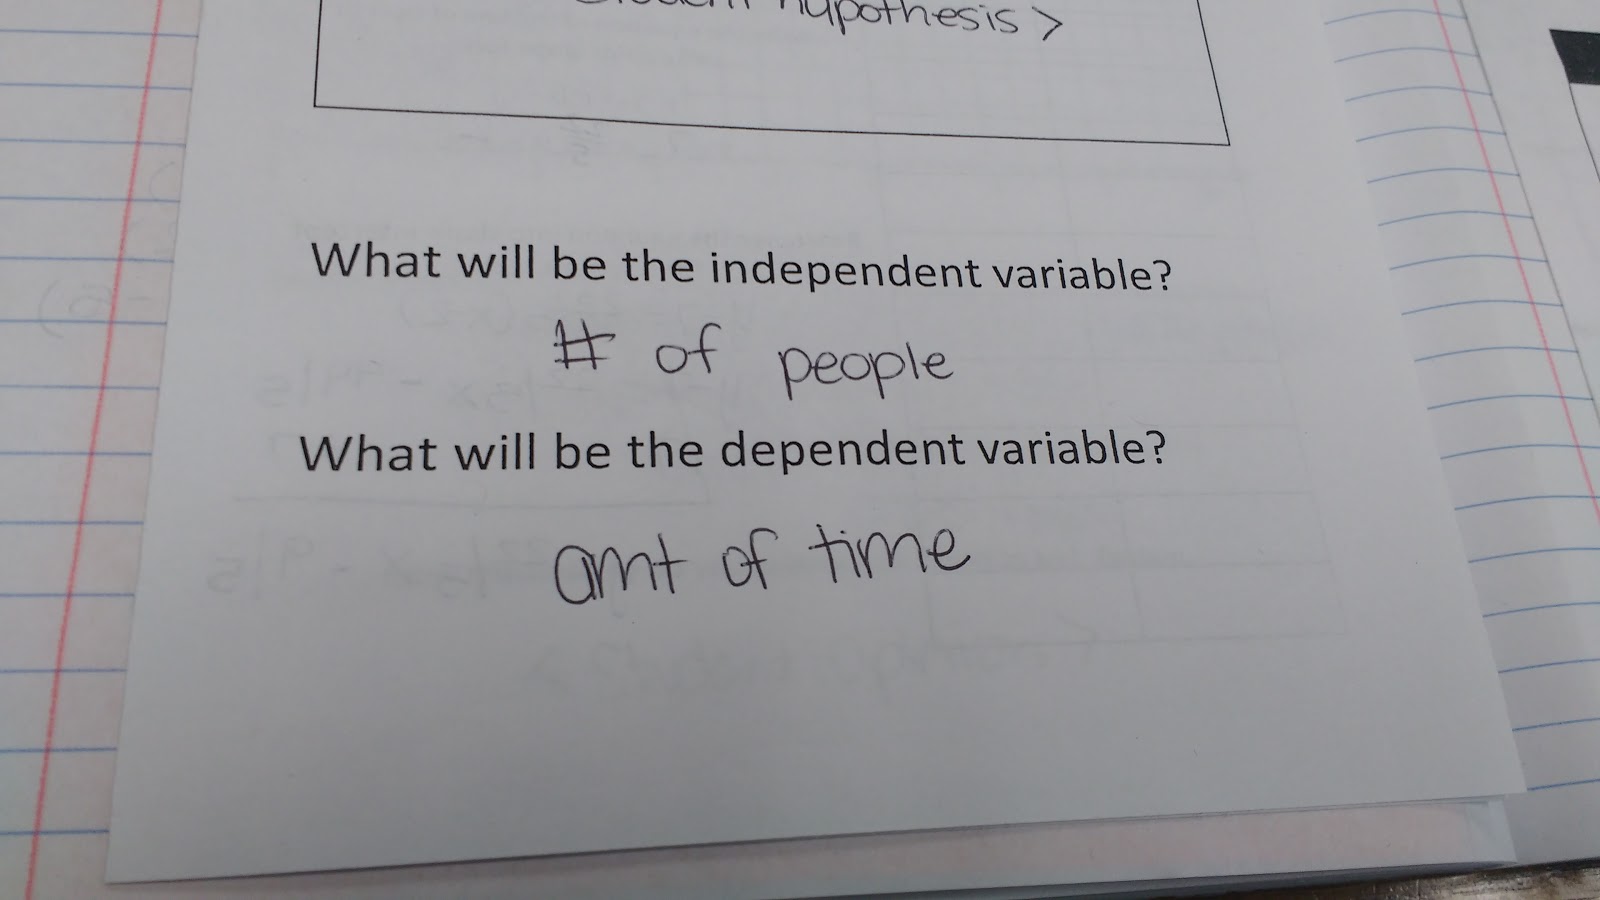
After determining that our independent variable was number of people and the dependent variable was time, we started collecting data with different numbers of people in the circle.
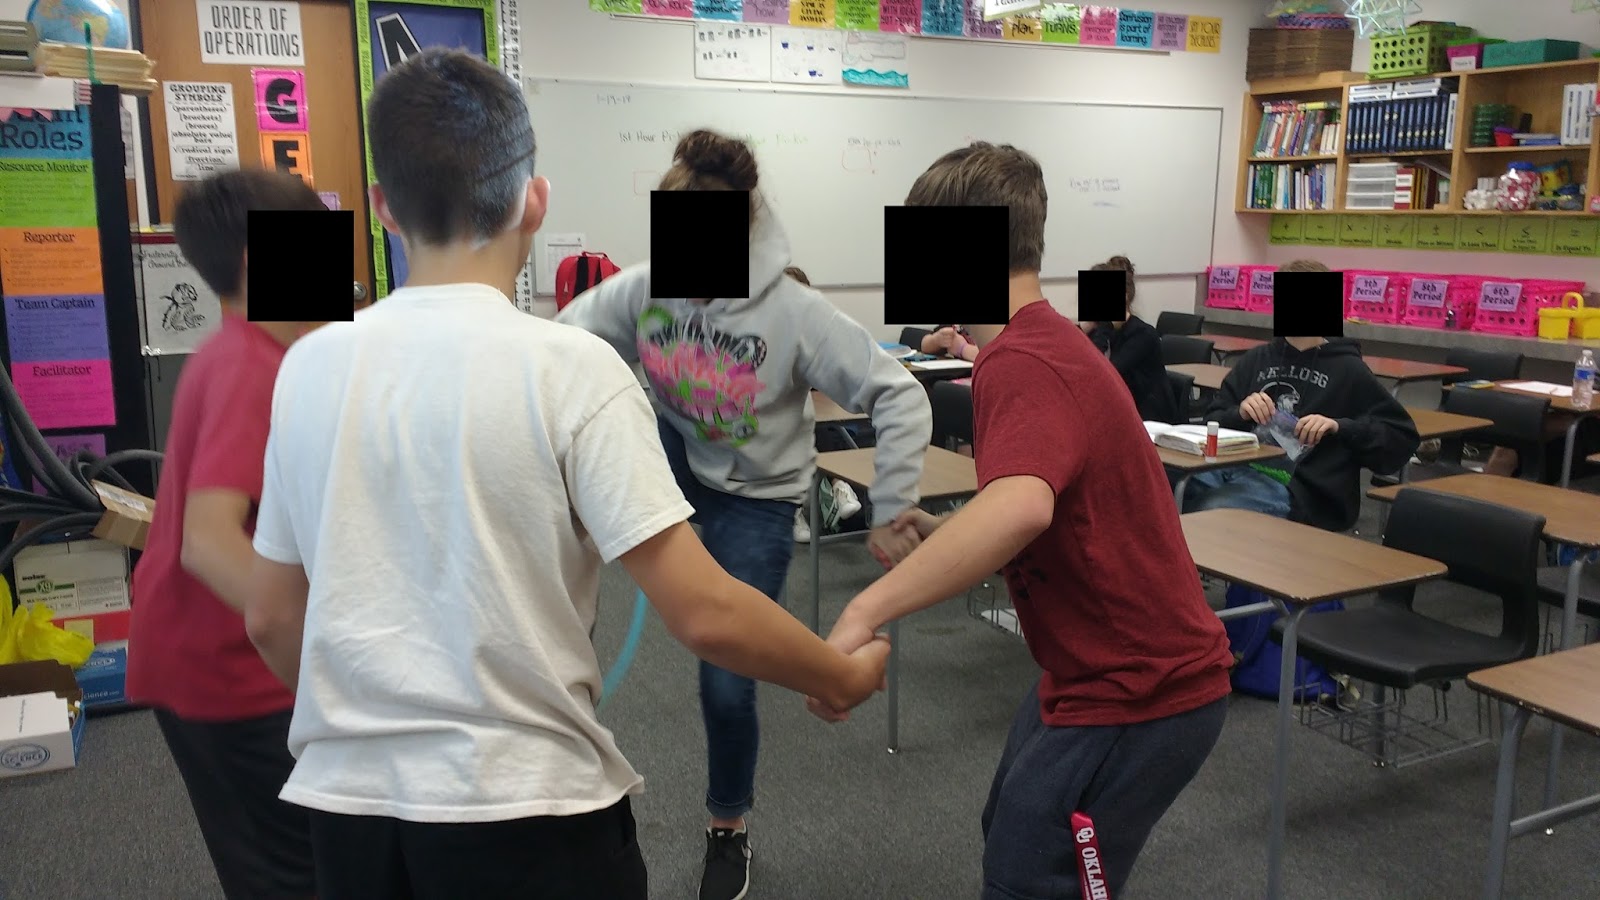
My kids had a TON of fun with this hula hoop scatterplot activity! I make it a policy to never include photographs that show students’ faces on my blog or twitter, but I have to say it was hard to hide their faces in these photos. There was just an expression of pure joy on each face. They were grinning from ear-to-ear in math class. You can’t beat that!
Here are some action pictures. This was a really hard activity to photograph because there was constant motion!
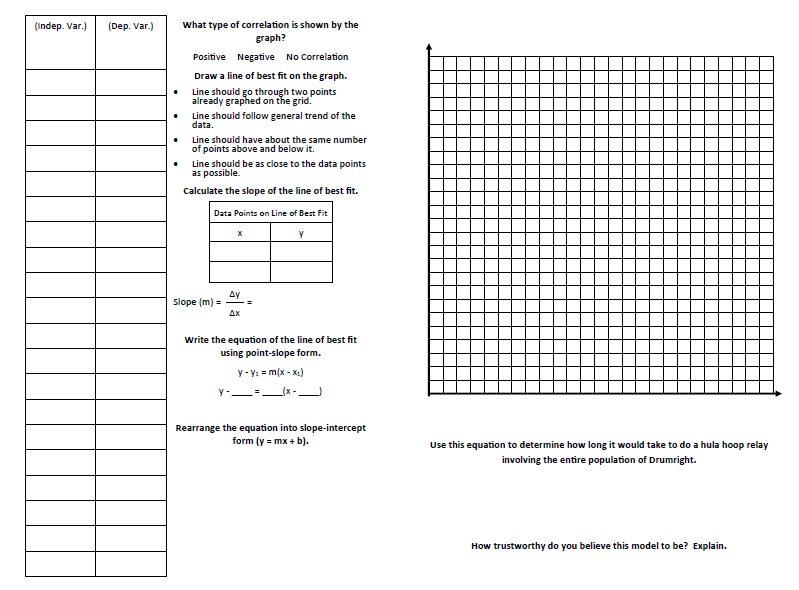
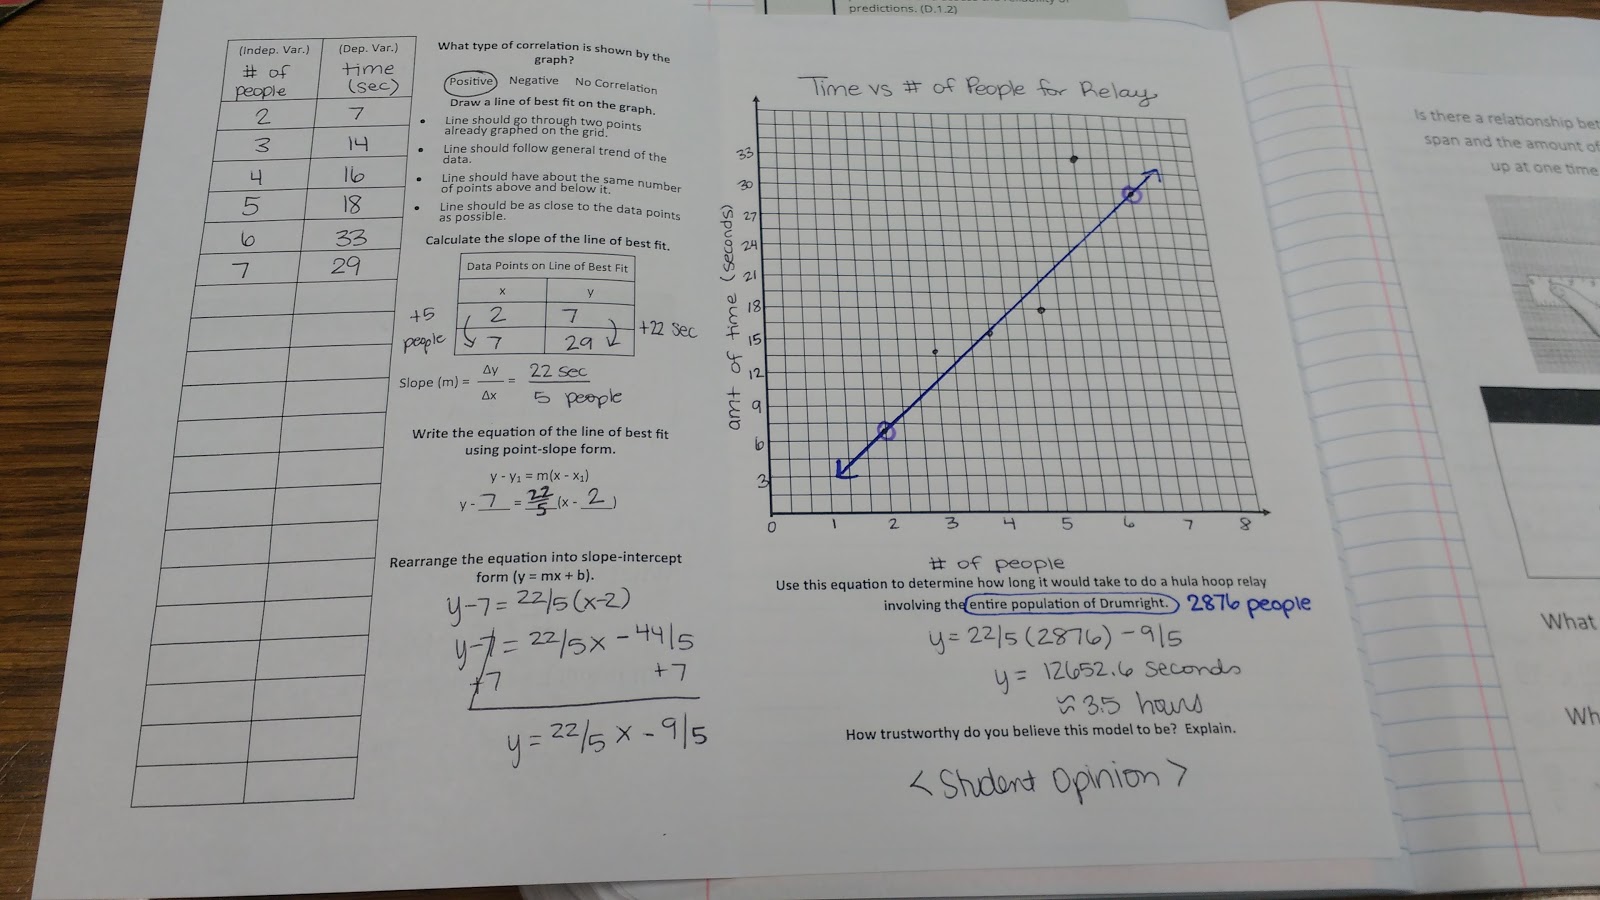
After collecting what the class decided to be a sufficient number of data points, we made a scatter plot of our data. We used this scatter plot to find a line of best fit by hand. Then, we used the equation for this line of best fit to determine how long it would take us to do the hula hoop relay with the entire town.
There was some debate about the size of Drumright. One student did a bit of googling and found that the population in 2014 was 2883. One student insisted that this data was out of date. The population of Drumright was now 5,000. Another student insisted that this data could not be right at all. She thought that the town only had a population of around 600. I found these conversations to be very interesting. Eventually, the class did decide to use the data value from 2014.
I was surprised by how different the results were from my two classes that did this activity. The first class ended up with an estimate of 2.5 hours for the entire town to complete the relay. The second class really struggled with the hula hoop relay. I think this was probably due to the fact that there was a BIG difference in students’ heights in the circle which made it much trickier for them to complete the relay. They ended up with an estimate of over 7 hours for the entire town to complete the relay.
I LOVED the discussion that resulted from asking my students to rate the trustworthiness of their model and estimate. Students were eager to point out potential problems. What about the elderly? They wouldn’t be able to bend over enough to get through the hula hoop. What about people in wheel chairs? Then, we started talking about how it would work with kids. Kids up to a certain age would be able to just step through the hula hoop without any issue at all.
I definitely look forward to using this activity again in the future!
In 2018, I did this hula hoop scatterplot activity again with my Algebra 1 students.
My four classes got vastly different results with their results when they substituted the population of Drumright into their lines of best fit. Some classes were averaging ~2 seconds/person. Others were averaging more like ~7 seconds/person. This led from students calculating anywhere from 4 hours to 7 hours for the entire town. My students had hypothesized it would take as much as 4 days or 10 days to complete the relay. Of course, they brought up the fact that the demographics of the entire town do not match the demographics of our class. What about the elderly? What about someone in a wheel chair? What about a toddler that can’t stand still? It was great to hear the thoughtful conversations students were having about the model we created!
I can't even express how cool this lesson is. Going to save this for next year, maybe those days when only a few kids show up and I wish I could reward them somehow.