Graphing Absolute Value Foldable
After introducing absolute value with a guess the age activity, my Algebra 1 students completed this graphing absolute value foldable in their interactive notebooks.
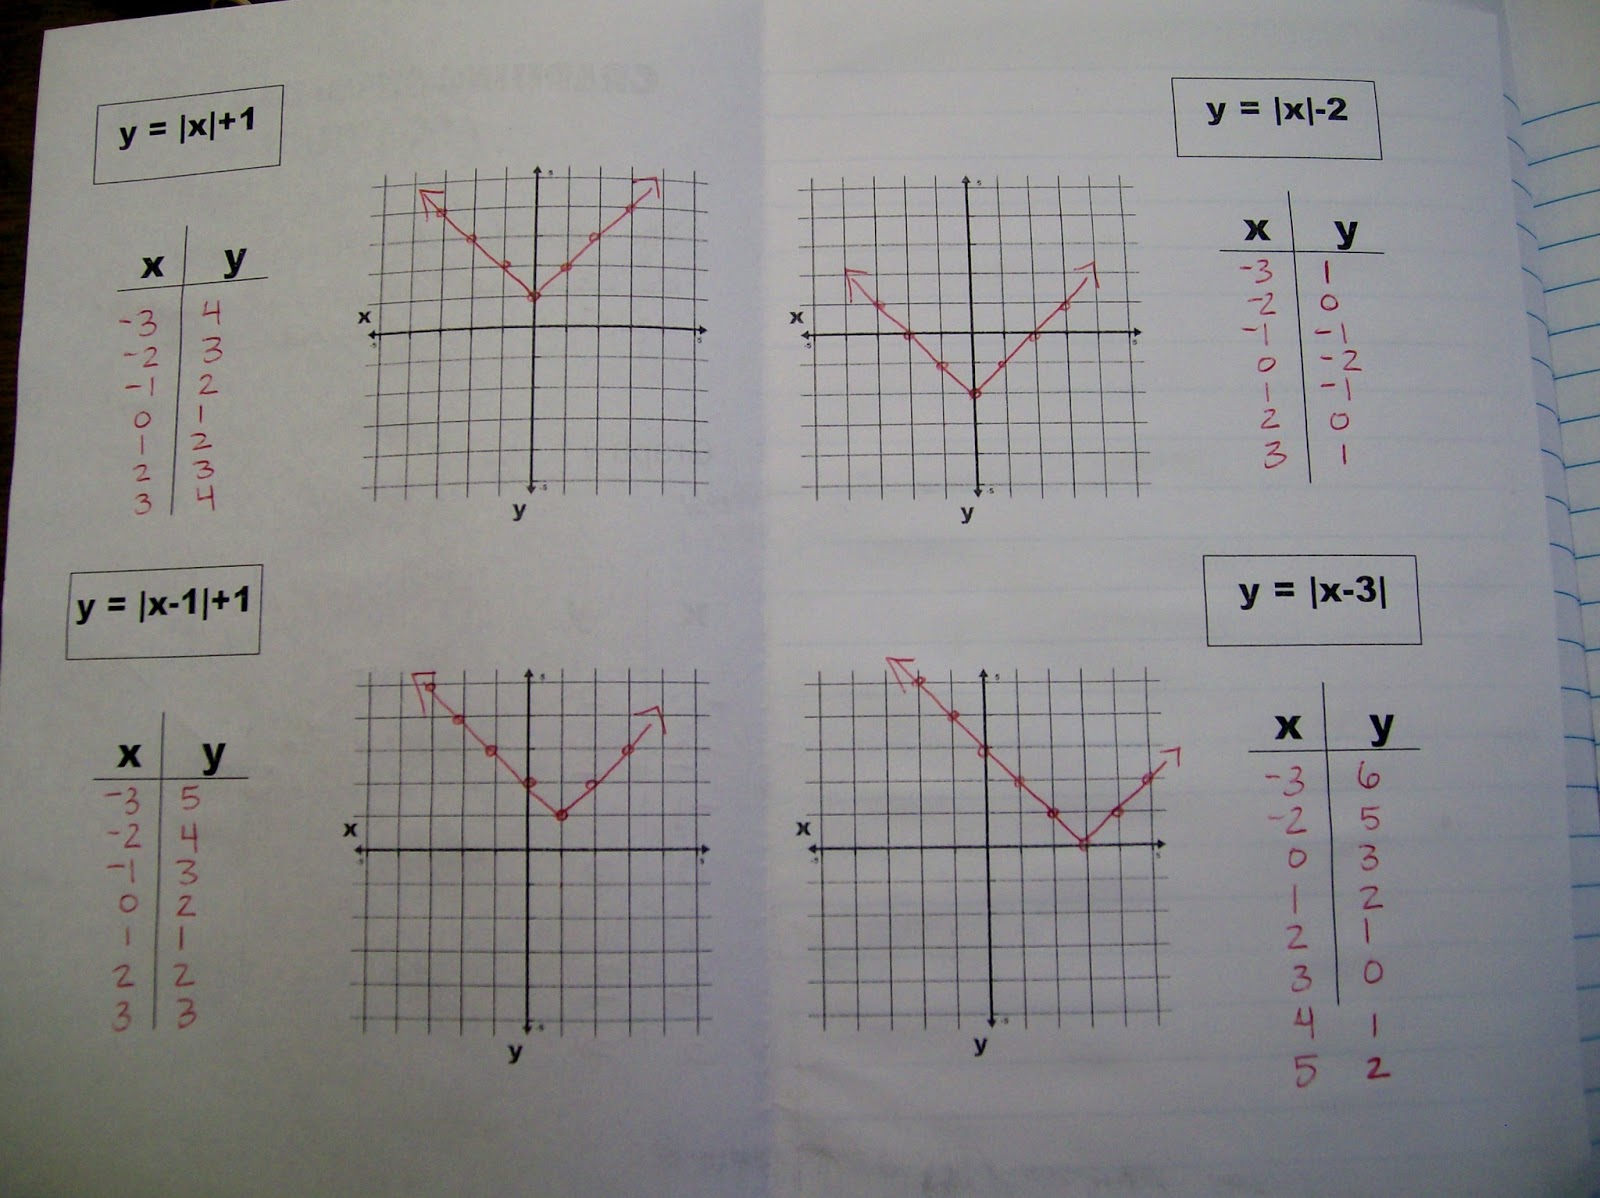
I had my students create the absolute value graphs by first substituting in values and creating a t-chart of points to graph on the coordinate plane. As a class, we graphed 5 absolute value equations together in our graphing absolute value foldable. Then, I gave them 6 more to complete in-class on their own.
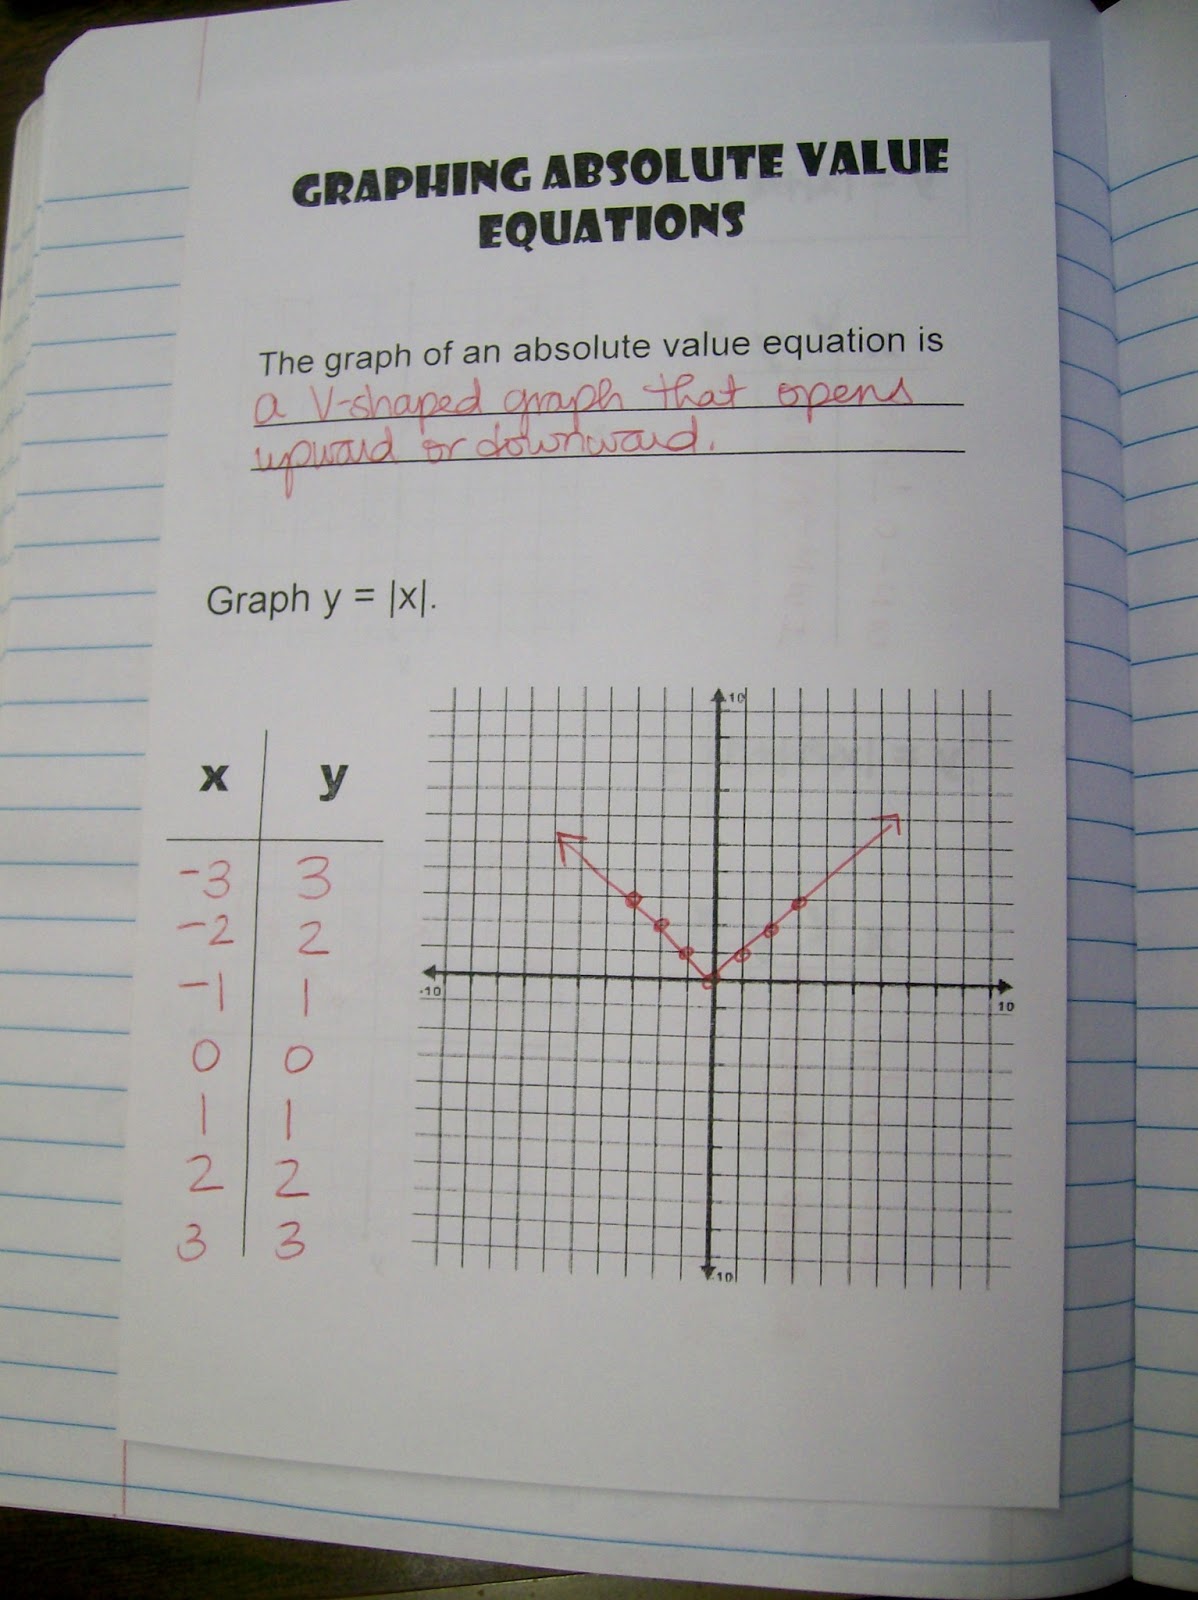
We had some great conversations while graphing these. It was exciting to see them discover that absolute value equations form a “V” when graphed. I intentionally had them graph y = |x| and see the shape for themselves before writing the definition of absolute value equations on the cover. Initially, some students assumed that they must have did something wrong since the graph wasn’t a straight line.
We talked a lot about why the y-values for some graphs could be negative. Eventually they realized that it made a big difference whether the subtraction happened inside the absolute value bars or outside the absolute value bars. I’ve been trying to incorporate more foldables into this semester. Last semester, I did a ton of foldables. I kind of stopped for a few weeks this semester. I think it was a mixture of feeling uninspired / rushed. I think all of my students love foldables, but they are really crucial to the success of my IEP students. These students need examples to look out. They need a reference to remind them what steps to take.
I think next time I teach this unit, I want to have my students write out more of the steps that you go through to take your input x to reach the output y. Because this doesn’t capture that process, it is not an amazing resource for my IEP students or students who were absent the day we went over this lesson.
We followed this up with a graphic organizer over transformations of absolute value functions.