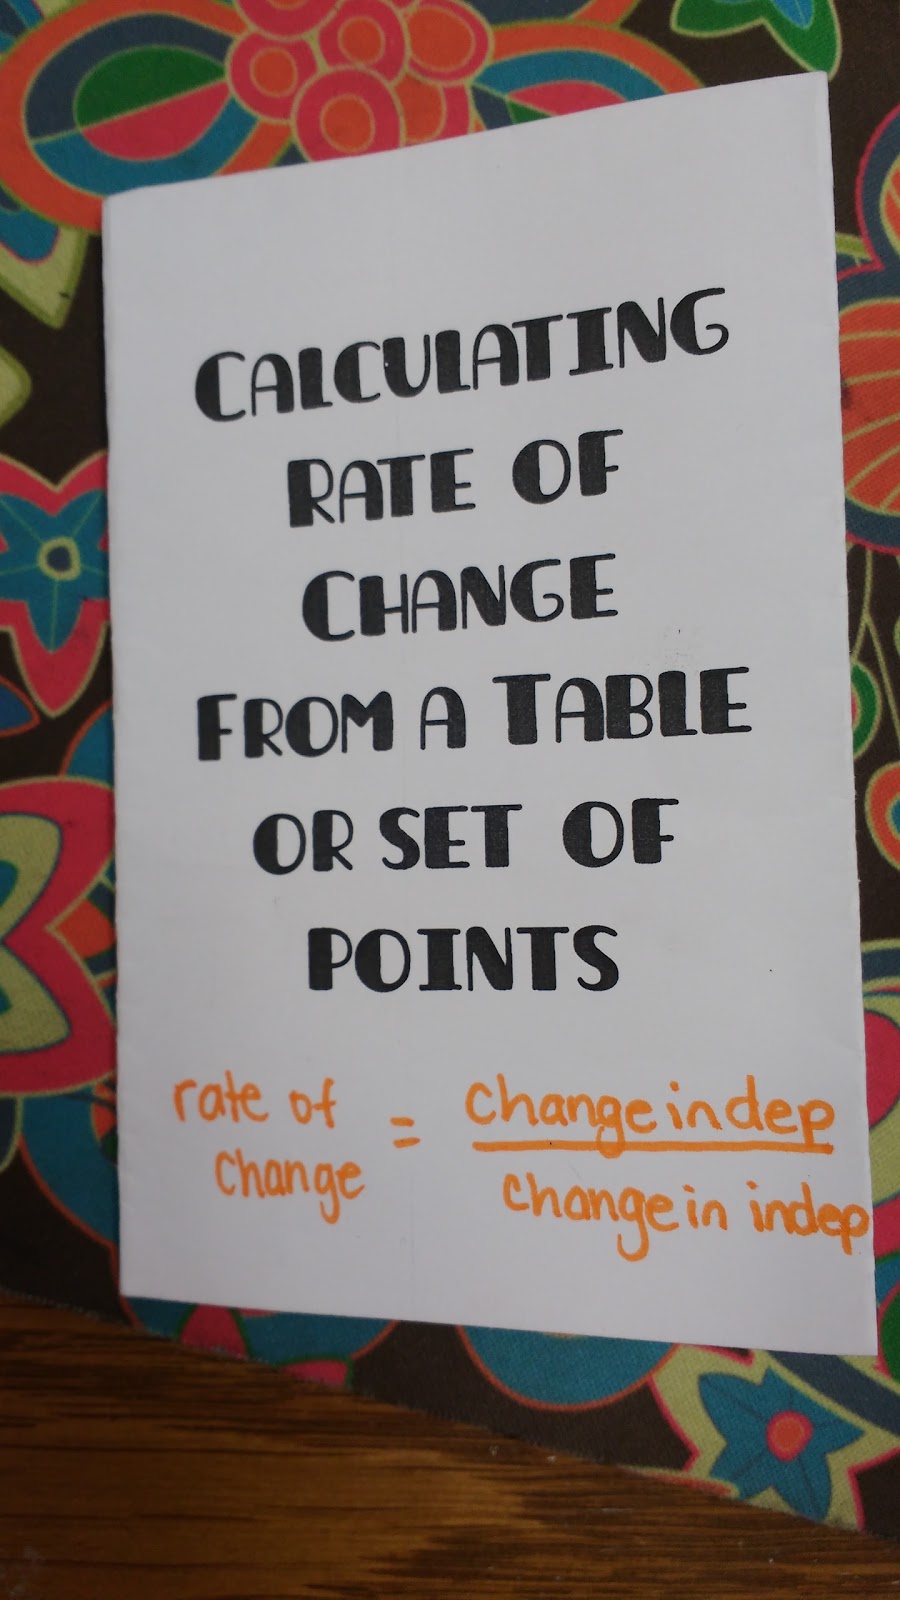
Calculating Rate of Change from a Table or Set of Points Practice Book
I created this calculating rate of change from a table or set of points practice book for my Algebra 1 students to glue in their interactive notebooks.
This year, I’m structuring things a bit differently in Algebra 1. Some changes have been for the better, and some haven’t. I’ve already started making a list of things to keep and change for next year. Today, I want to blog about one of those things worth keeping. It’s the type of thing that makes me wonder, “Why have I never done this before?!?”
Yesterday, I posted about a Ghosts in the Graveyard game I made to review independent and dependent variables. To be honest, I have always HATED teaching independent and dependent variables. They were in the standards, so I taught them. But, I never took the time to connect independent and dependent variables to the other concepts we were learning. No wonder I felt like it was a pointless thing to teach!
This year, I decided to teach finding rate of change directly after teaching independent and dependent variables. It was a beautiful thing to watch it unfold! Every time I gave my students a table or set of points, we classified the variables as dependent or independent before moving on to finding rate of change.
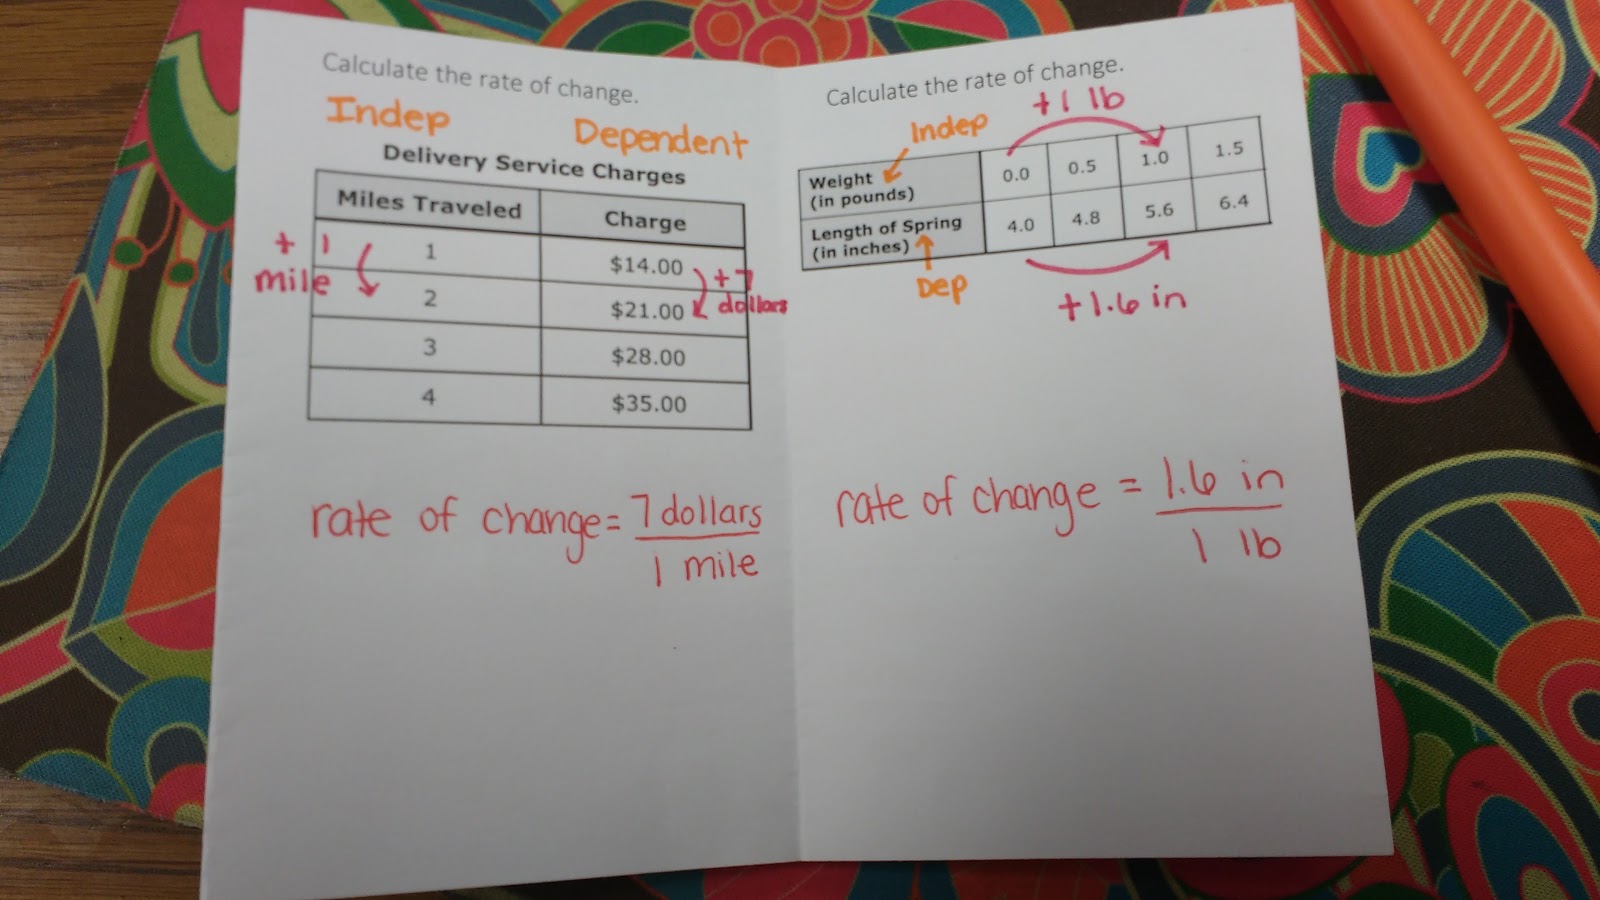
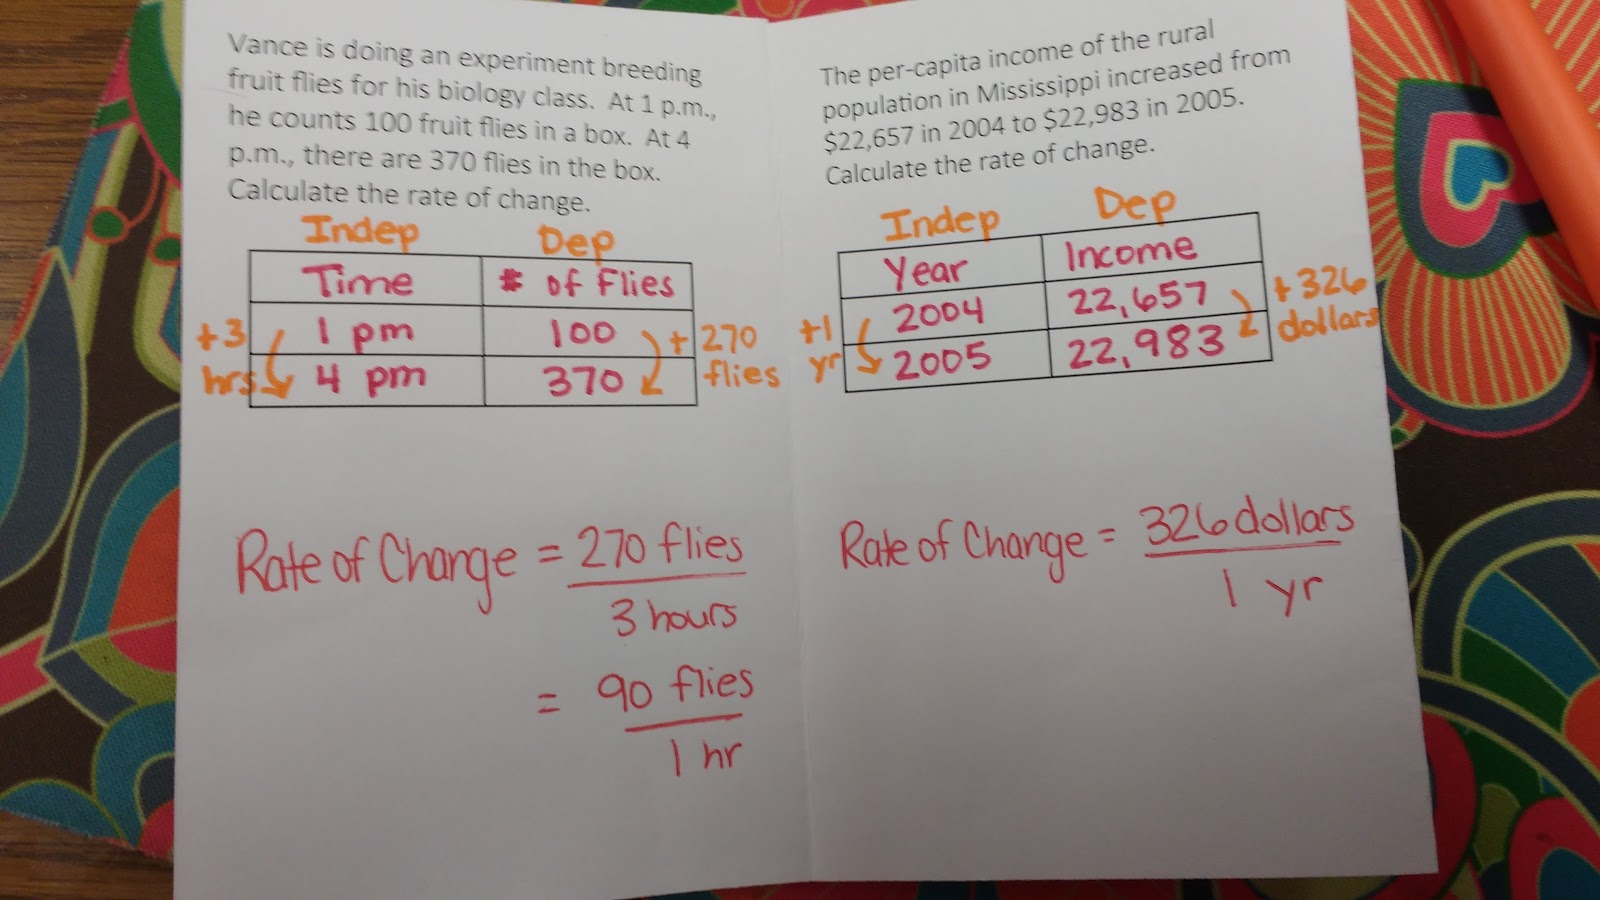
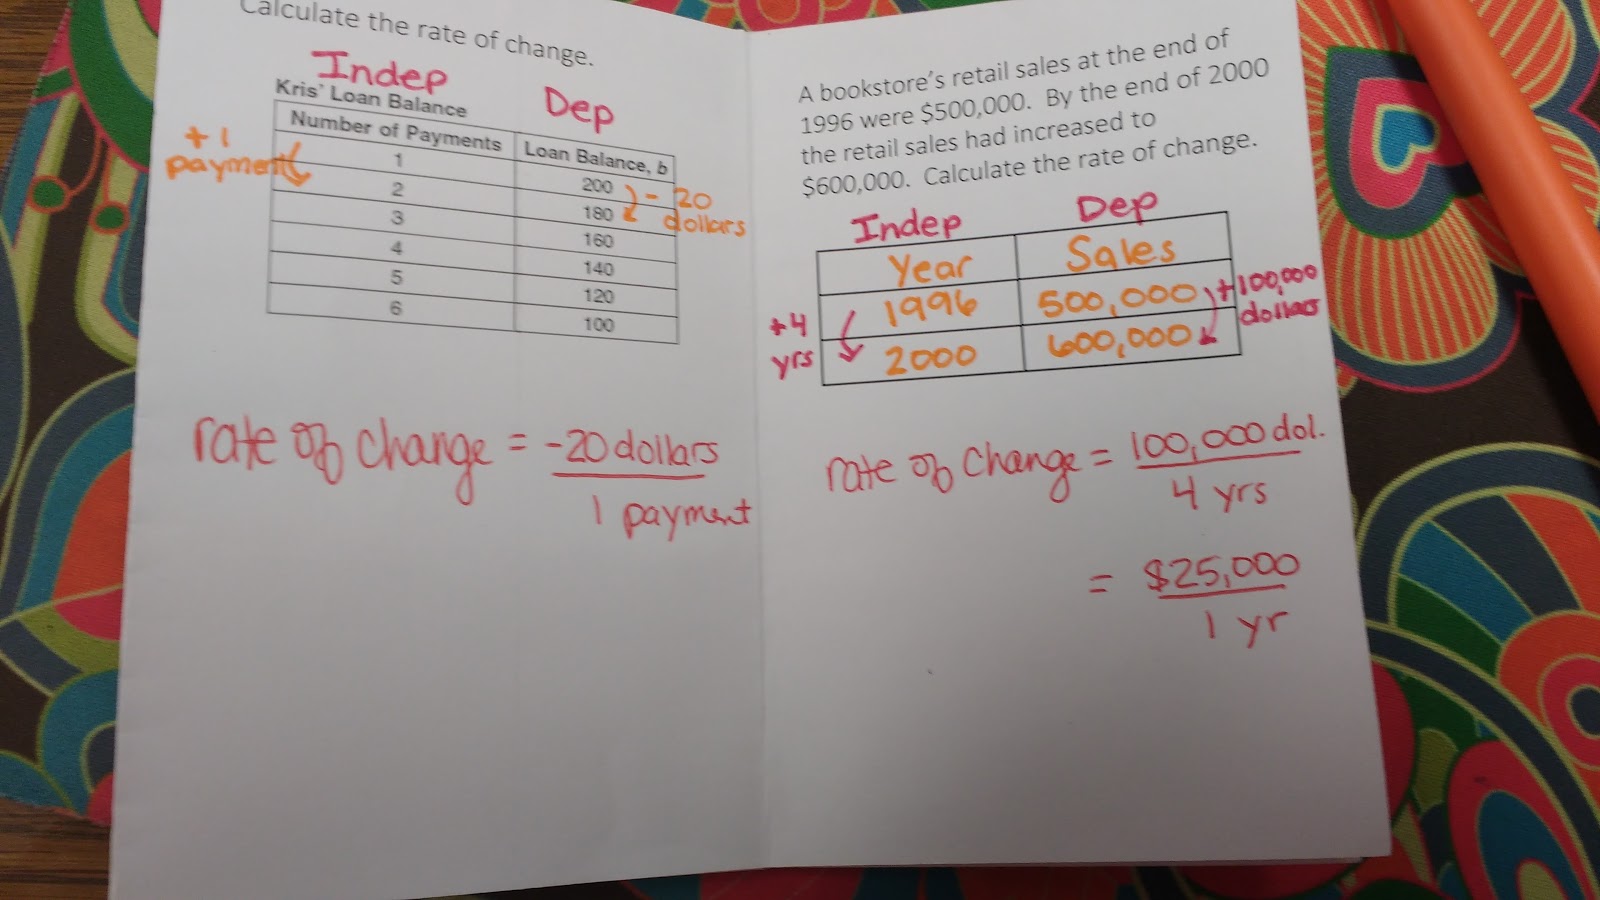
I defined rate of change for my students as the change in the dependent variable divided by the change of the independent variable. This is the first time I have ever taught rate of change independently from slope, and I LOVE it! My students are finding the slope, but they don’t know that yet. Most of my 9th graders come in my room with a history of either loving slope or hating slope from their middle school years. By focusing only on rate of change and not slope, I’m giving them each a fresh start.
Here are the notes we ended up taking on calculating rate of change from a table or set of points. We made a small book to glue in our notes. You can find the instructions for folding this book here.
Another BIG change I made this year was making students write the units next to the arrows they drew to calculate the change. My students are struggling so much less this year with remembering their units in their final answers. Yay!





Why have I never thought to have the kids put the units when finding the slope from a table. You're a genius!!! Gracias!
I was thinking the same thing! Too bad I just finished my linear functions unit. I'm putting that on the list for next year though or when we review before EOC
The link takes us to your old rate of change foldable–not the one pictured.
I'm so baffled on how to fold the sheet to make the booklet!!
Please help—how do you fold this????