Graphing Inequalities Dry Erase Work Mat
This blog post contains Amazon affiliate links. As an Amazon Associate, I earn a small commission from qualifying purchases.
I created this graphing inequalities work mat when I taught Algebra 1 to help my students conceptualize what it actually meant to graph an inequality.
So often, I have a tendency to just give my students a set of steps to follow without making sure they understand why we are following those steps. Why are we graphing a line and shading one side of it? What even is a solution/solution set?
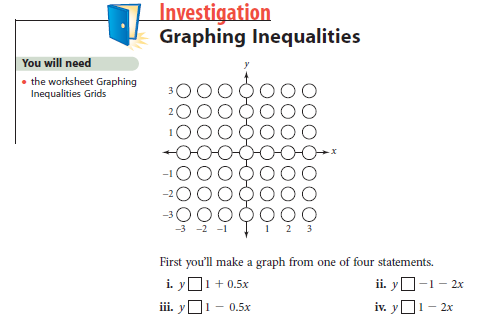
This lesson was inspired by the Graphing Inequalities Investigation in the 2007 edition of Discovering Algebra (Key Curriculum Press).I didn’t actually follow the steps of their investigation. But, I did steal the idea of using a grid with circles to graph inequalities.
The grid in Discovering Algebra only went from -3 to +3, so I decided to make my own that went from -5 to +5. This allowed me to use a greater variety of inequalities with my students since I wasn’t so limited with possible y-intercepts and slopes.
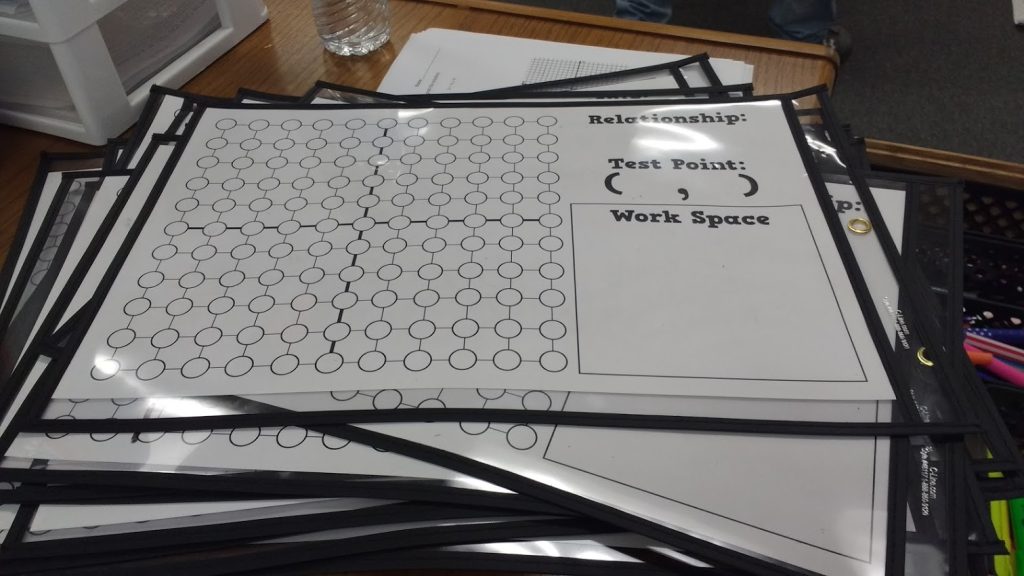
I printed these grids on 11 x 17 cardstock, and my students used them in our 11 x 17 dry erase pockets.
If you are looking to save a bit of money, you can also pick up a package of 11 x 17 sheet protectors for a much cheaper price! They won’t be quite as durable, but students can still write and erase with their dry erase markers.
MATH = LOVE RECOMMENDS…
I cannot imagine teaching math without my dry erase pockets! They instantly make any activity more engaging and save me countless hours at the copy machine since I can use the same class sets of copies year after year.
Here are my current go-to recommendations:
You could definitely downsize these to print on regular letter sized paper, as well. But, I like this slightly larger size because it makes it easier for students to work in partners.
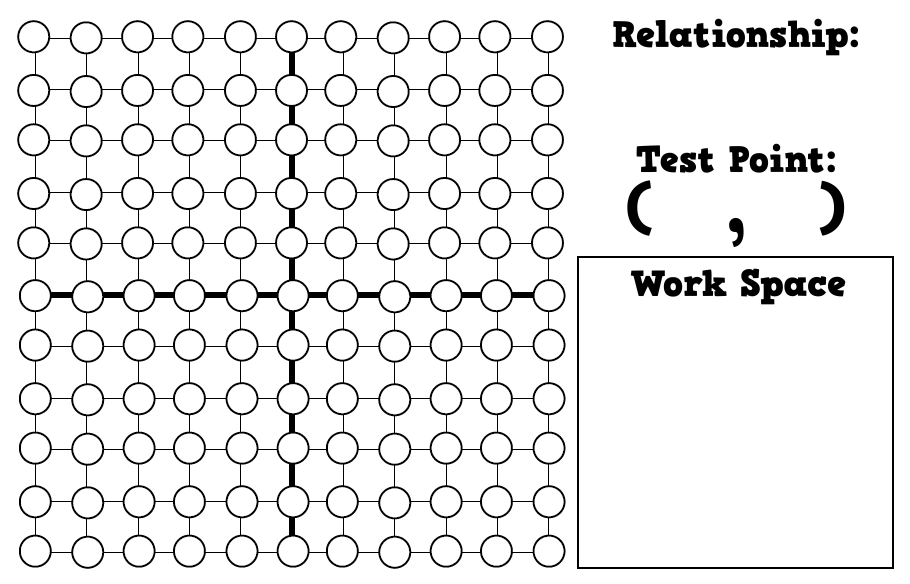
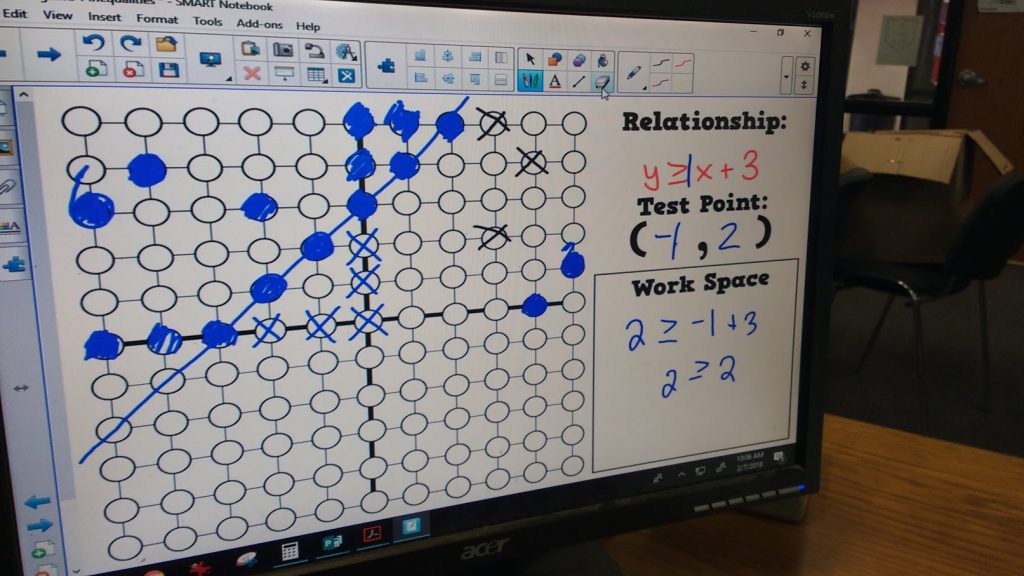
I added a place on the side of the work mat for students to record the relationship we were working with (equation or inequality), the point they were testing, and some work space to test said point.
I was so busy the day we did this lesson that I didn’t actually remember to take pictures of my students using the work mats. But I will walk you through how I arranged the lesson. I’m sure there are tons of other ways you could use this graphing inequalities work mat in your classroom as well.
- Pass out a graphing inequalities work mat to each student or pair of students.
- Give the class a relationship to work on. For example, I decided to have my students explore y >= x + 3.
- Have each student or group of students pick a point on the coordinate plane to be their test point. Ideally, each student/group of students should have a unique point. But, if a point gets tested multiple times, that is okay, too. In fact, if there are differing results, it could actually lead to a great conversation!
- Students should use the given work space to test their point by plugging it into the given inequality.
- If the resulting statement is true, students should fill in that circle on their coordinate plane. If the resulting statement is false, students should cross out that point on the coordinate plane.
- I had a SMARTBoard when I taught this lesson, so I invited students to come up to the SMARTBoard to add their data to our class copy of the Graphing Inequalities Work Mat.
- As the coordinate plane starts to fill up with tested points, ask students what they notice. My students noticed that some of our colored circles seemed to form a straight line. I drew in this line. We discovered that this line had a slope of 1 and a y-intercept of 3. This matched our inequality! Students also noticed that most of the colored circles were on one side of the line. This led to a great discussion about the two mis-colored circles on the diagram. We ended up re-testing those two points as a class. As a result, we discovered that most likely the students had mixed up their x and y values when they substituted them into the inequality.
- To see if students understood the concept of graphing an inequality, I called out random ordered pairs and asked them to tell me if those points satisfy the inequality and be shaded or if they would not satisfy the inequality.
The Discovering Algebra textbook takes a different approach in that they have students plug in values to statements that do not include an equality/inequality symbol. Then, students must determine what symbol would make the statement true. Instead of coloring/crossing out the circles on the grid, they write the appropriate symbol in the circle. In this way, they can also start to see a pattern forming. I highly recommend reading through their explanation as they explain it way better than I do!
After working through this lesson to understand what it means for a point to be part of an inequality’s solution set, we tackled this graphing inequalities foldable that walks students step-by-step through how to graph an inequality.
Love this – especially the part where they have a spot to put their test point!