Inequality and Interval Notation Chart
Just a quick post today to share an inequality and interval notation chart I created for my Algebra 2 students this past year. Due to COVID, I did not do my normal style of note-taking style in my classes this year. We were asked to do things with as little paper as possible due to the constant possibility of having to pivot to distance learning at any point in time.
It was a weird experience. For my entire teaching career, I have either used interactive notebooks or had my students keep binders with printed fill-in-the-blank notes. Almost all of the notes my students took this year were just written on notebook paper. Occasionally, I just had to give them a page of notes. This inequality and interval notation chart was one of those occasions.
There’s definitely nothing fancy about this chart, but I thought I would still share it in the hopes that I can save somebody some time in the future. Here’s what it ended up looking like after we filled it out.
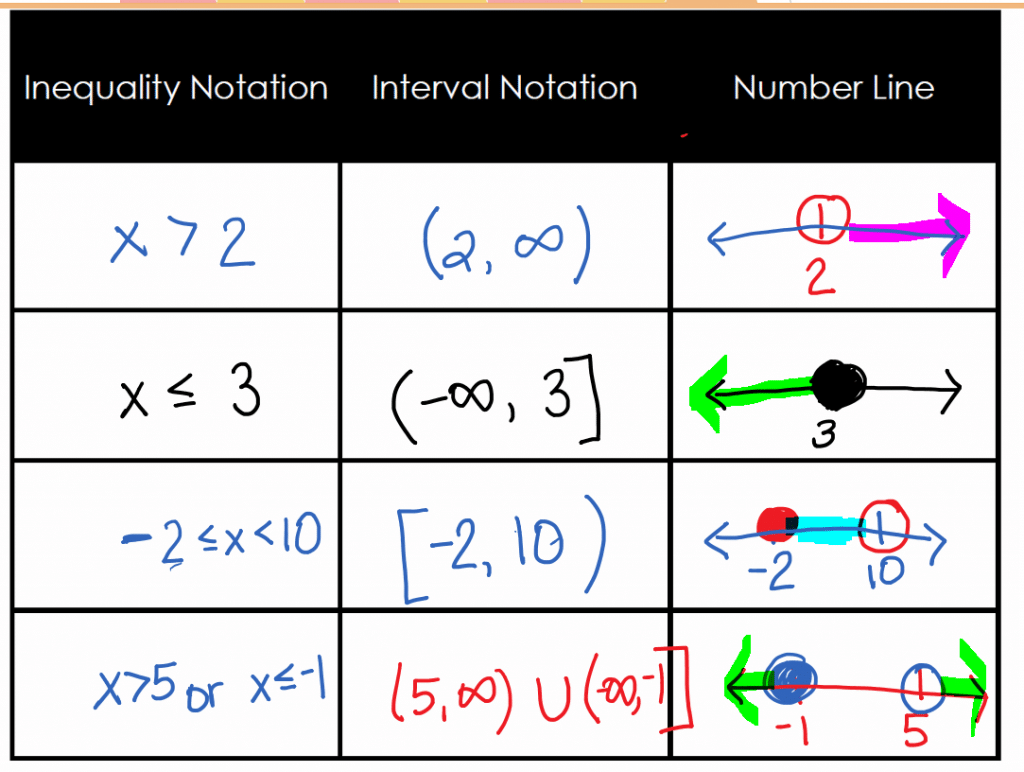
My students used this chart quite a bit as a resource file working on our Delta Math assignments over inequality and interval notation, so I’m considering it to be a win.