Monday Must Reads: Volume 28
This blog post contains Amazon affiliate links. As an Amazon Associate, I earn a small commission from qualifying purchases.
Happy Monday! Once again, I’m sharing some of the awesomeness I’ve ran across on twitter and in my RSS feed over the last few weeks. I’m declaring these “must reads.”
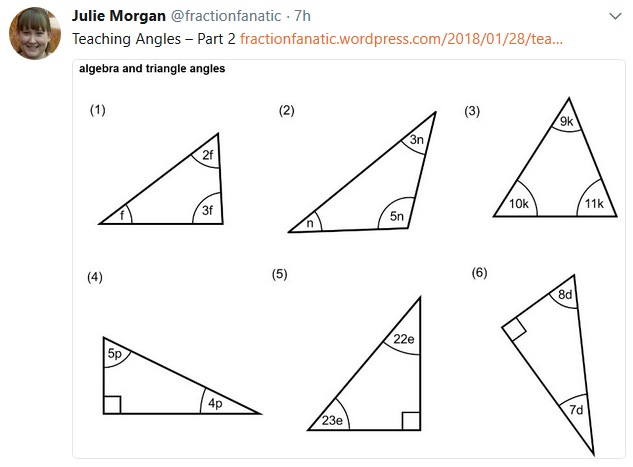
Teaching Angles
Julie Morgan is sharing more angle-awesomeness over at her blog, Fraction Fanatic, this week.
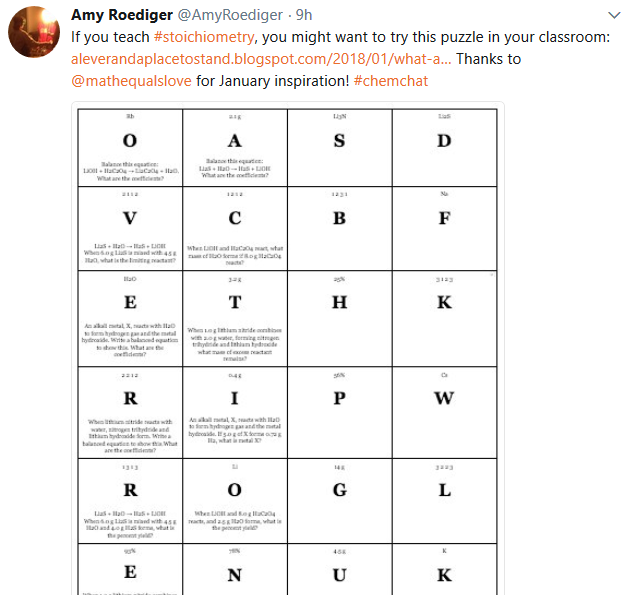
Stoichiometry Puzzle
Amy Roediger shares an awesome stoichiometry puzzle that I believe all chemistry teachers need to check out! Check out Amy’s blog here.
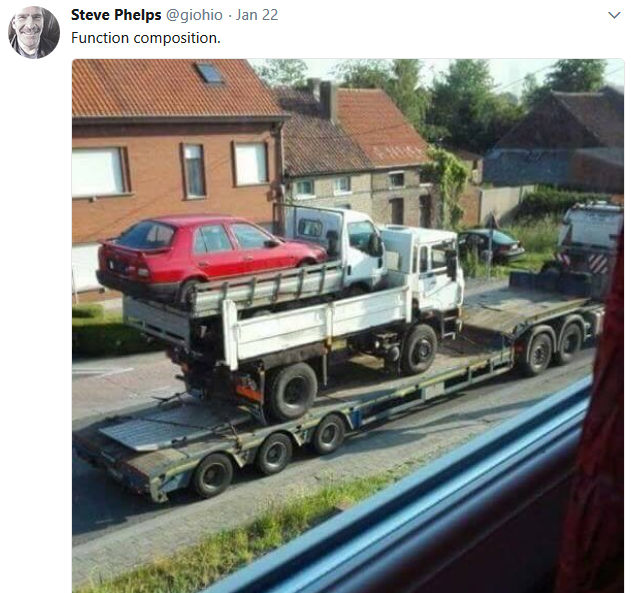
Composition of Functions Introduction Image
Need an image to introduce the idea of function composition? Steve Phelps has got you covered.
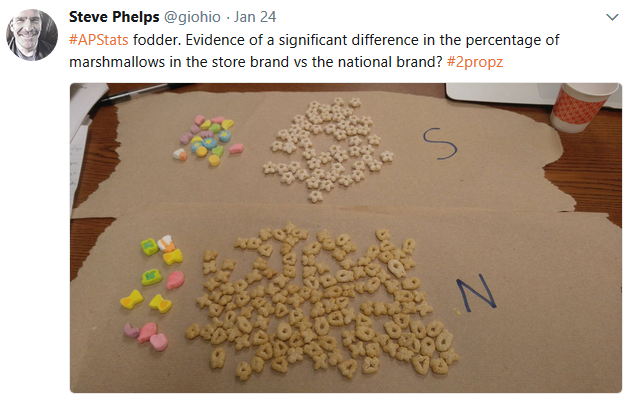
Marshmallow Statistics Lab
Steve also shares a statistics labs where students compare the percentage of marshmallows in name brand Lucky Charms versus the store brand.
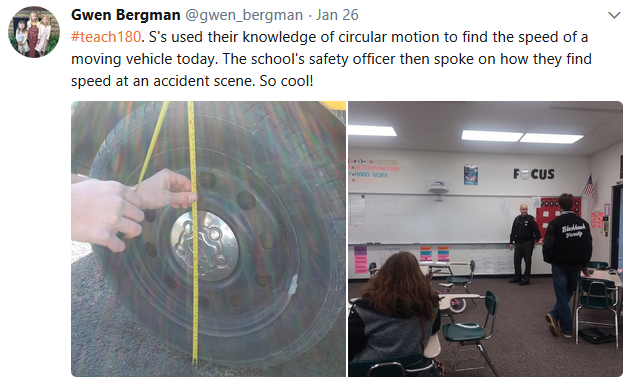
Speed of a Moving Vehicle Activity
Gwen Bergman knows how to bring to life the real-world applications of math. Check out this lesson!
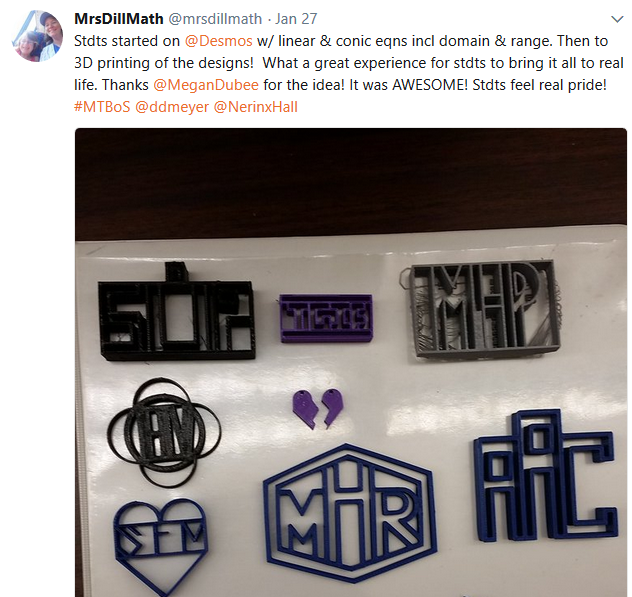
3D Printing Initials
MrsDillMath shares the results of a student project that combined writing equations, creating initials, and 3D printing. Awesome work!
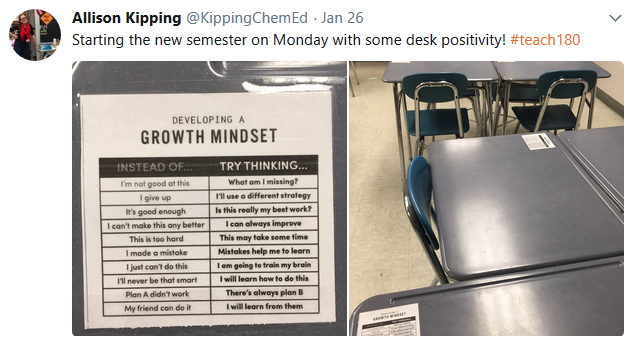
Desk Positivity
Allison Kipping has made a small change to her classroom desks for the new semester, and I think it’s a brilliant idea.
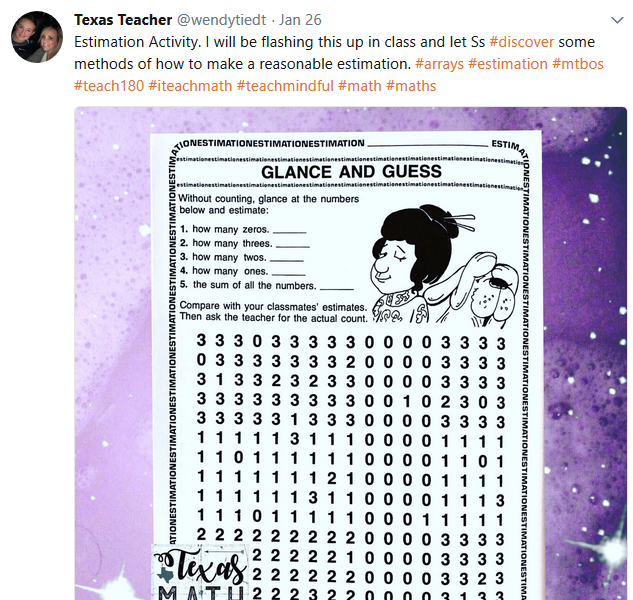
Estimation Activity
Texas Teacher shares a fun estimation activity to get students talking and sharing ideas.
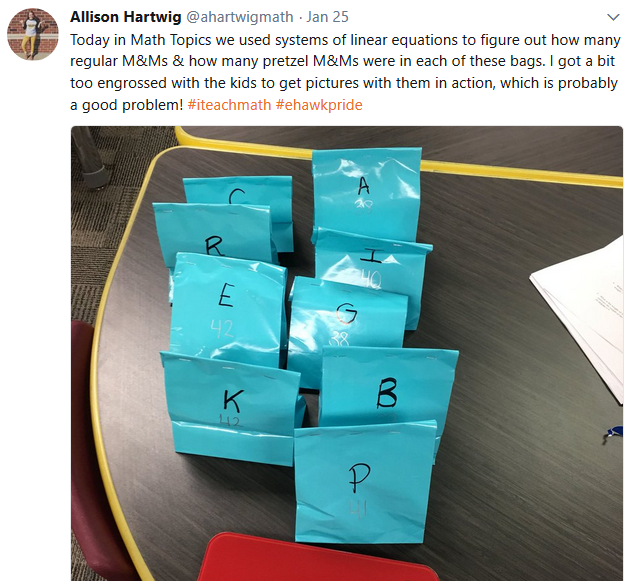
Systems of Equations with M&M’s
Allison Hartwig has combined two of my loves: M&Ms and Systems of Equations. I can’t wait to adapt this activity to use with my own students!
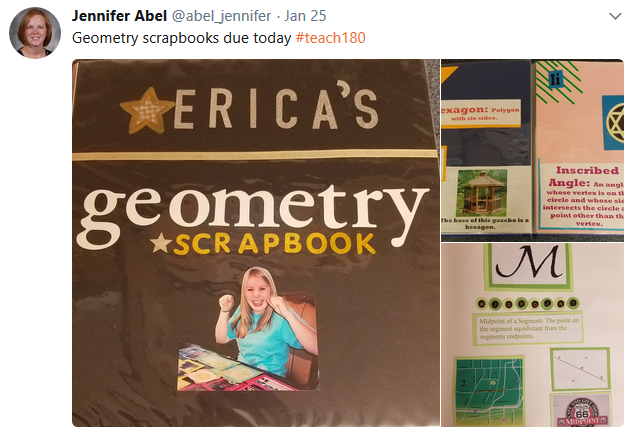
Geometry Scrapbooks
I’m incredibly inspired by the geometry scrapbooks that Jennifer Abel‘s students have created!
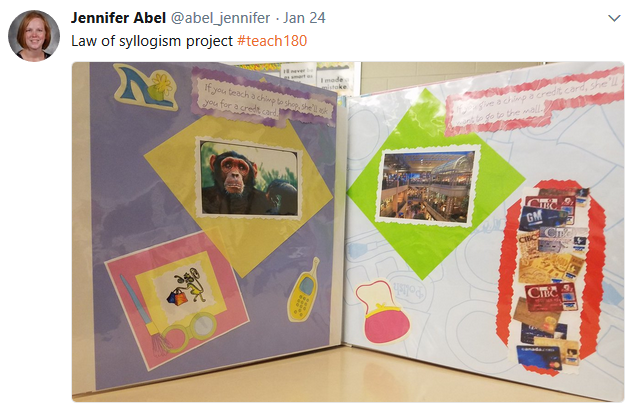
Law of Syllogism Project
Also, check out this Law of Syllogism project!
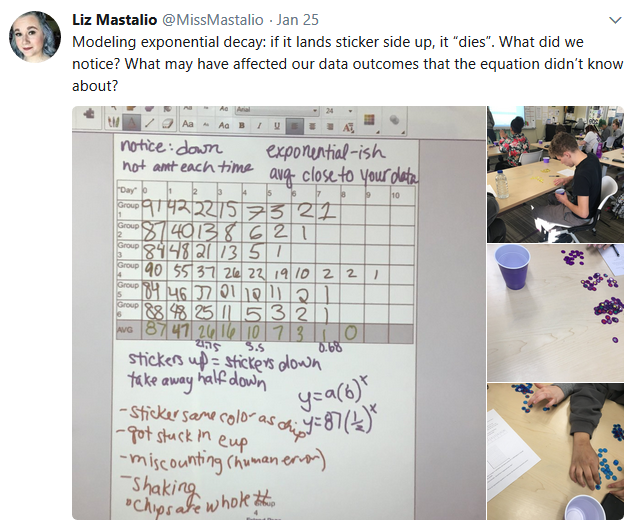
Exponential Decay with Bingo Chips
Liz Mastalio shares a great activity for modeling exponential decay that uses bingo chips and stickers.
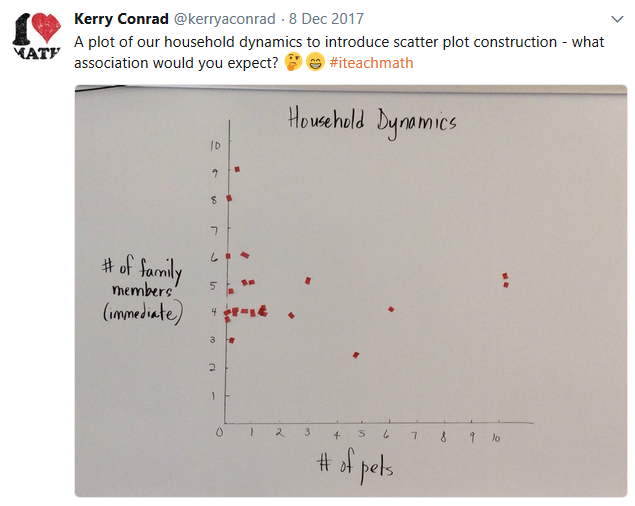
Household Dynamics
Looking to collect bivariate data with your students? Kerry Conrad shares a data collection idea that I wish I’d thought of myself!
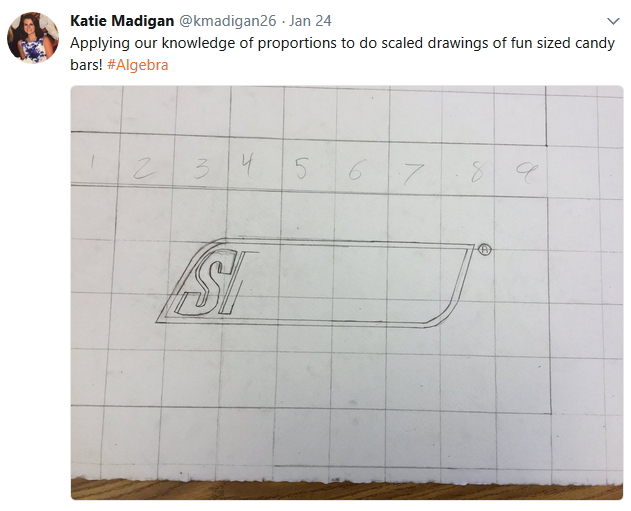
Fun Sized Candy Bars Scale Drawing Project
Looking for a fresh idea for scaled drawings? Katie Madigan suggests using fun-sized candy bars. How creative!
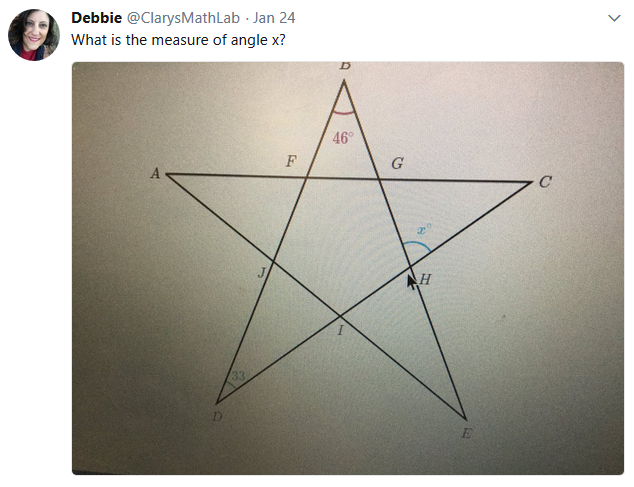
Star Angle Problem
Debbie shares a “star” of a math problem!
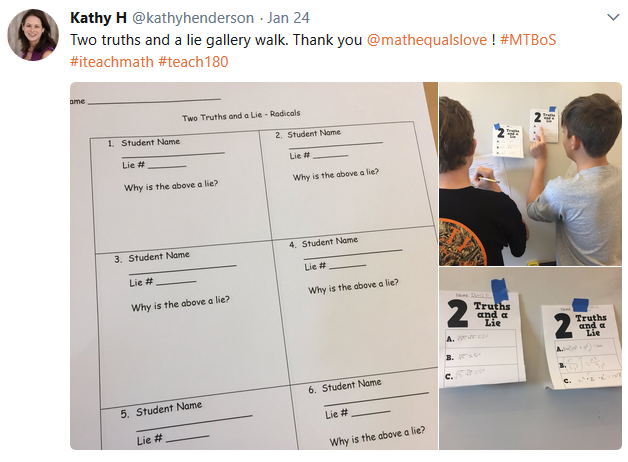
Two Truths and a Lie Gallery Walk with Recording Sheet
I love how Kathy Henderson took the Two Truths and a Lie template I shared and turned it into a gallery walk for her students.
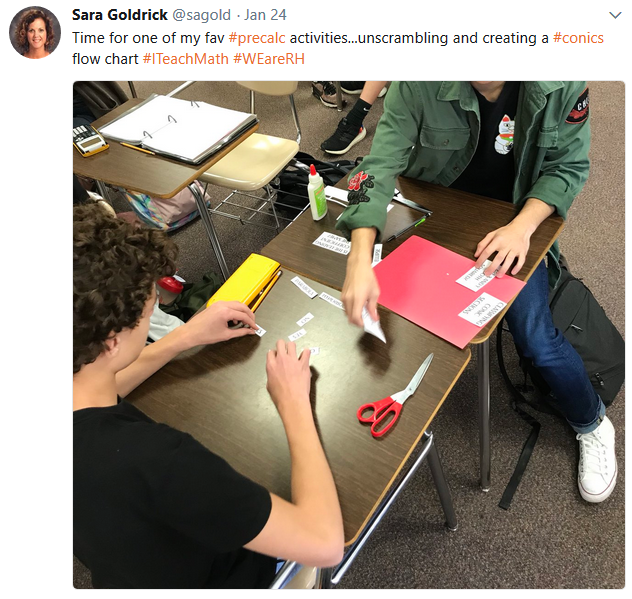
Unscramble the Conics Flow Chart
When I used to teach Algebra 2 (back when conics were still in the Oklahoma standards), I used to always give my students a conics flow chart. It was fill-in-the blank, and I loved it. Now, I’m wishing I had taken the lead of Sara Goldrick and had students unscramble and assemble a conics flow chart themselves!
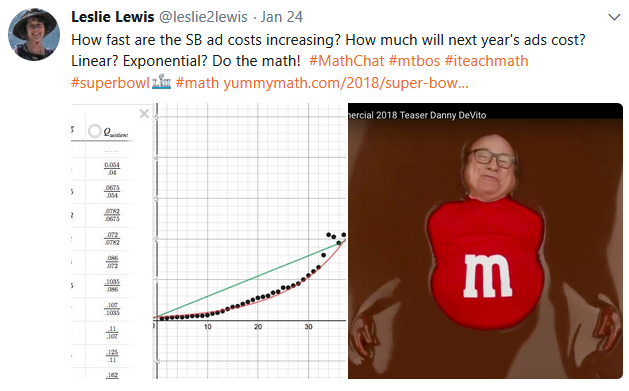
Super Bowl Add Graph
Leslie Lewis poses an interesting question for us to explore with our students regarding super bowl ad prices.
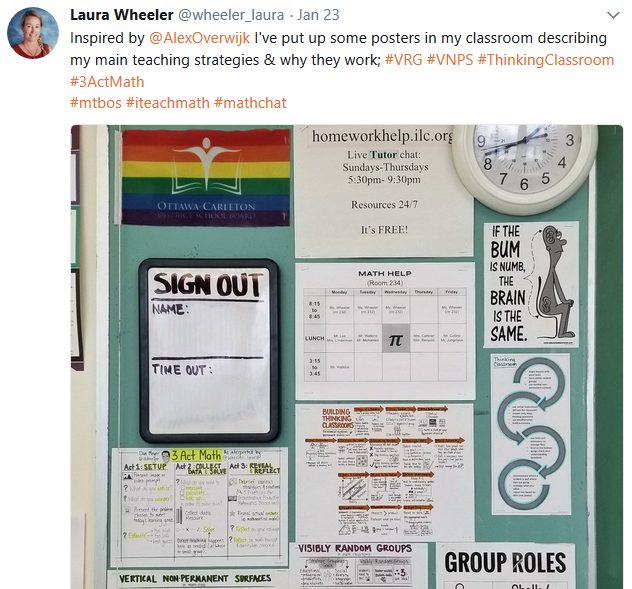
Teaching Strategies Bulletin Board
Laura Wheeler shares how she is using wall-space in her classroom to display posters that describe her teaching strategies. I love this idea!
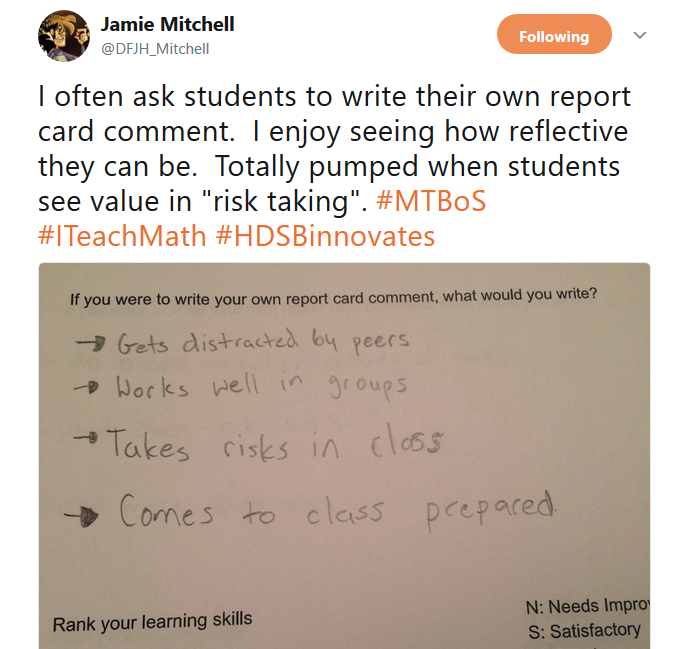
Write Your Own Report Card Comment
Jamie Mitchell has me rethinking my current approach to report card comments.
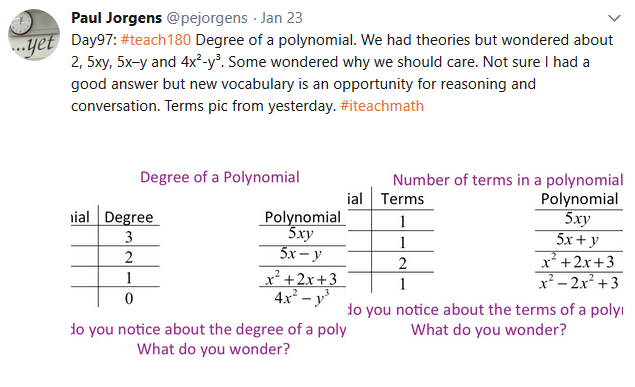
Notice and Wonder: Polynomials
I’ve always taught polynomial terminology as something to be memorized. I’m inspired by Paul Jorgens to approach the terminology from a notice/wonder standpoint this year instead.
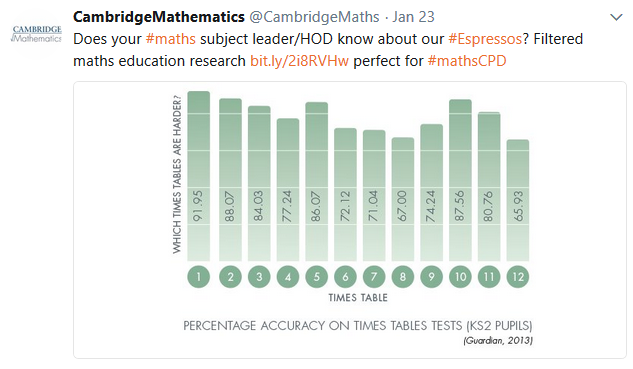
Times Table Graph
I found this graph shared by Cambridge Mathematics of which times tables students struggle with the most to be very interesting.
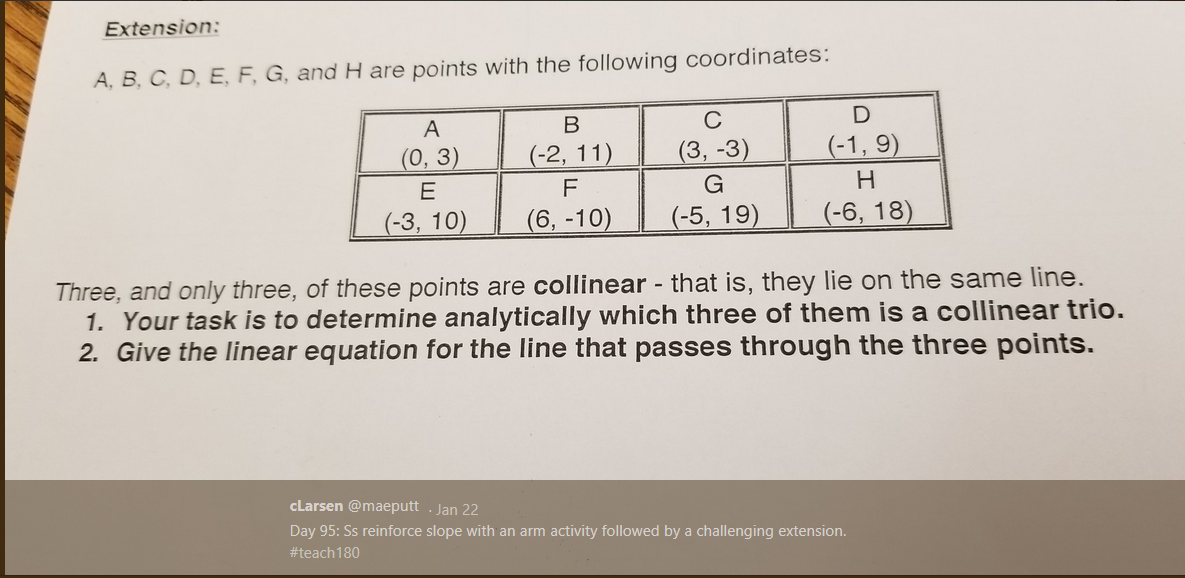
Slope Task
cLarsen shares an awesome task to get students practicing slope and showing their work.
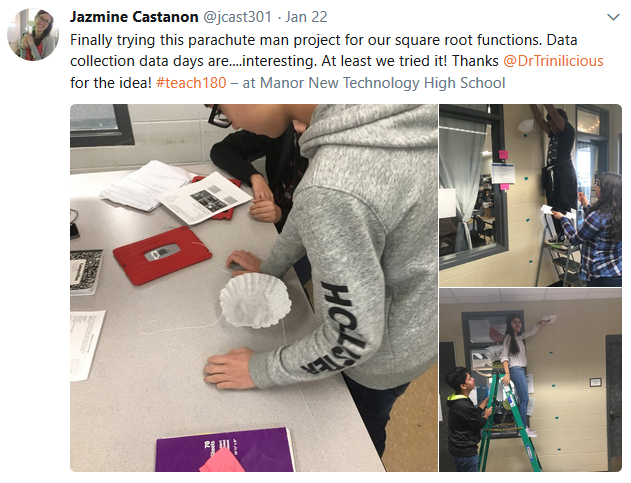
Square Root Functions with Parachute Men
I could definitely do a better job of incorporating more data collection into my classroom. I especially like this idea of parachute men for square root functions from Jazmine Castanon.
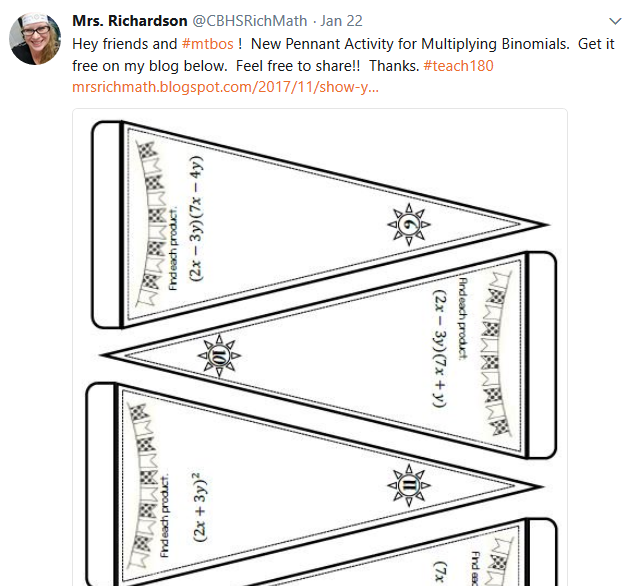
Multiplying Binomials Pennant Activity
Looking to pretty-up your classroom and give your students practice multiplying binomials? Check out Mrs. Richardson‘s latest blog post!
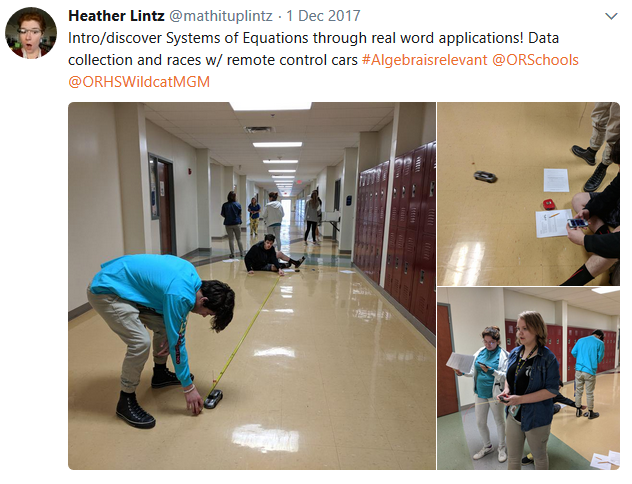
Real World Systems of Equations
Have any remote controlled cars laying around your house? Then, you’re set to try out this systems of equations lesson from Heather Lintz.
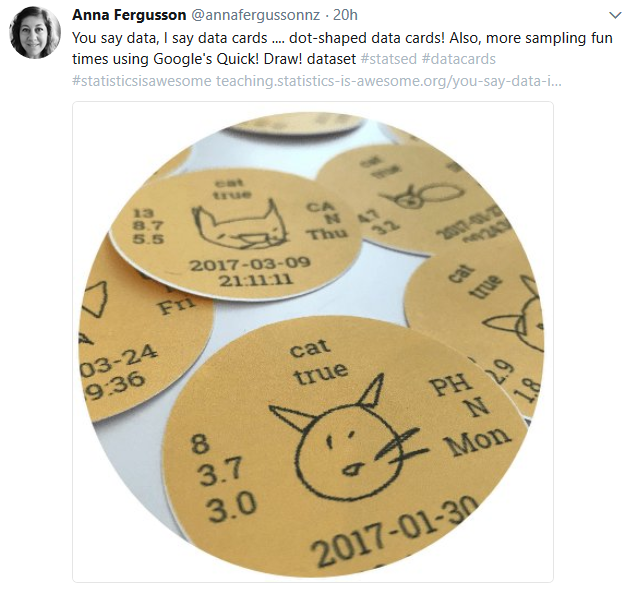
Data Cards
Anna Fergusson shares the brilliant idea of creating data cards to make scatterplots. Each data point is printed and cut out with a circle punch. There are multiple pieces of data about each datapoint on the circle, so you can easily change the scatterplot out to look at a different variable. Anna shares a set of data cards for you to print that focuses on Quick Draw data for cats.
Until next week, keep up the awesome sharing!