4 Representations of a Relation Foldable
This 4 representations of a relation foldable is one of my favorite foldables of the entire year in Algebra 1.
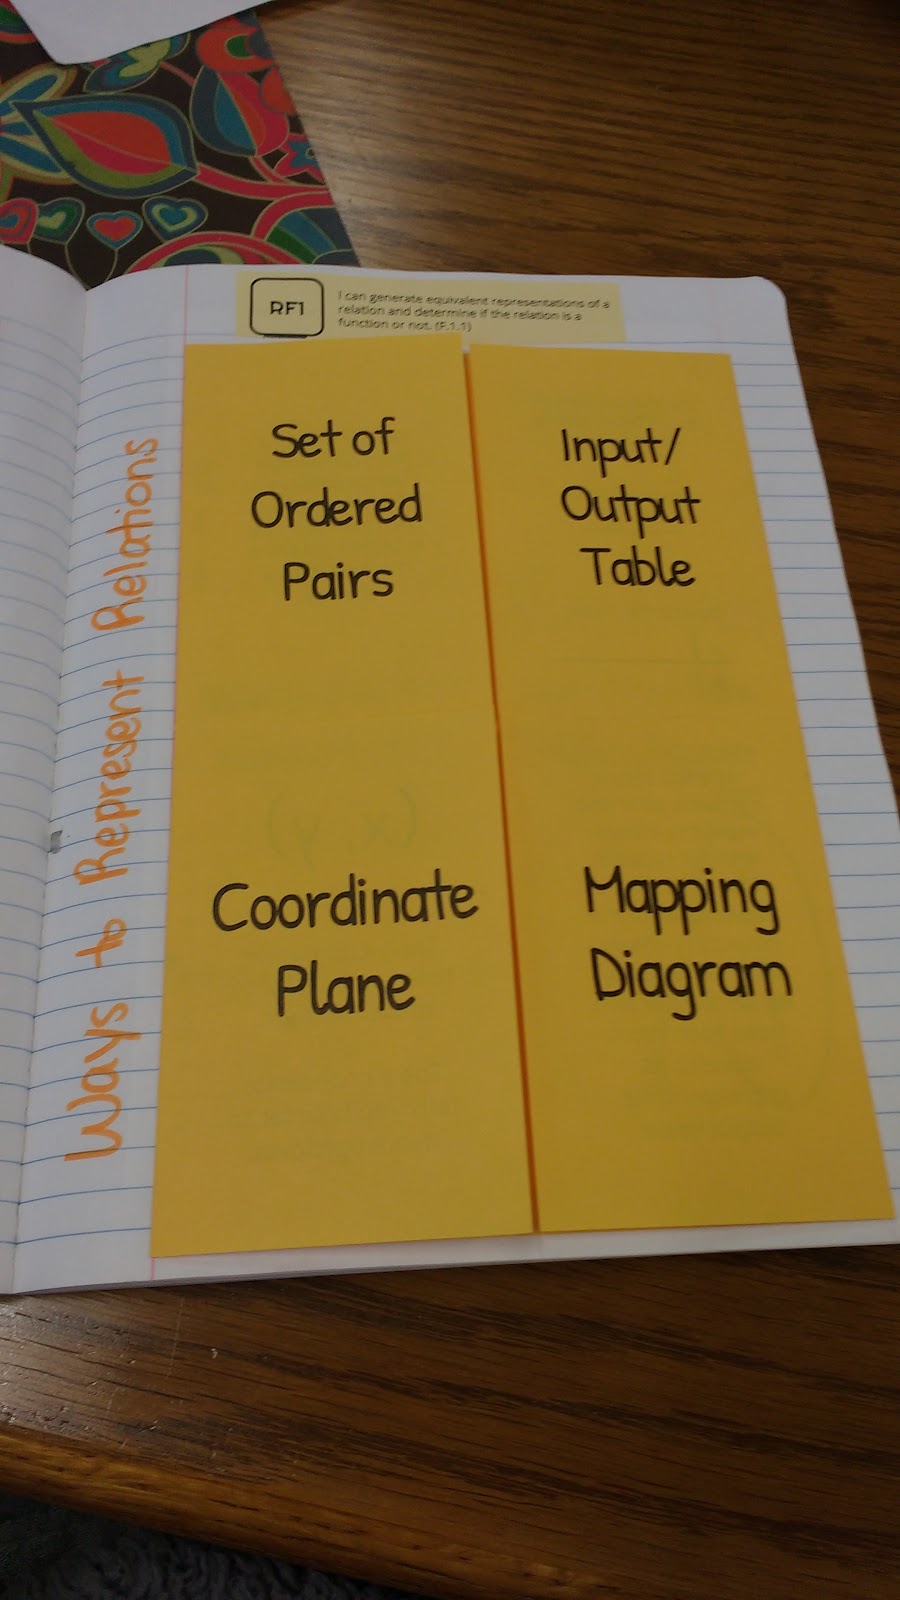
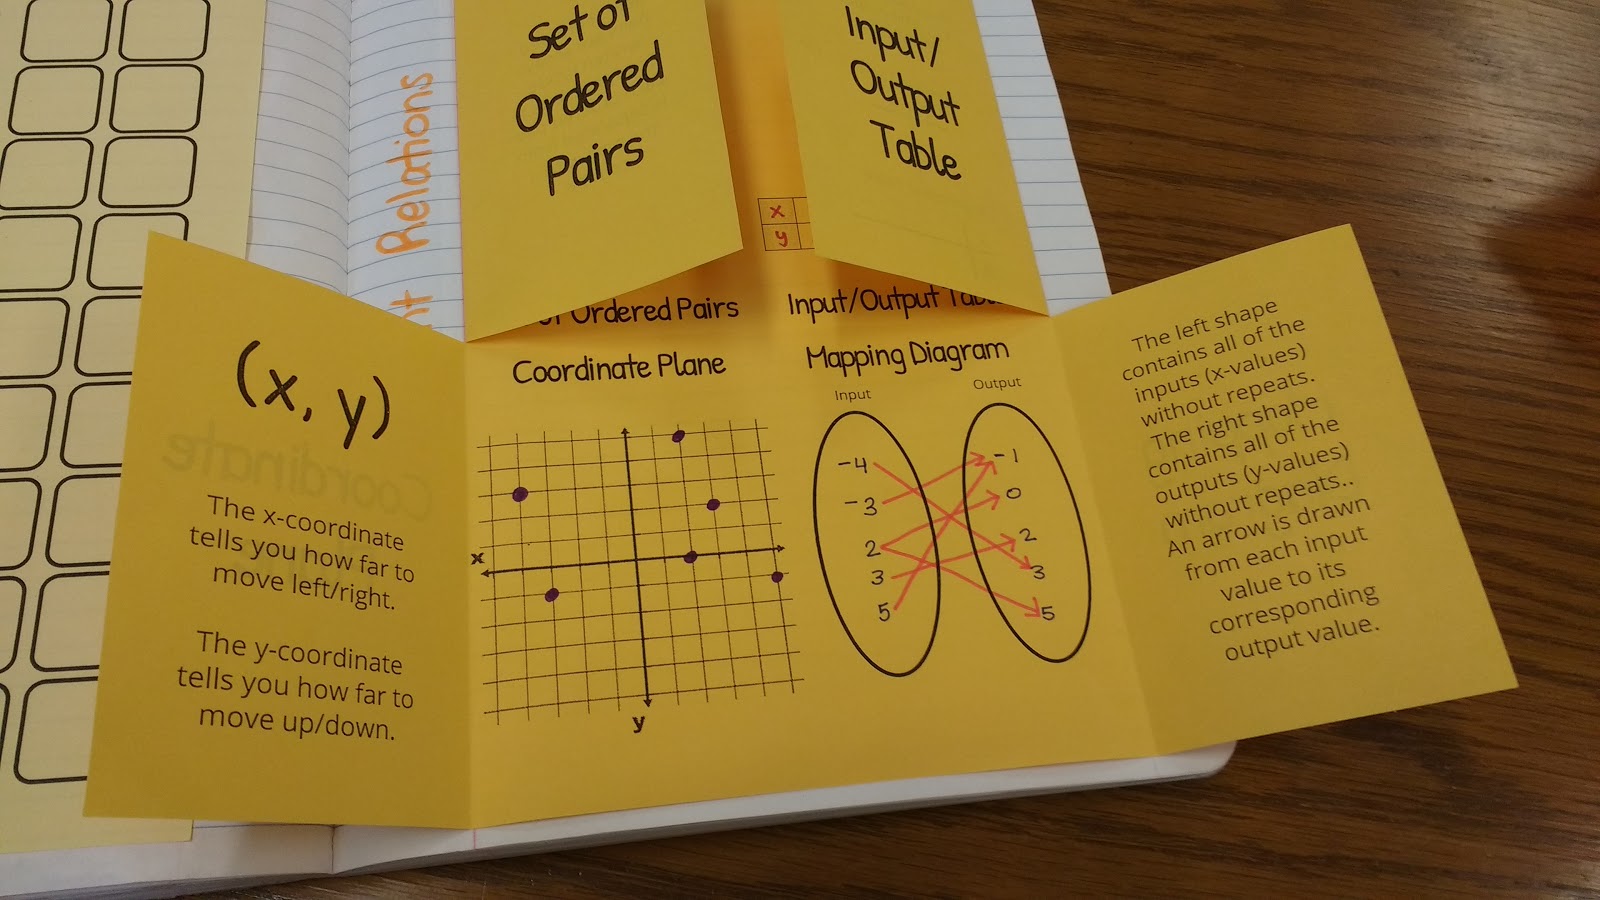
We started off our relations and functions unit with a review of the various ways to represent relations. My Algebra 1 students were already familiar with ordered pairs, input/output tables, and the coordinate plane. Mapping diagrams were completely new to them.
Each representation got its own flap on this foldable.
We began our discussion by creating a set of ordered pairs. I had six students each volunteer an ordered pair. There was one restriction. The ordered pairs had to fit on the coordinate plane below it.
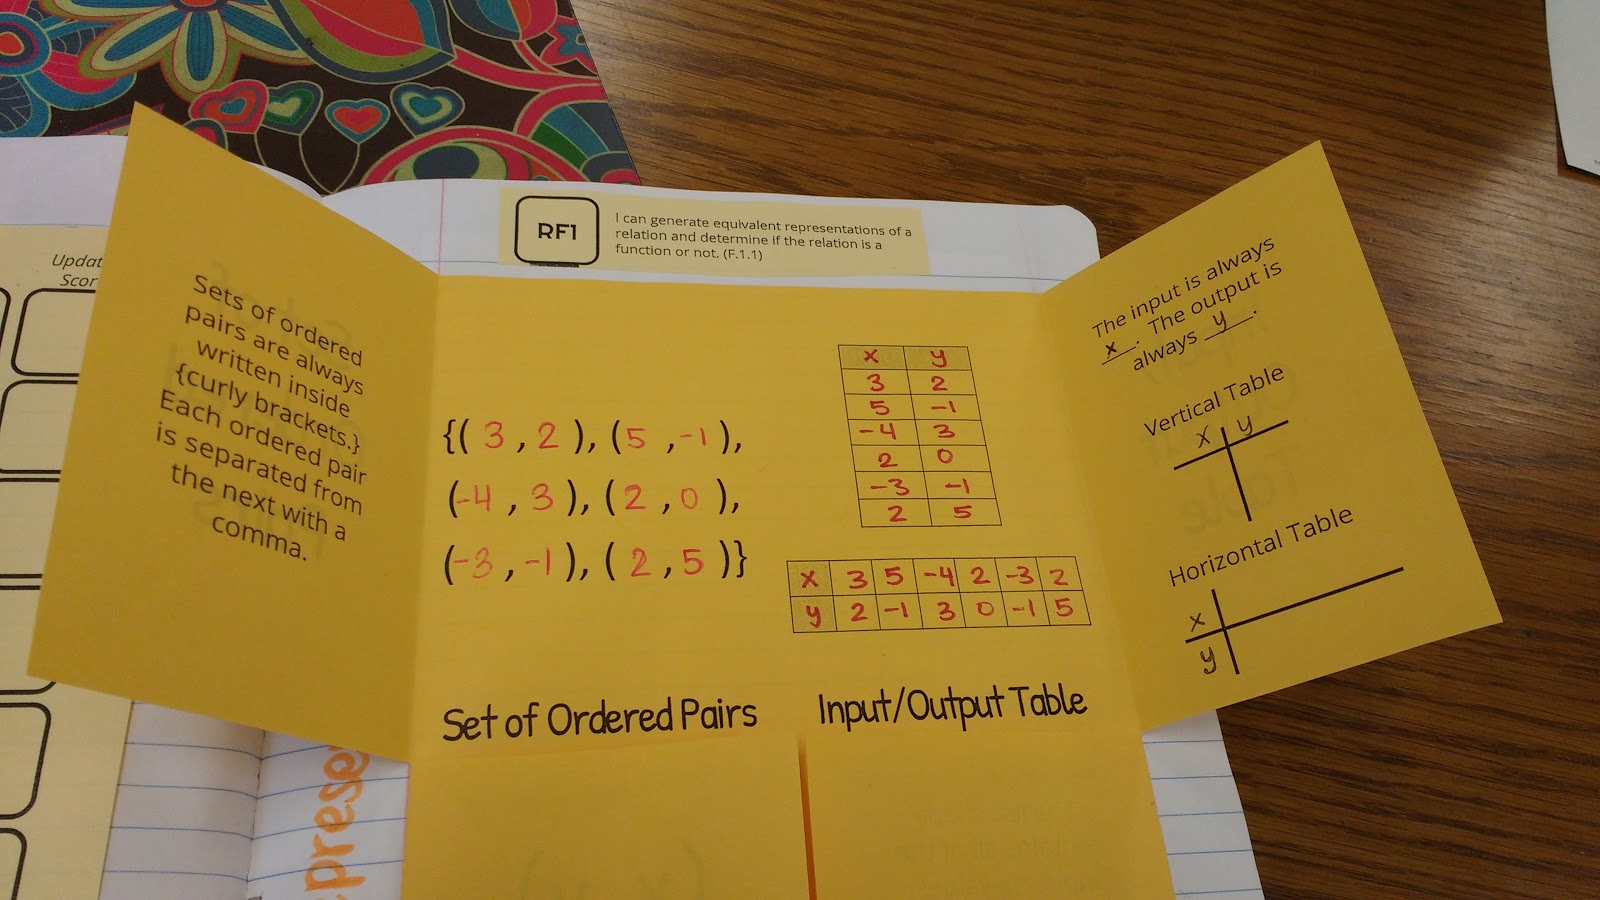
After writing our six ordered pairs, we moved to the input/output section of the table. We discussed that they would need to be able to organize ordered pairs into a horizontal table or a vertical table. I asked them which variable was used to represent input and which variable was used to represent output. They easily supplied x and y for these blanks. Next, we discussed where x and y belong on a vertical table vs. a horizontal table.
In the past, my students have sometimes struggled with calculating slope from a horizontal table because they aren’t sure which values are x and which values are y. This is my motivating factor for including both horizontal and vertical tables here.
We took our ordered pairs from the previous section and turned them into both types of tables.
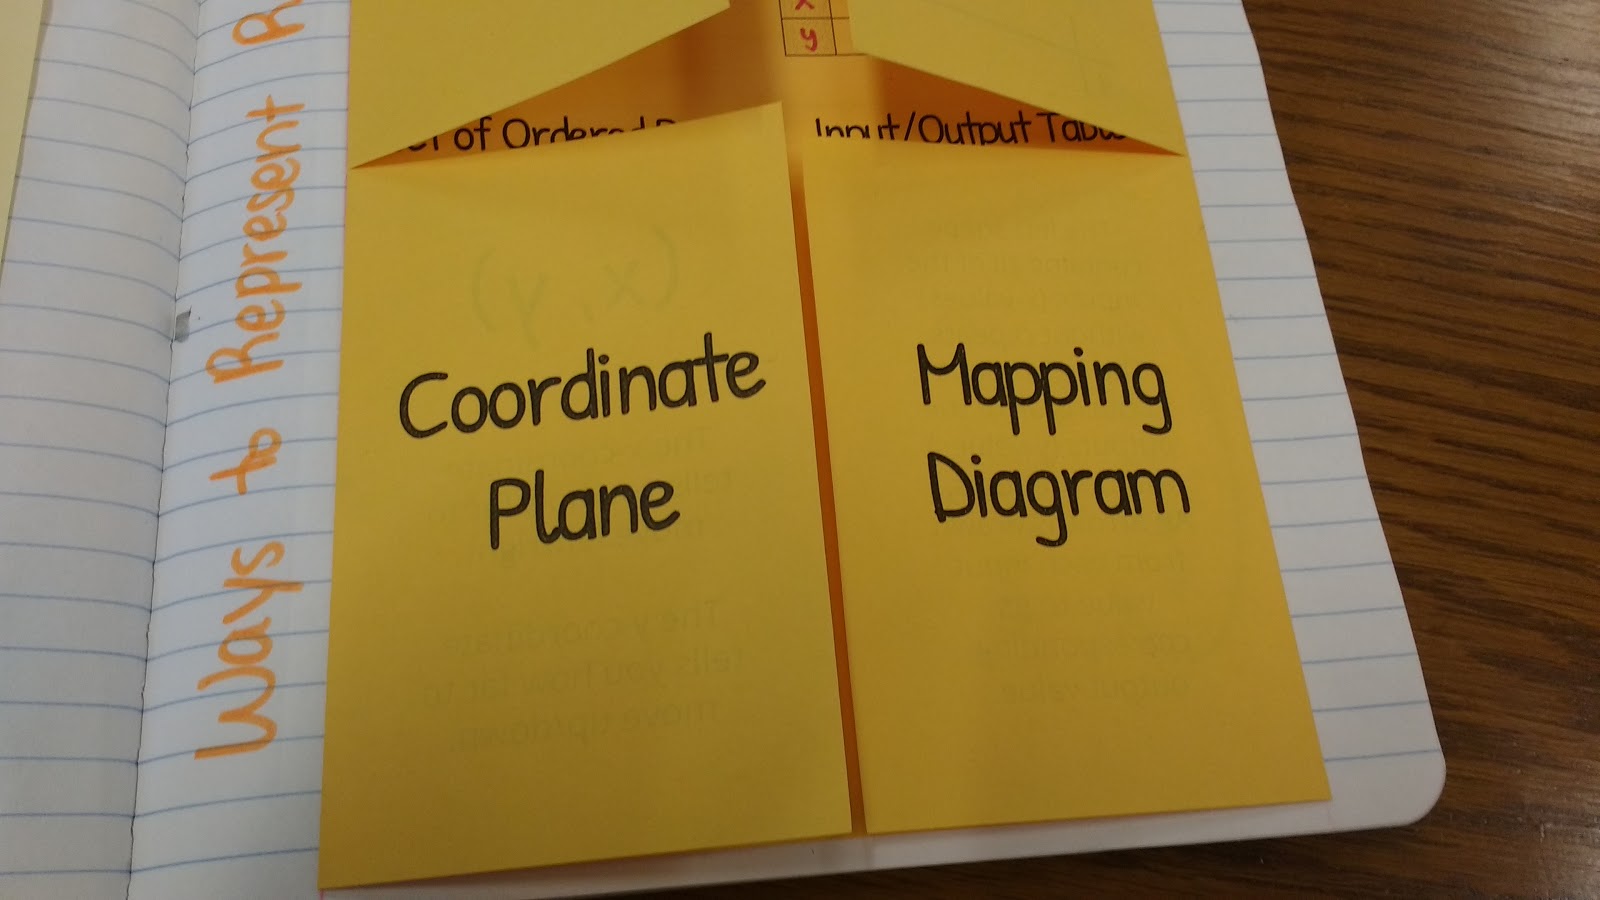
After making our tables, we graphed our six points on the coordinate plane.
In the past, I’ve spent some time reviewing graphing on the coordinate plane. This year, I’m going to assume that my students have mastered that concept in middle school. We’ll see how that goes…
Finally, I introduced my students to my most favorite representation of a relation–mapping diagrams. I didn’t tell my students why they are my favorite, but I know they’ll be able to tell why soon when we start classifying relations as functions or non-functions.
We took our six ordered pairs and turned them into a mapping diagram.
First, I had them write their x values in the input oval without repeats. Then, I had them write their y values in the output oval without repeats. Some students began to be very concerned about this. How in the world do we know which input matches up with which output? I am so very glad you asked. That’s why we need arrows to connect each input value to its corresponding output value.
And, our notes are done! Going through these four representations took about twenty minutes of our fifty minute class period. We spent the next twenty or twenty-five minutes working on a representations of relations telephone game.