Stats Response Bias Project
Instead of giving my statistics students a semester test, I chose to assign them a response bias project based on one shared online by Josh Tabor.
I was very impressed with how they carried out their projects. It was fun for me, as a teacher, to watch them grapple with results that didn’t necessarily match their hypotheses.
I can’t wait to hang these up in the hall. I’m hoping they will help spark other students’ interests regarding statistics.
Response Bias Projects
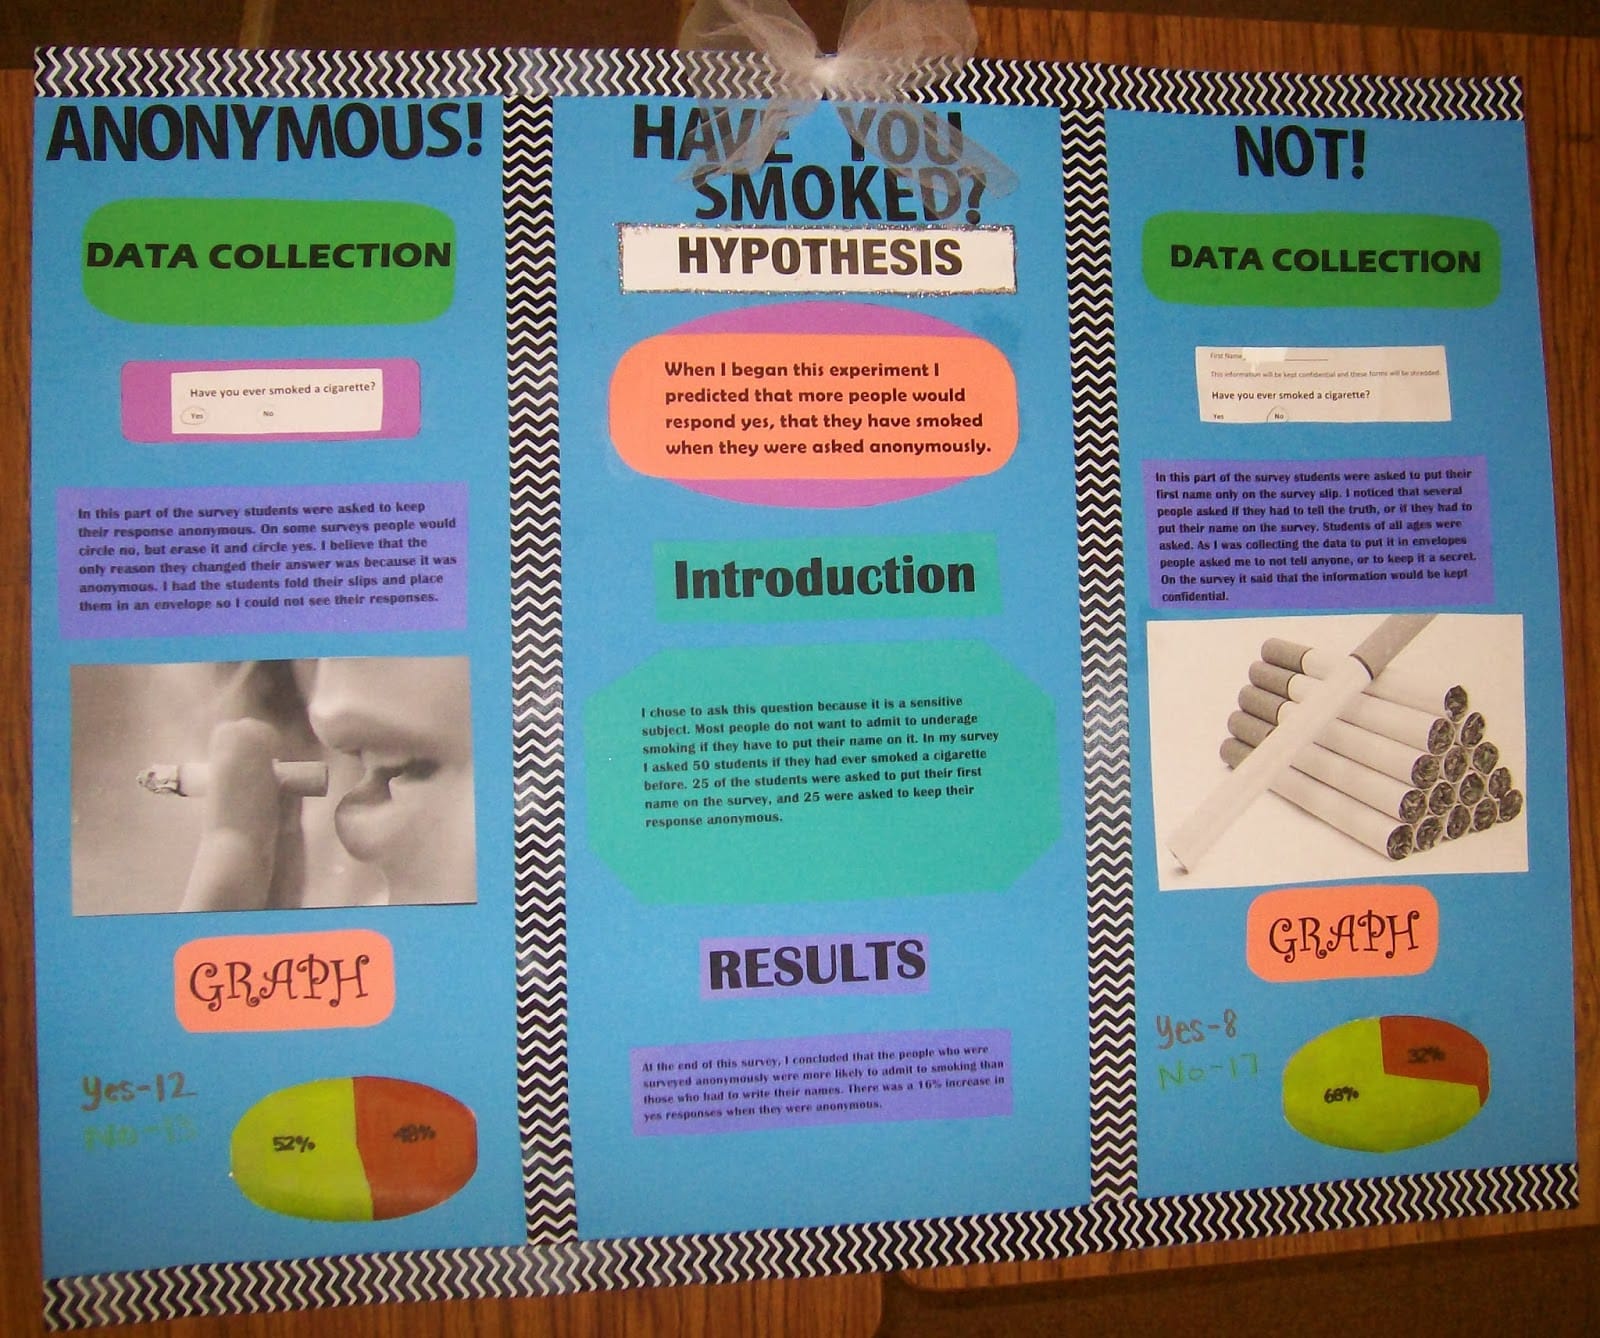
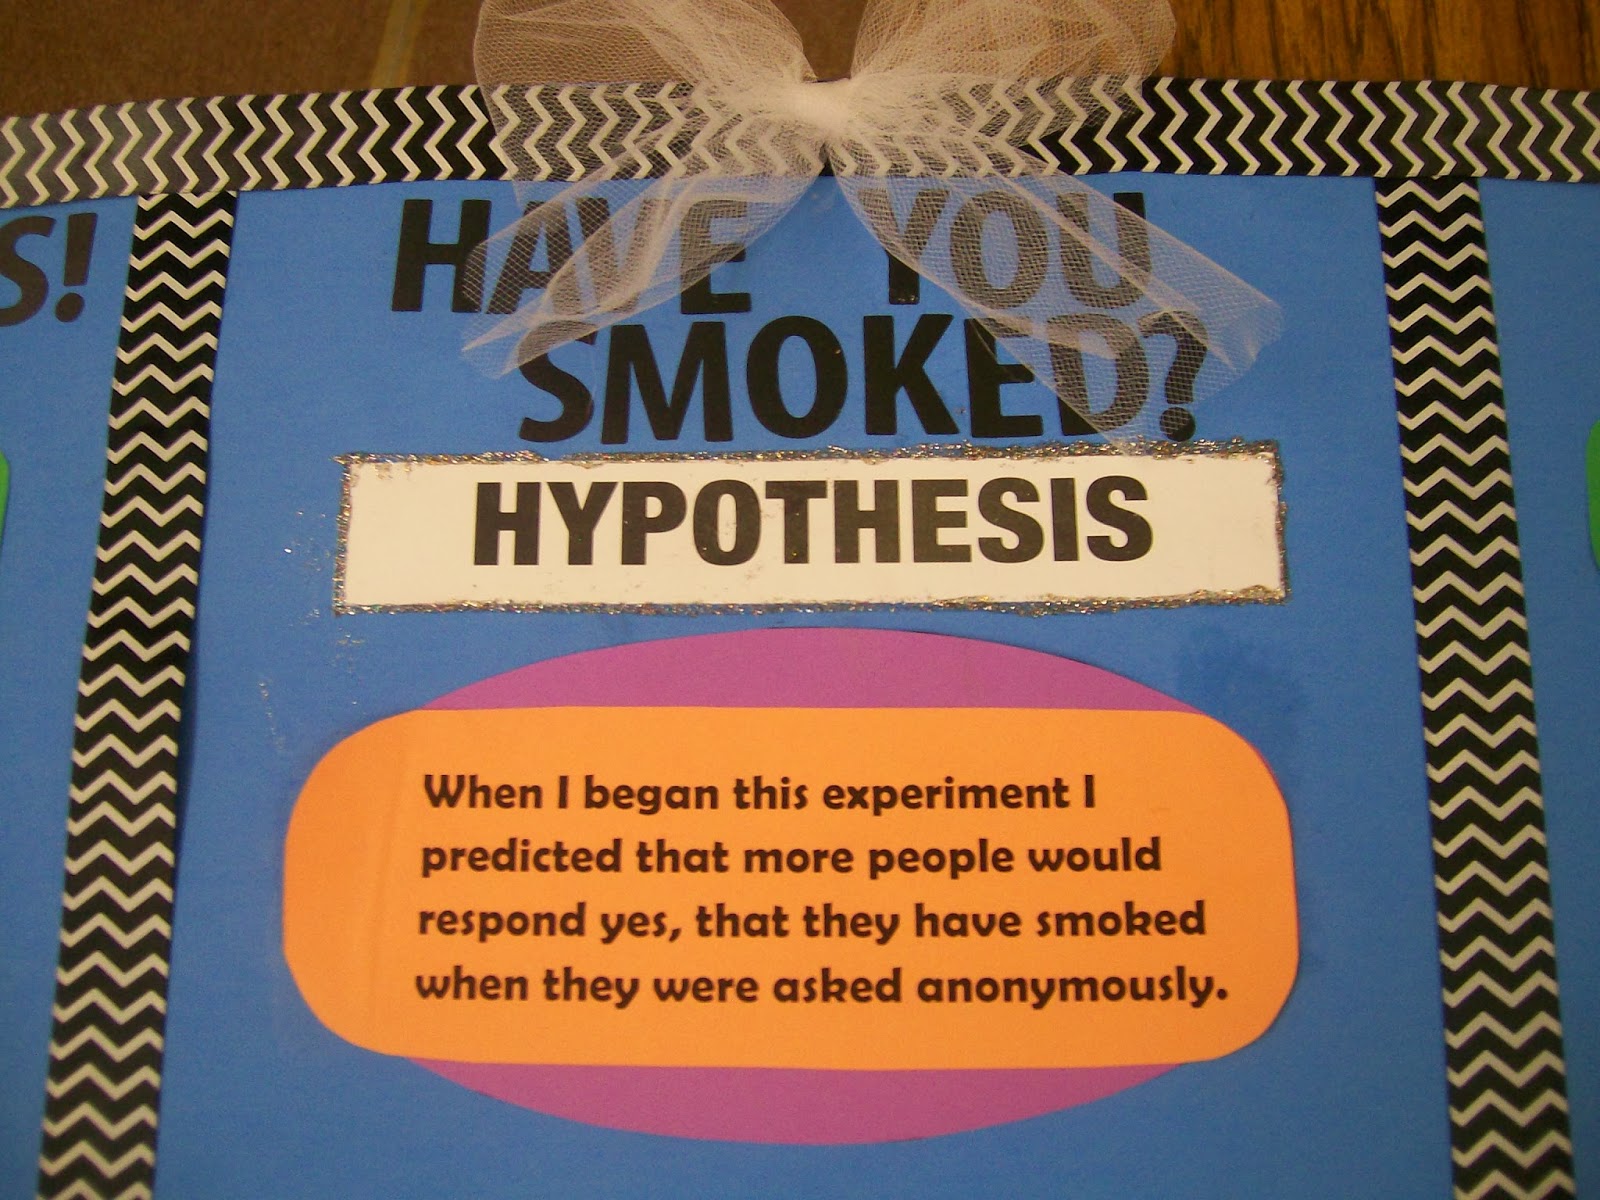
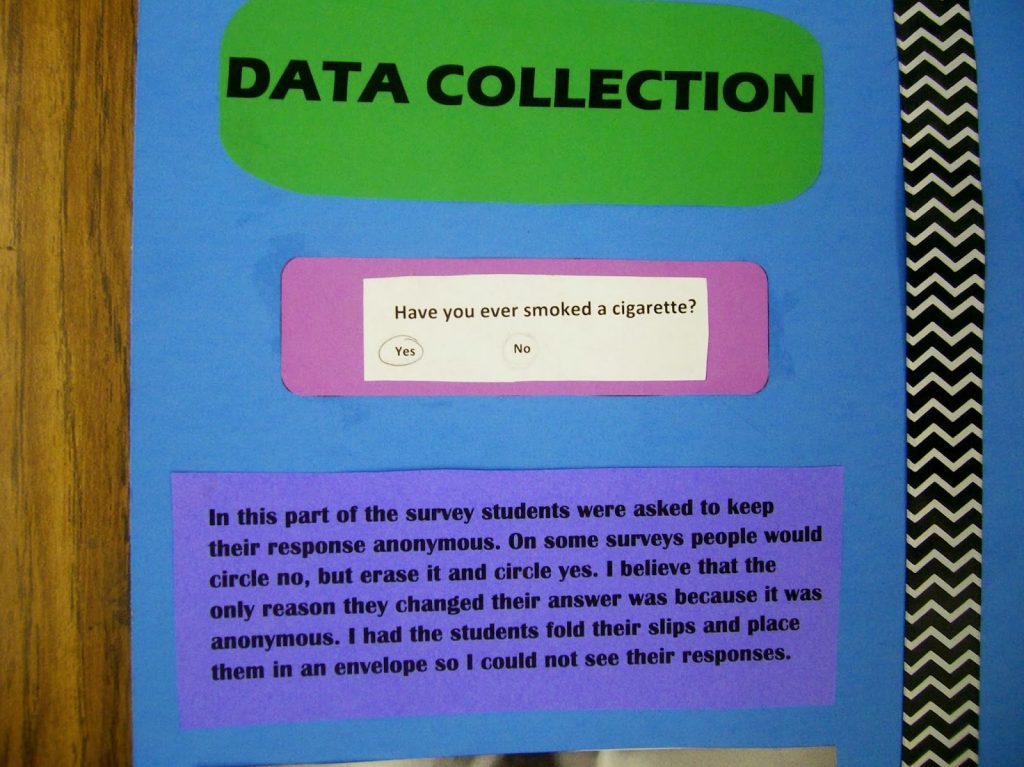
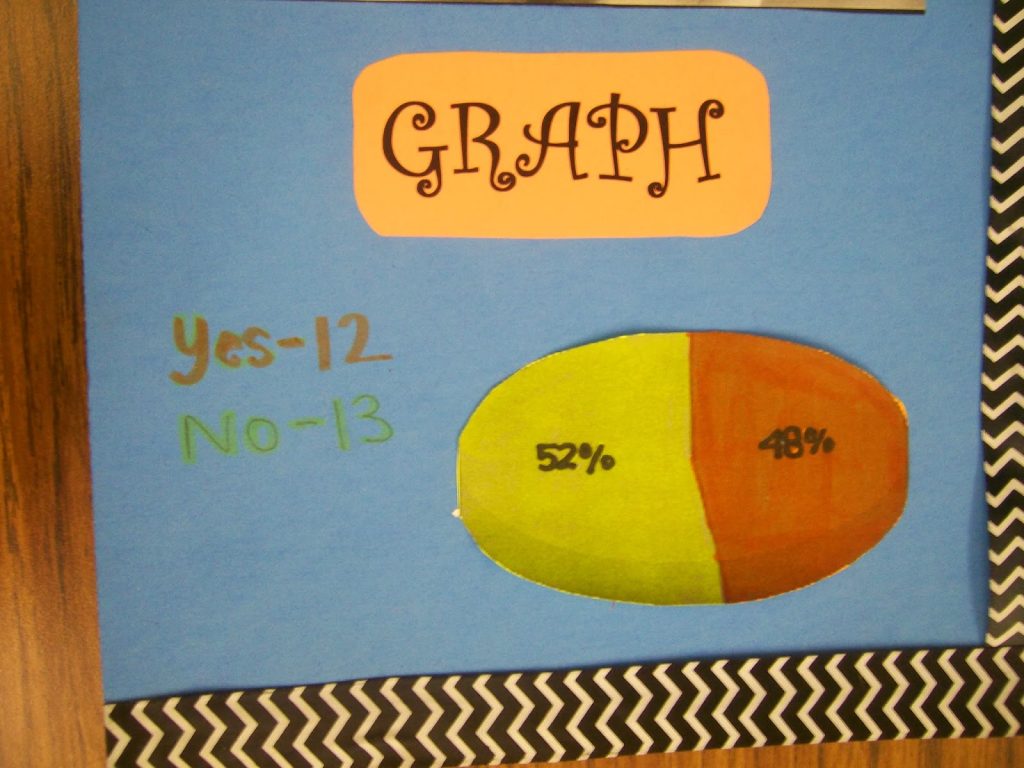
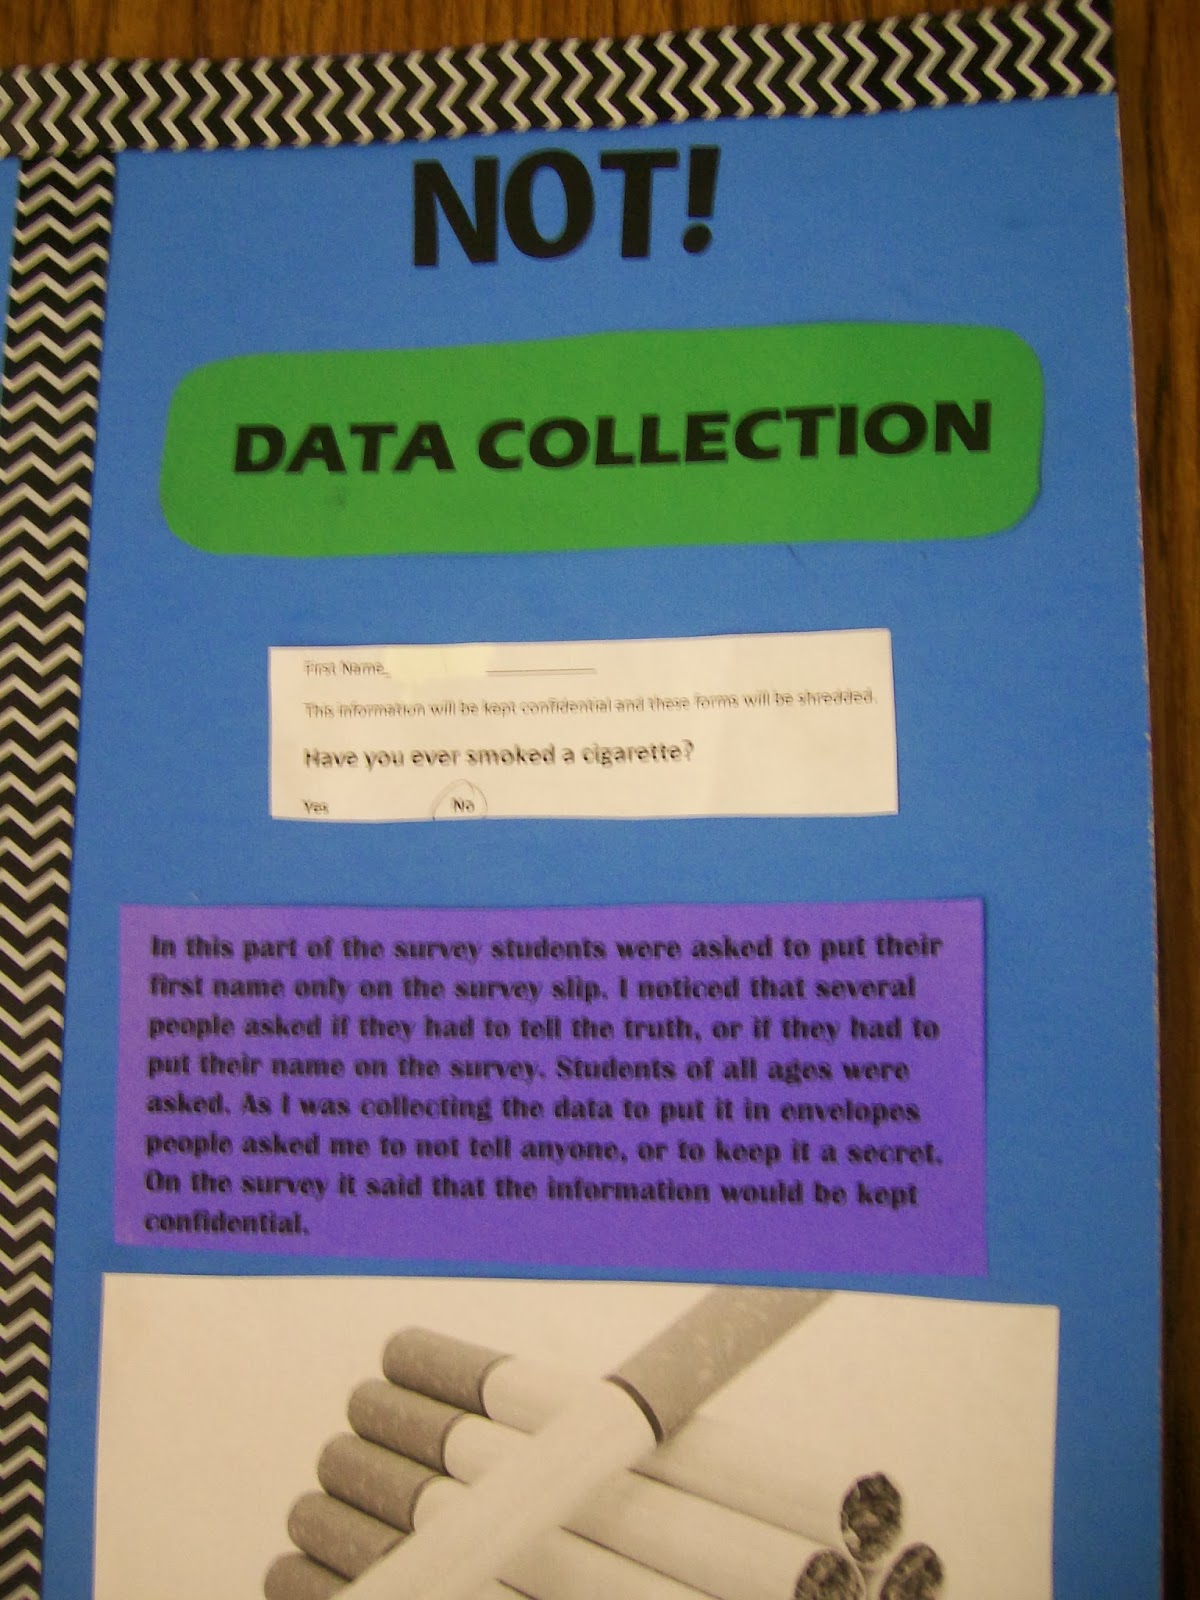
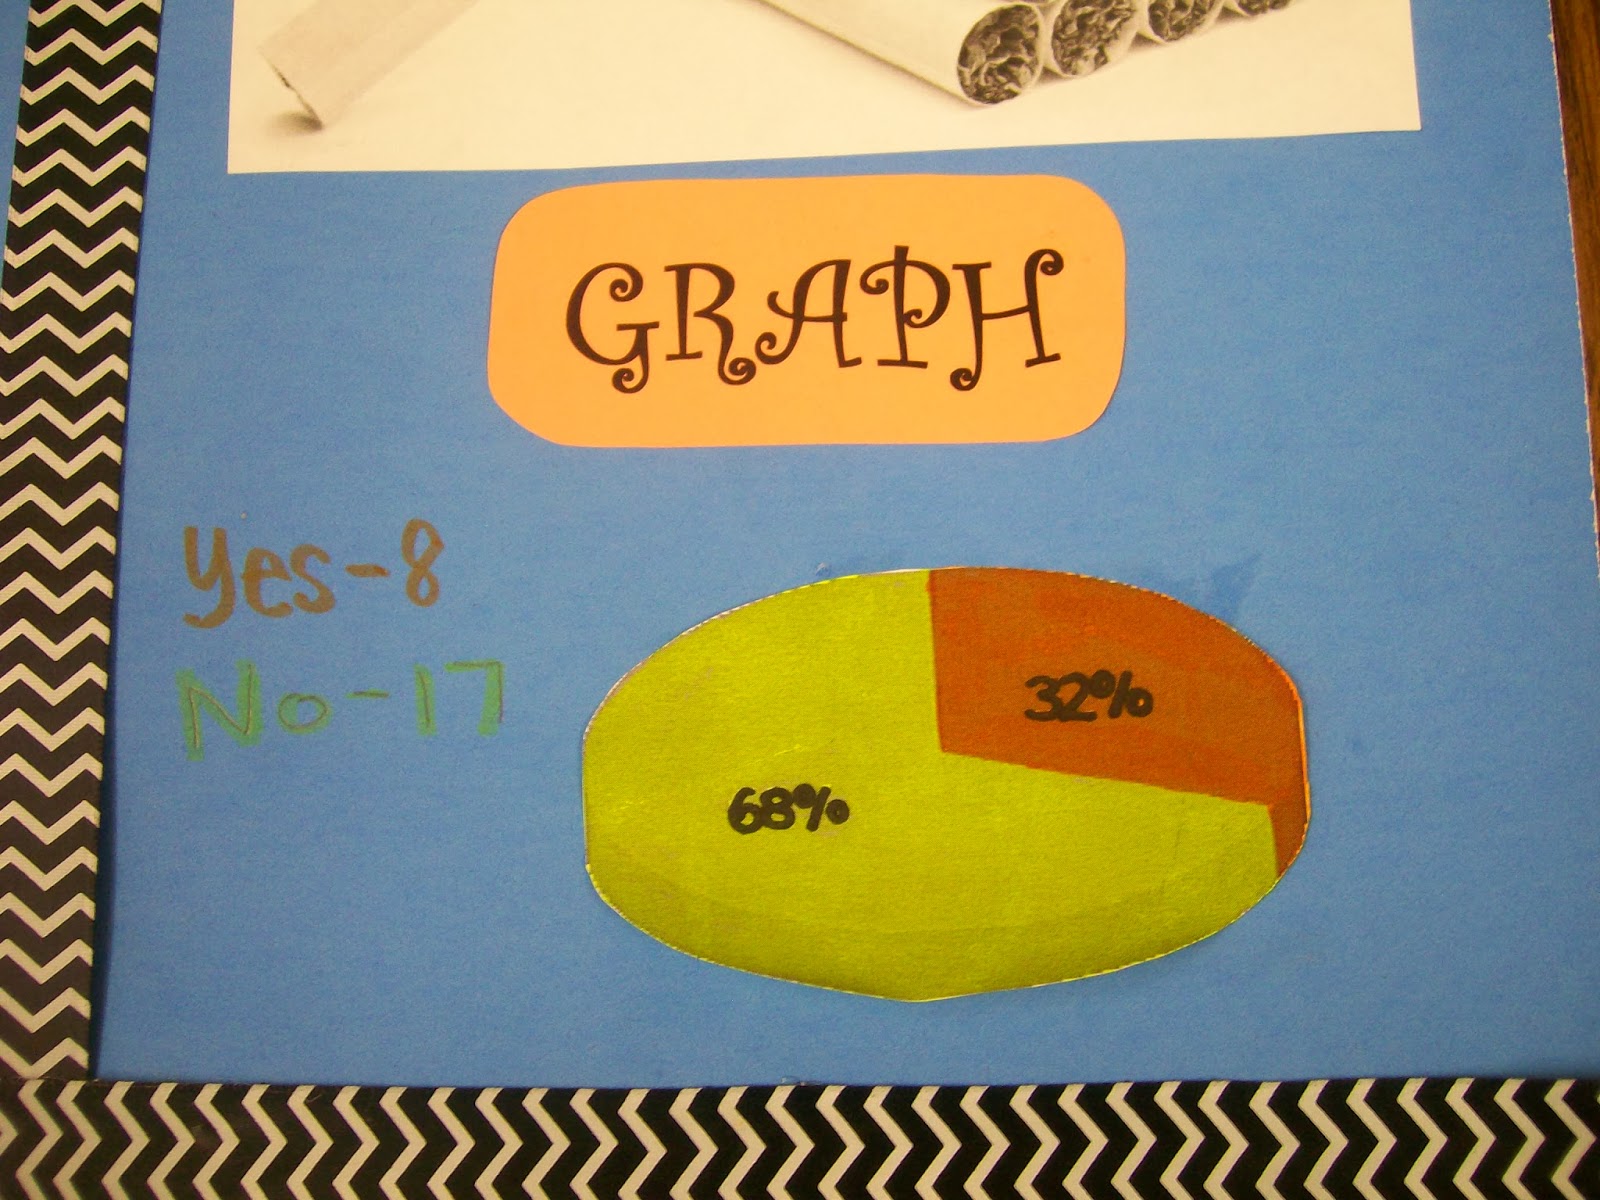
This first project explored the impact of anonymity when asking high school students if they had ever smoked a cigarette.
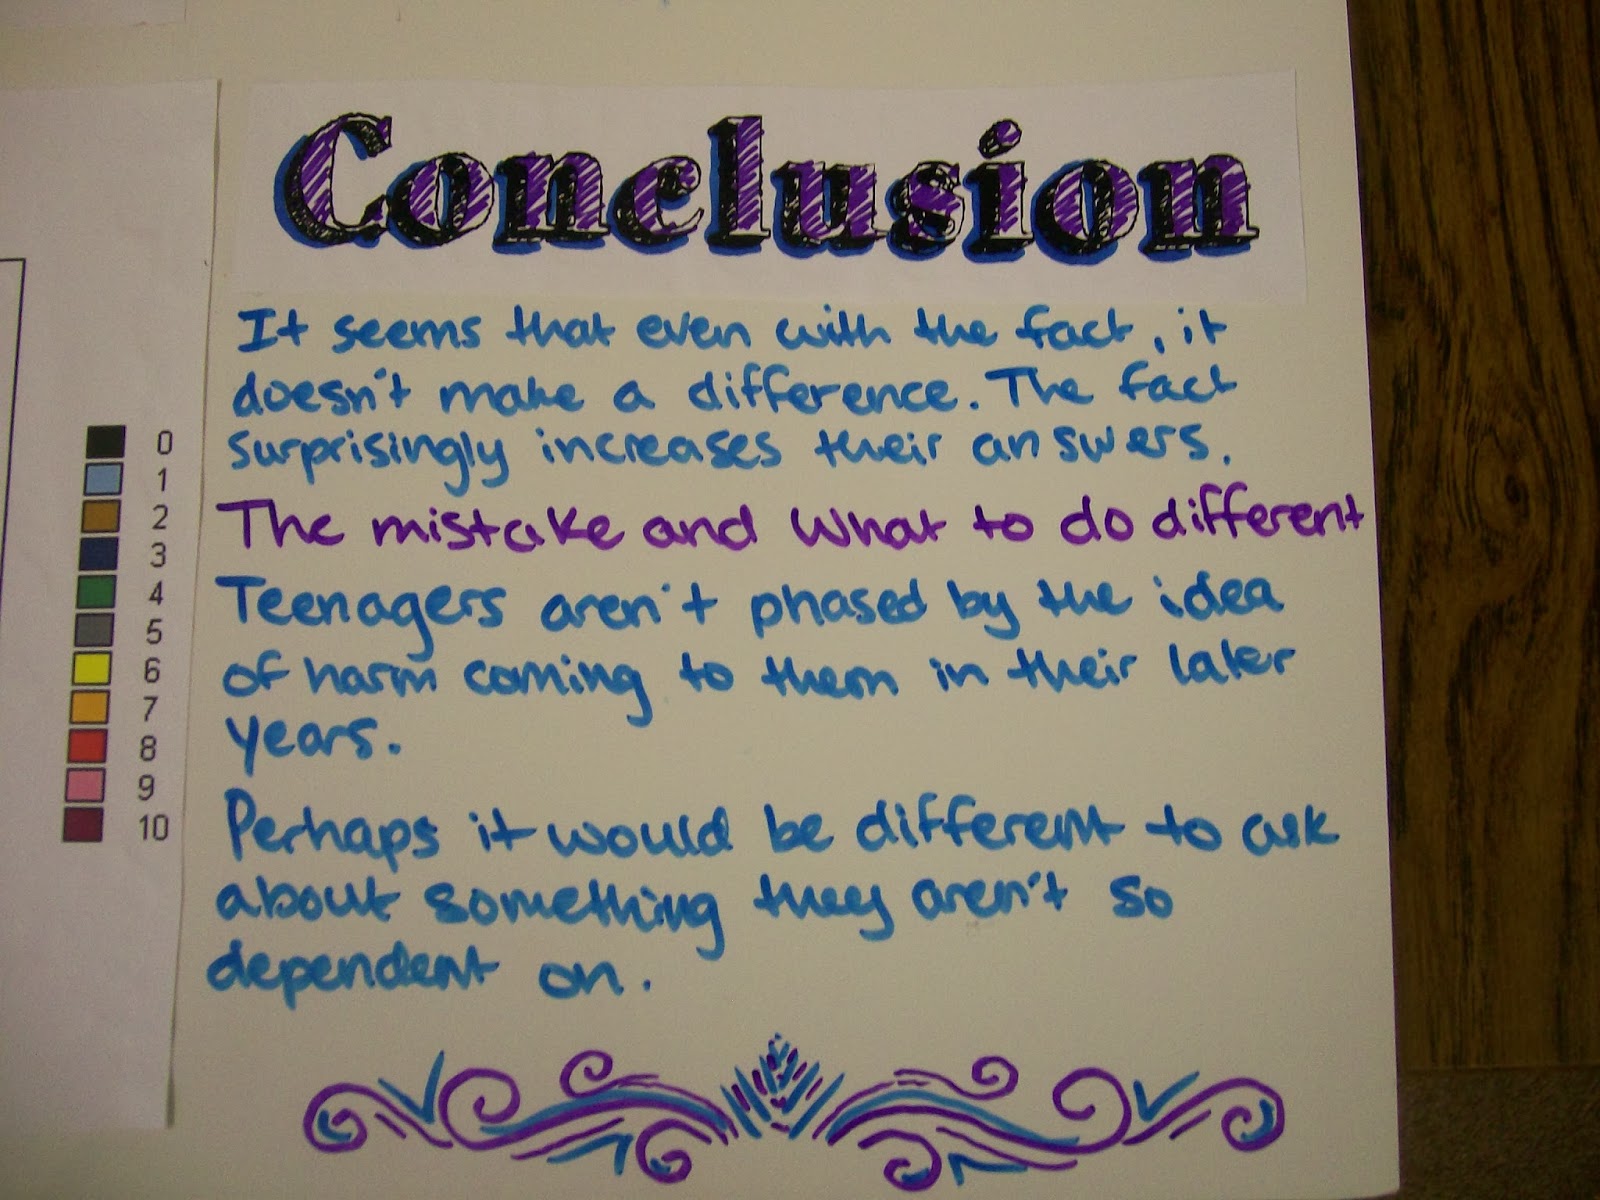
Another student explored the question, “Does adding a fact affect the answer?” We had to have a discussion on the difference between affect and effect.
I used a silly sentence I learned years ago to illustrate the difference: “The arrow affected the aardvark. The effect was eye-popping.”
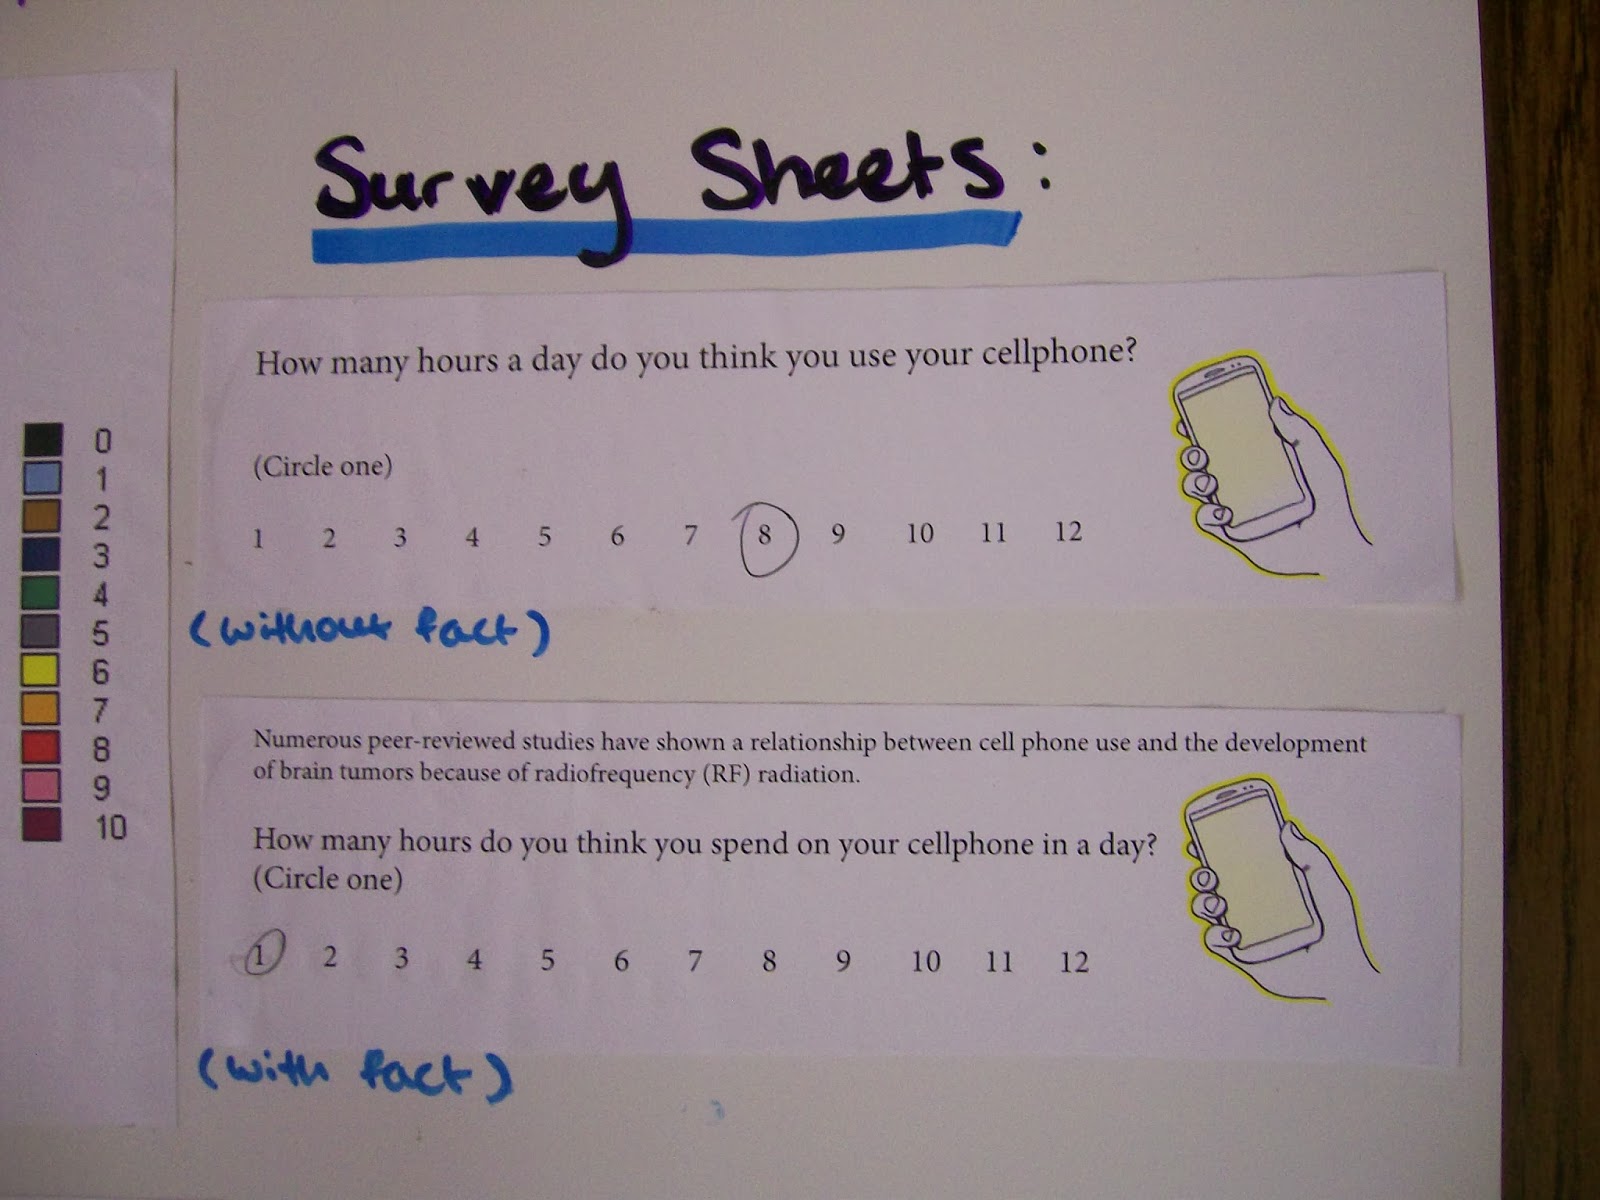
This student surveyed people about how many hours they spend on their cell phones each day. Some students were given a survey sheet that only featured the question.
Other students were given a sheet that had a fact regarding the potential dangers of cell phones before the question.
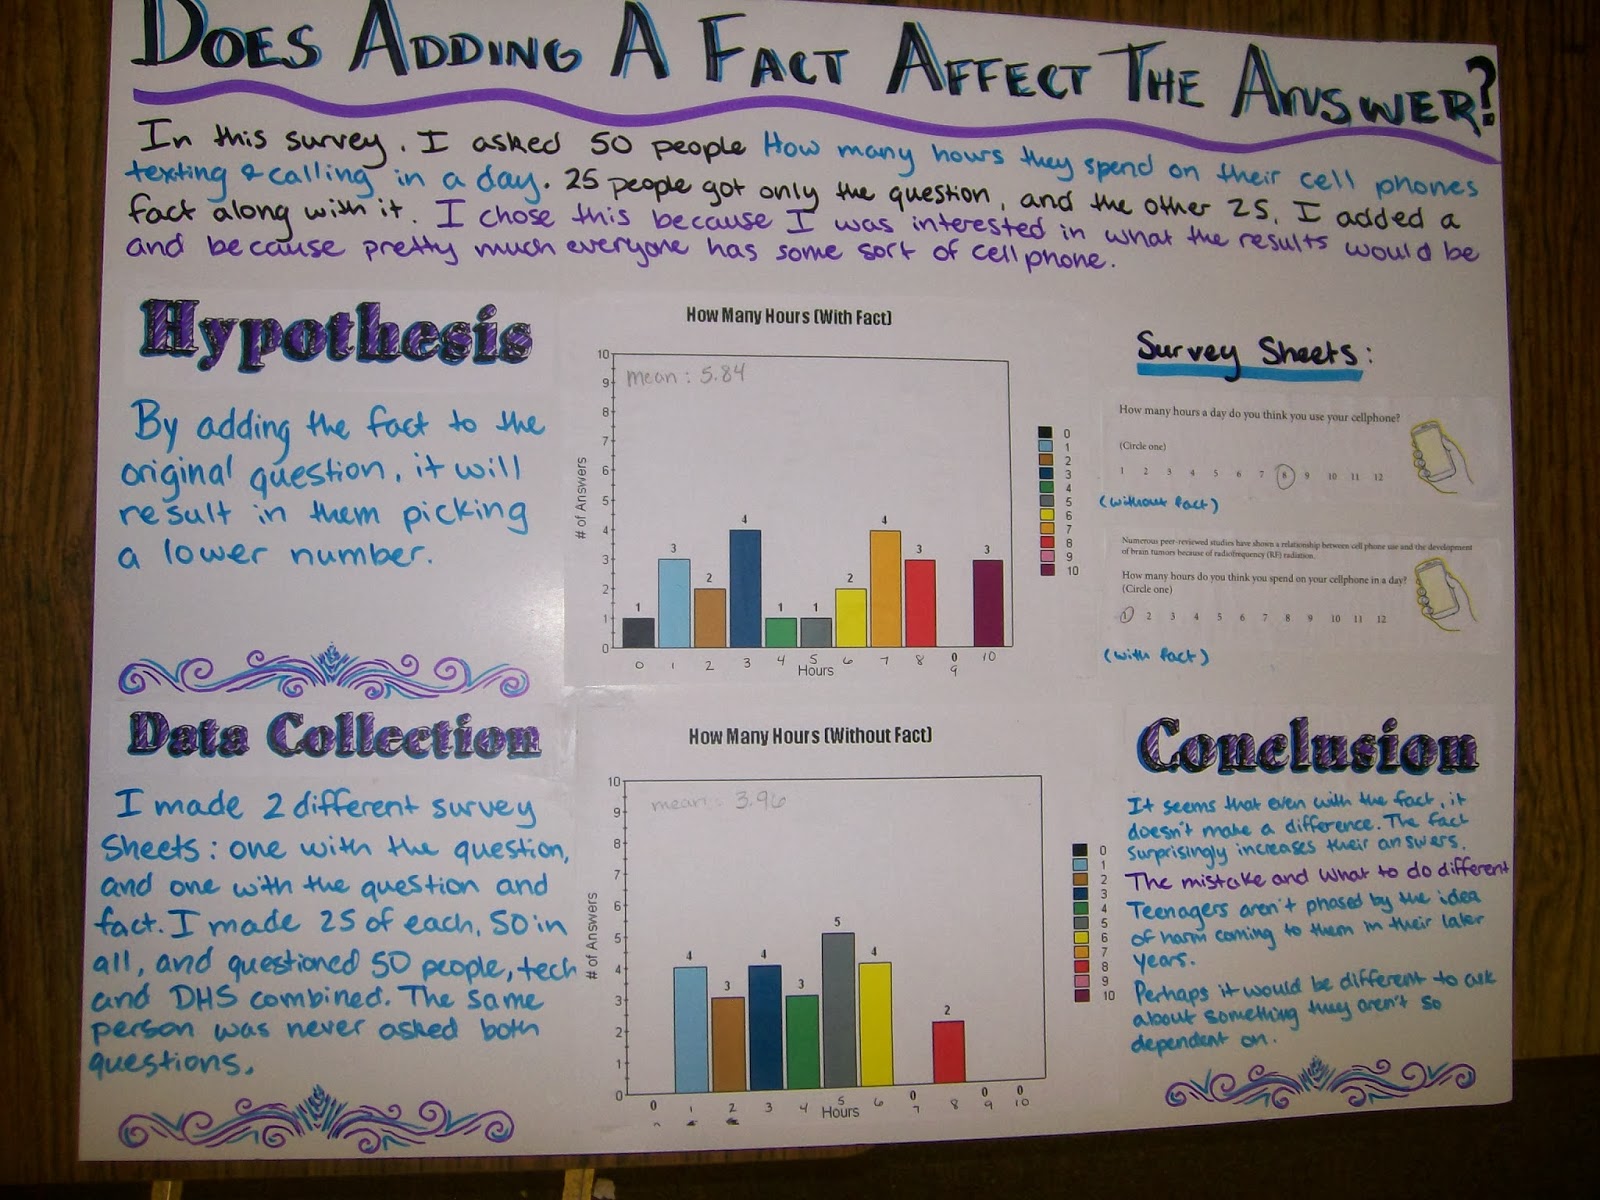
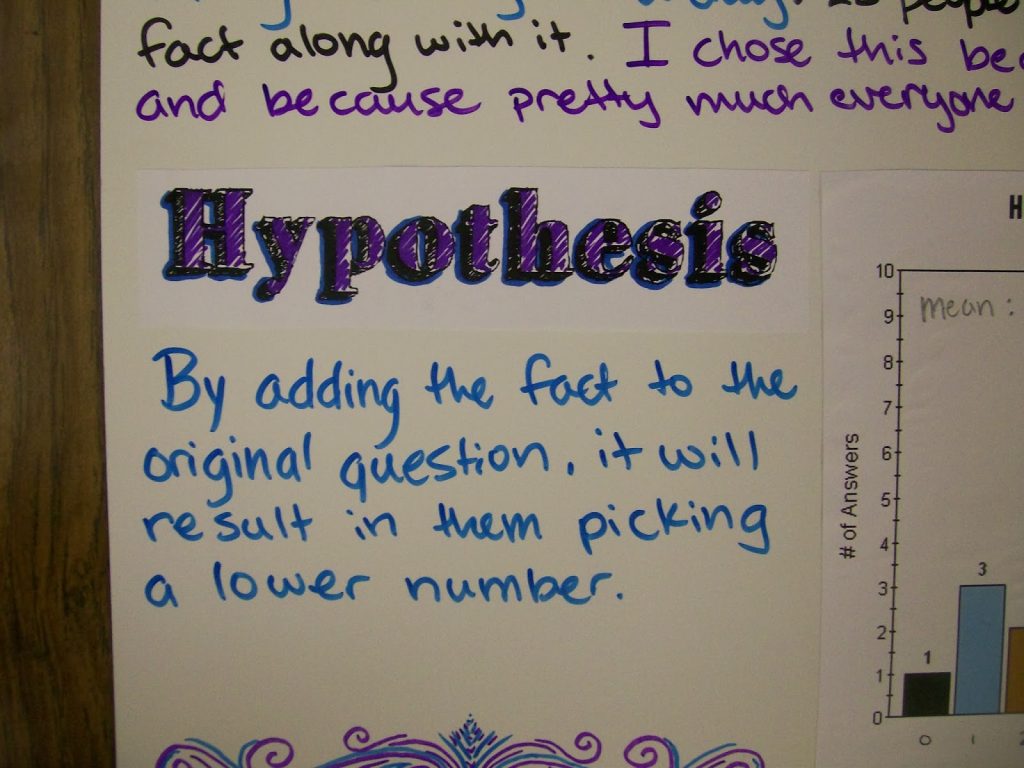
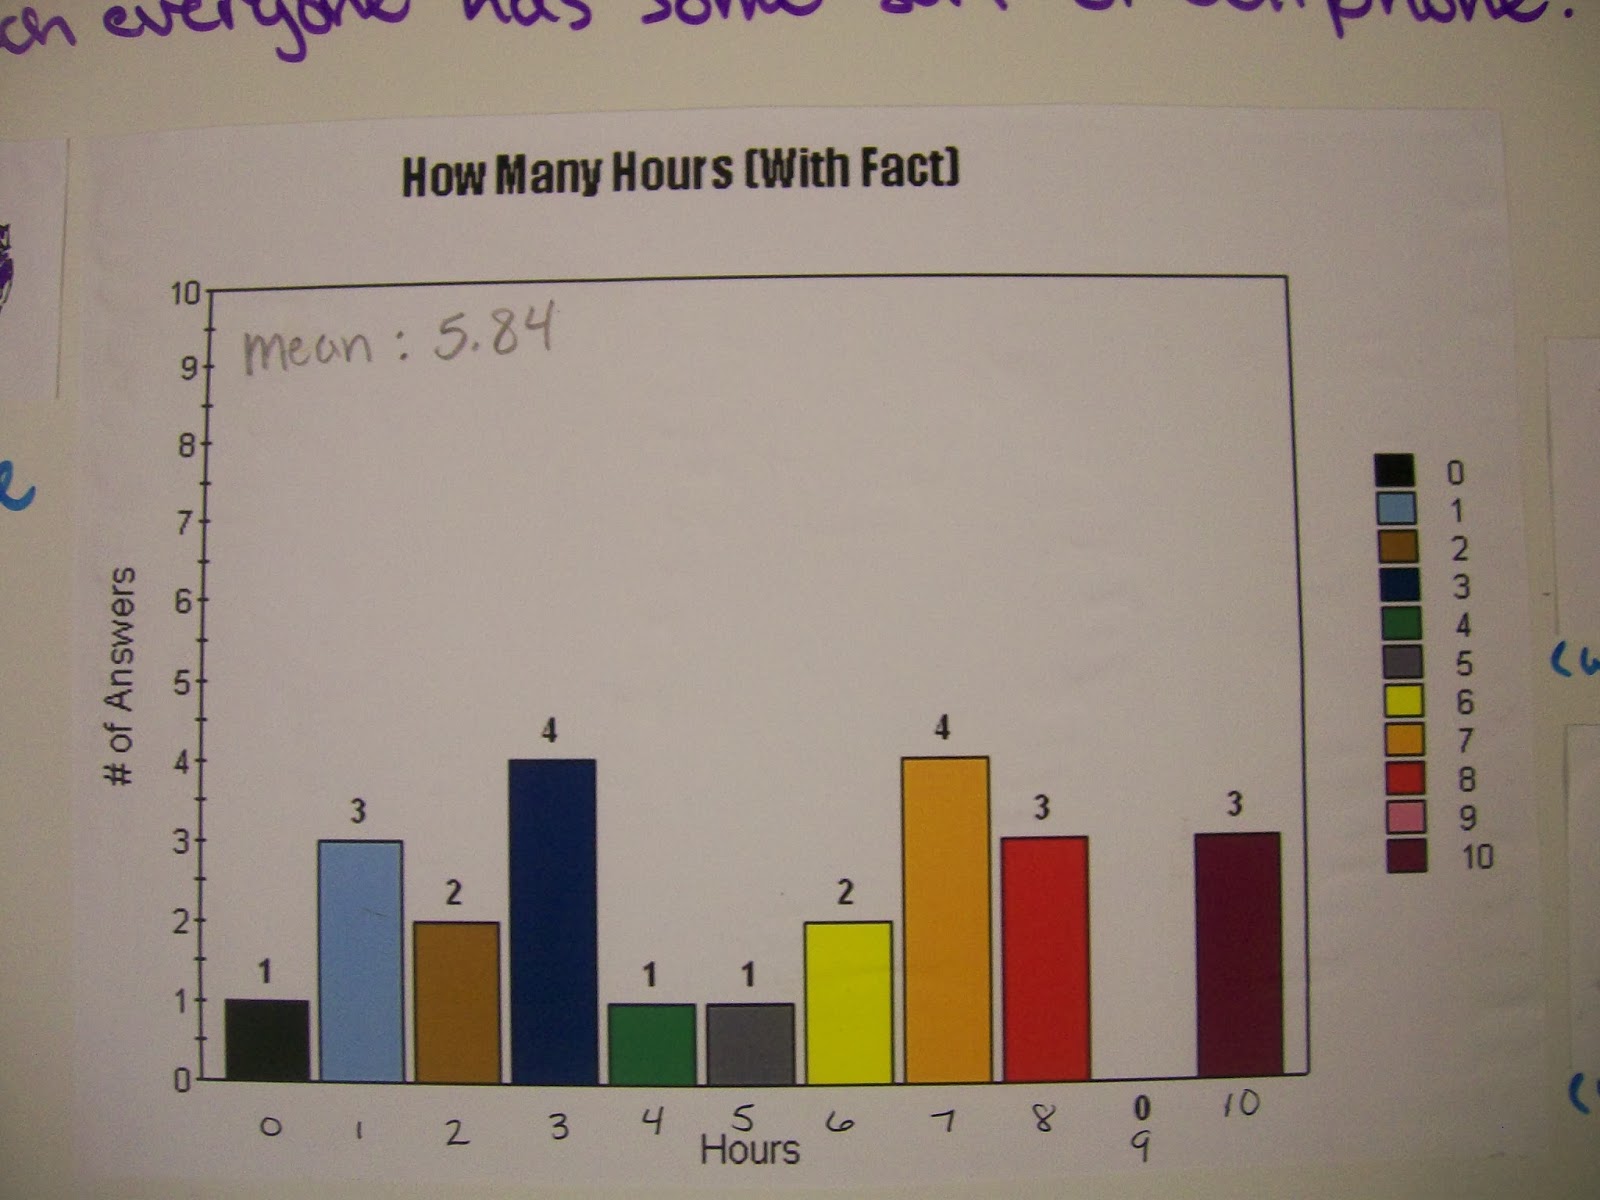
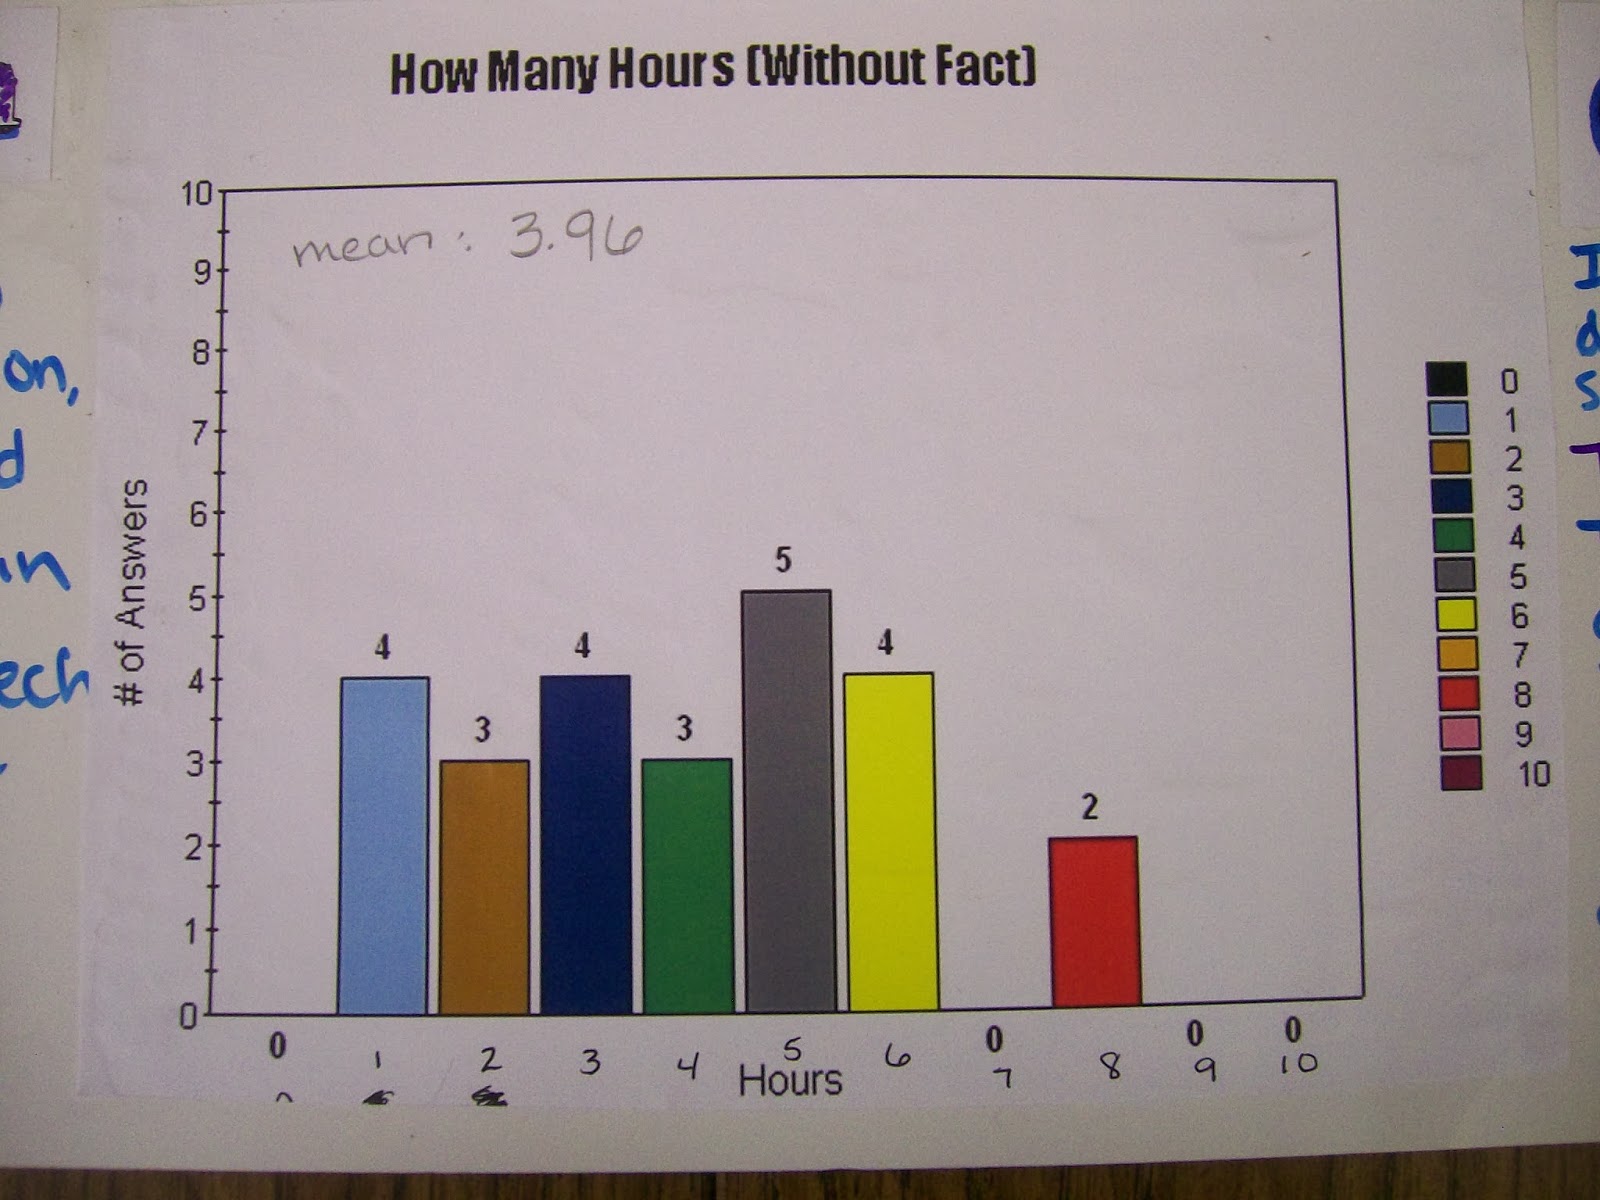
This student was especially distraught about the results she obtained. When she added the fact to the survey sheets, the mean response rose!
We had a good discussion about why the results didn’t necessarily line up with her hypothesis.
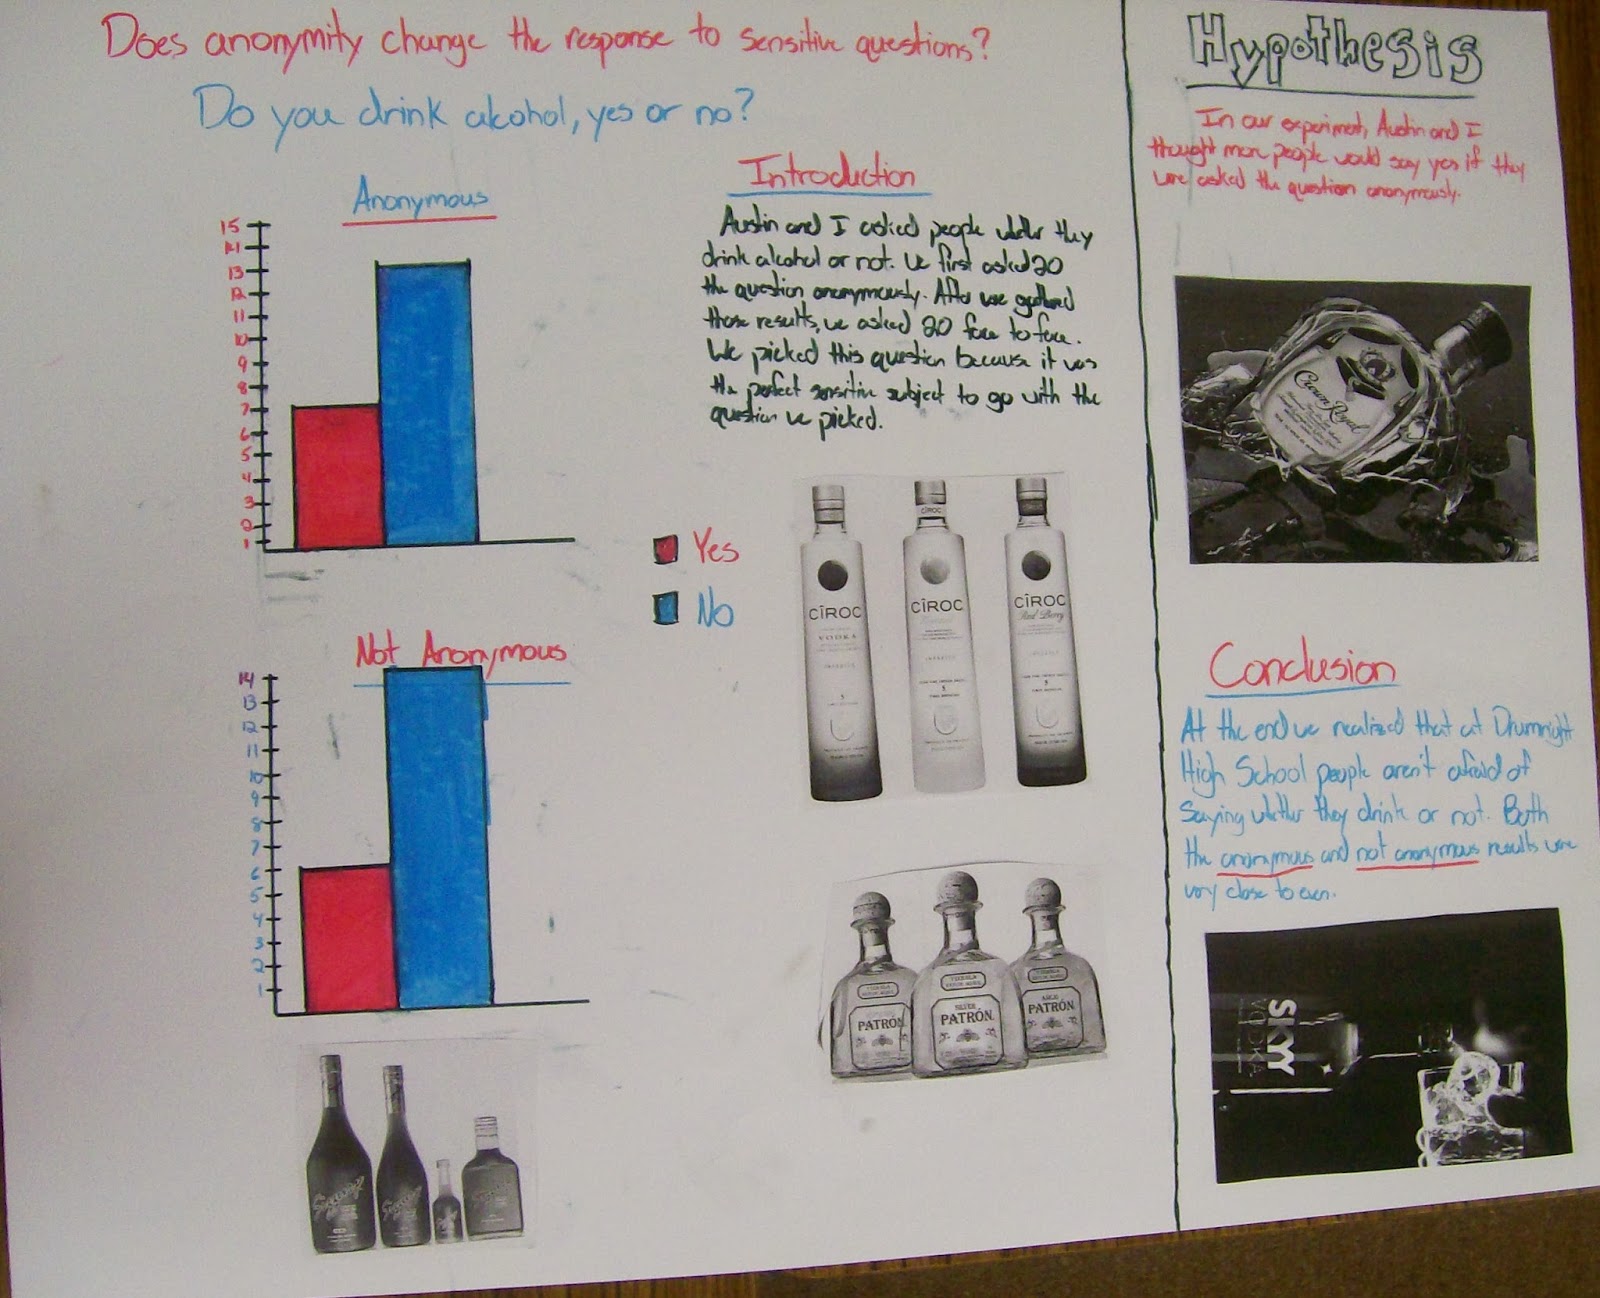
The final group chose to survey students about their alcohol drinking habits. They, too, explored the impact of anonymity on survey results.
Interestingly, they got almost the same results from both their anonymous survey and their non-anonymous survey.
The boys concluded that the students had lied in both surveys.



You can ask here for a help. They helped me a lot an i`m highly satisfied with quality of work done. I can promise you 100% un-plagiarized text and good experts there. Use with pleasure! Evolution Writers