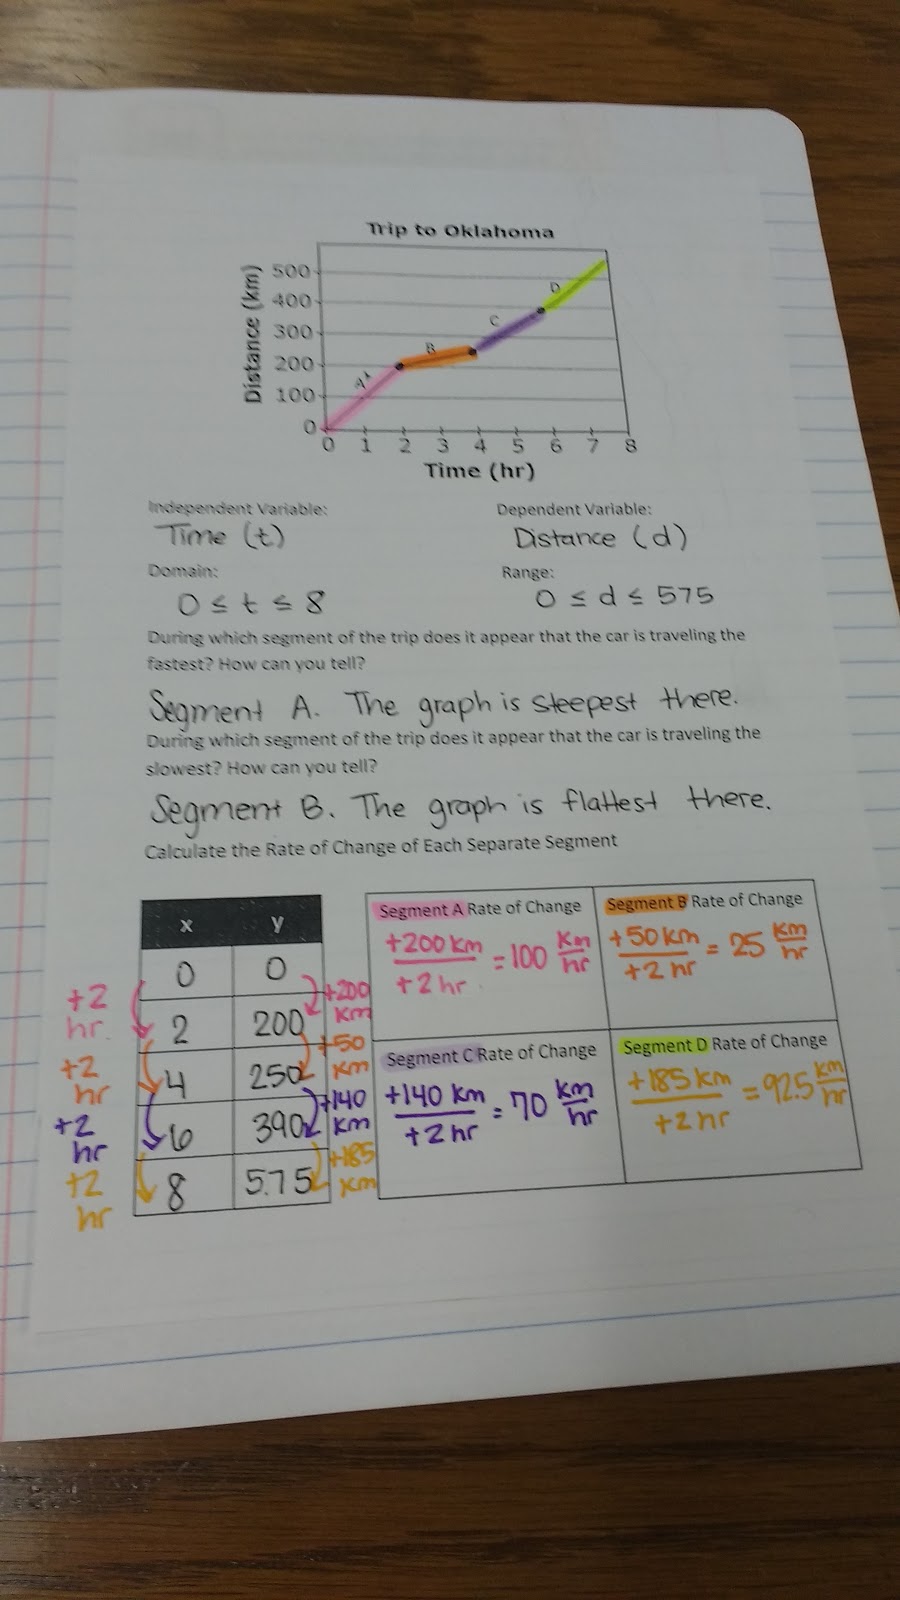
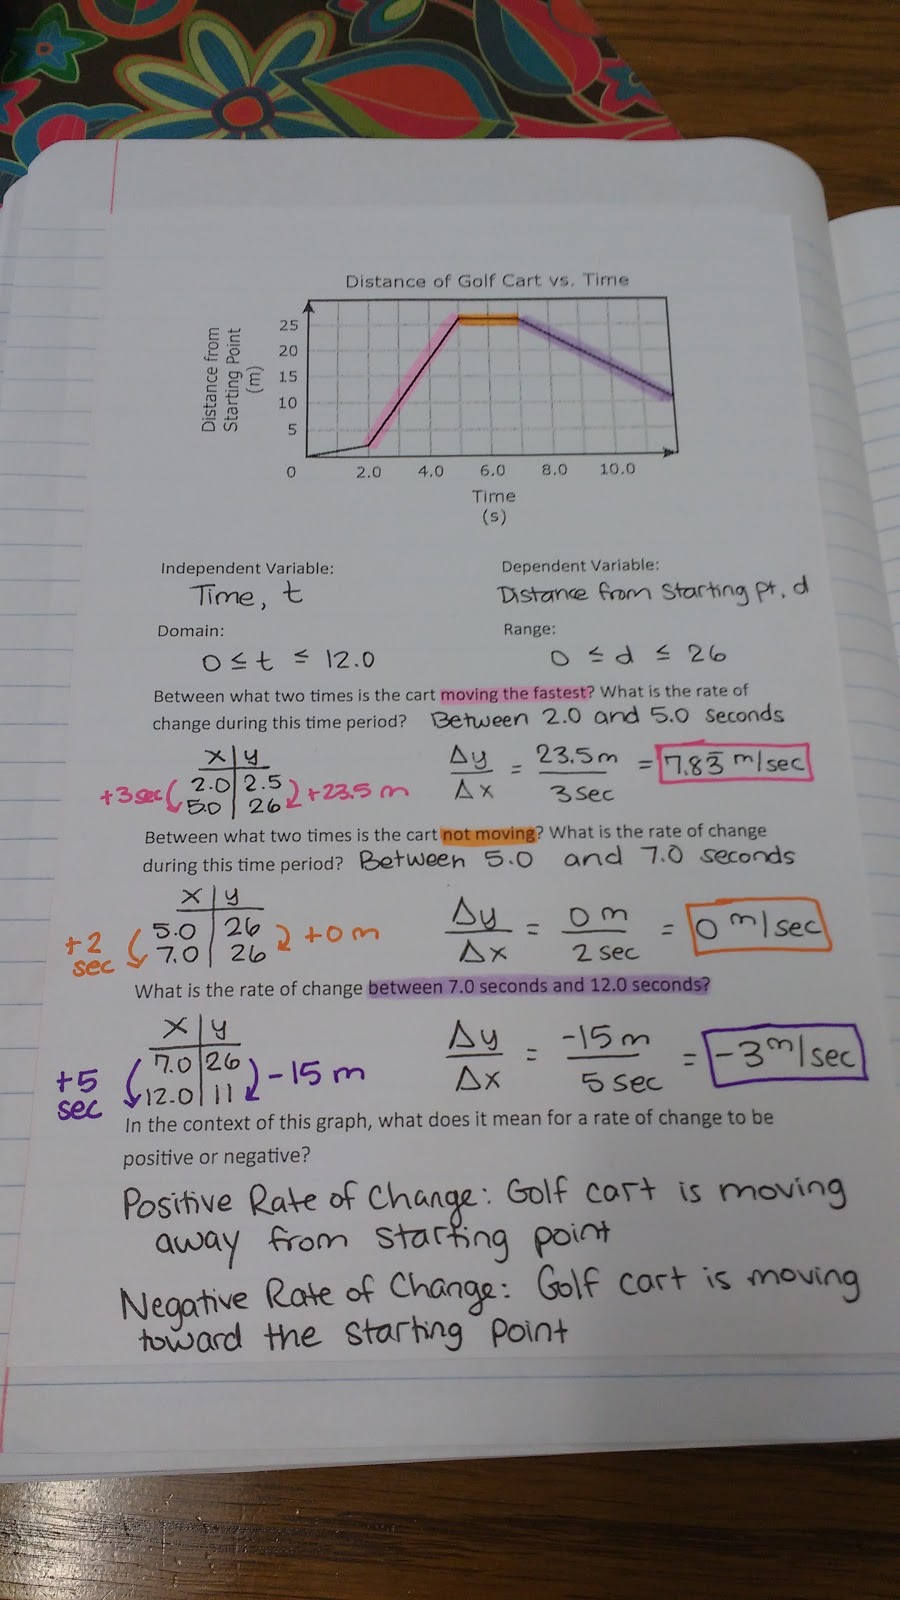
Rate of Change Interpreting Graphs Practice
After looking at graphs with a constant rate of change, we shifted to graphs that have various rates of change. I’m a bit disappointed that both graphs I chose were distance-time graphs. This is definitely an area of improvement for next year!