Trig Mini Poster Project
This is my first year teaching trig, so I’m figuring out a lot of things as I go. There is no textbook. No pacing guide. Just my own experiences with taking trig in high school to guide me. This is both exciting. And scary.
My memories of high school trigonometry involve lots of graphing on the calculator. I didn’t want to take this approach. My kids already seem to rely to much on the calculator to do their thinking for them. And, I feel like one of the areas I failed these kids in Algebra 2 was transforming functions. When they see a trig function, I want them to really see and think about what is going on with the graph, not just type an equation in their calculator and sketch the result.
So, long story short, my kids didn’t really freak out when I asked them to graph trig functions by hand. In fact, they think it’s a completely normal thing to do. Yay 🙂 Eventually, I had to spill the beans and admit to them that I doubt their college professors will ever ask them to graph a translated tangent graph by hand. “But why not? It’s so easy!”
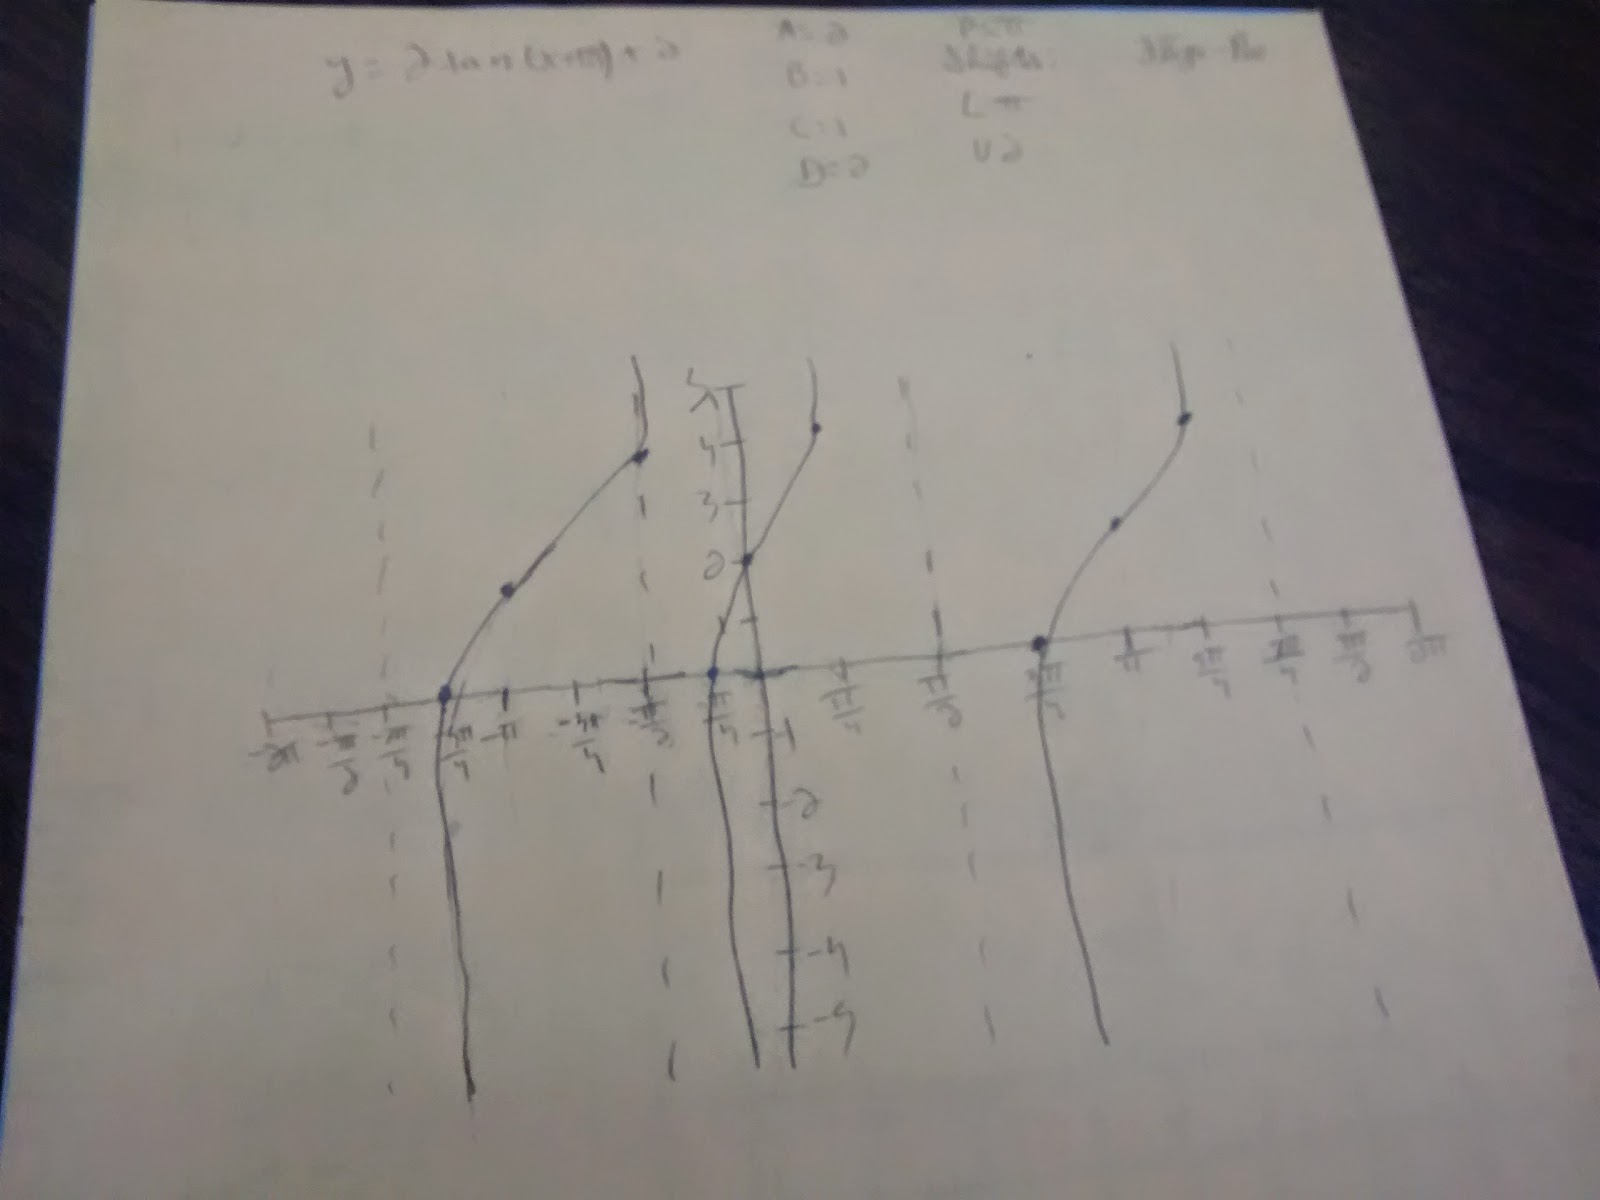
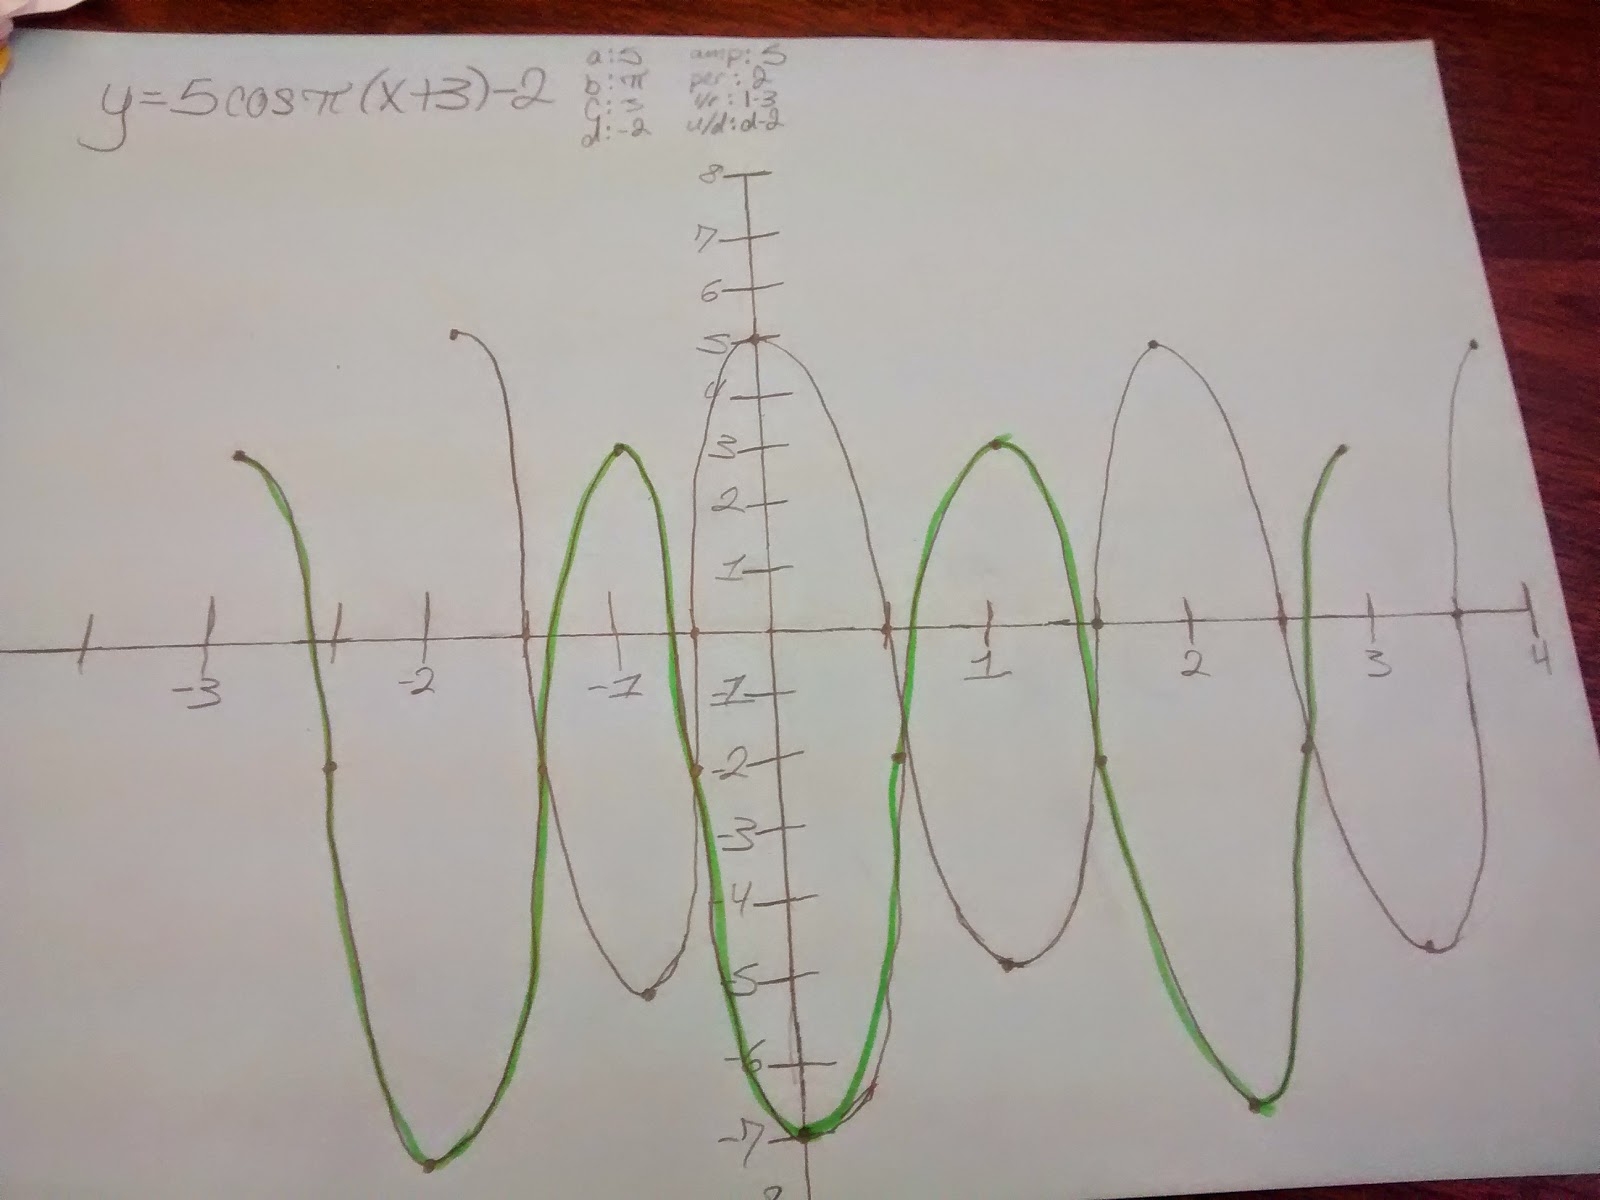
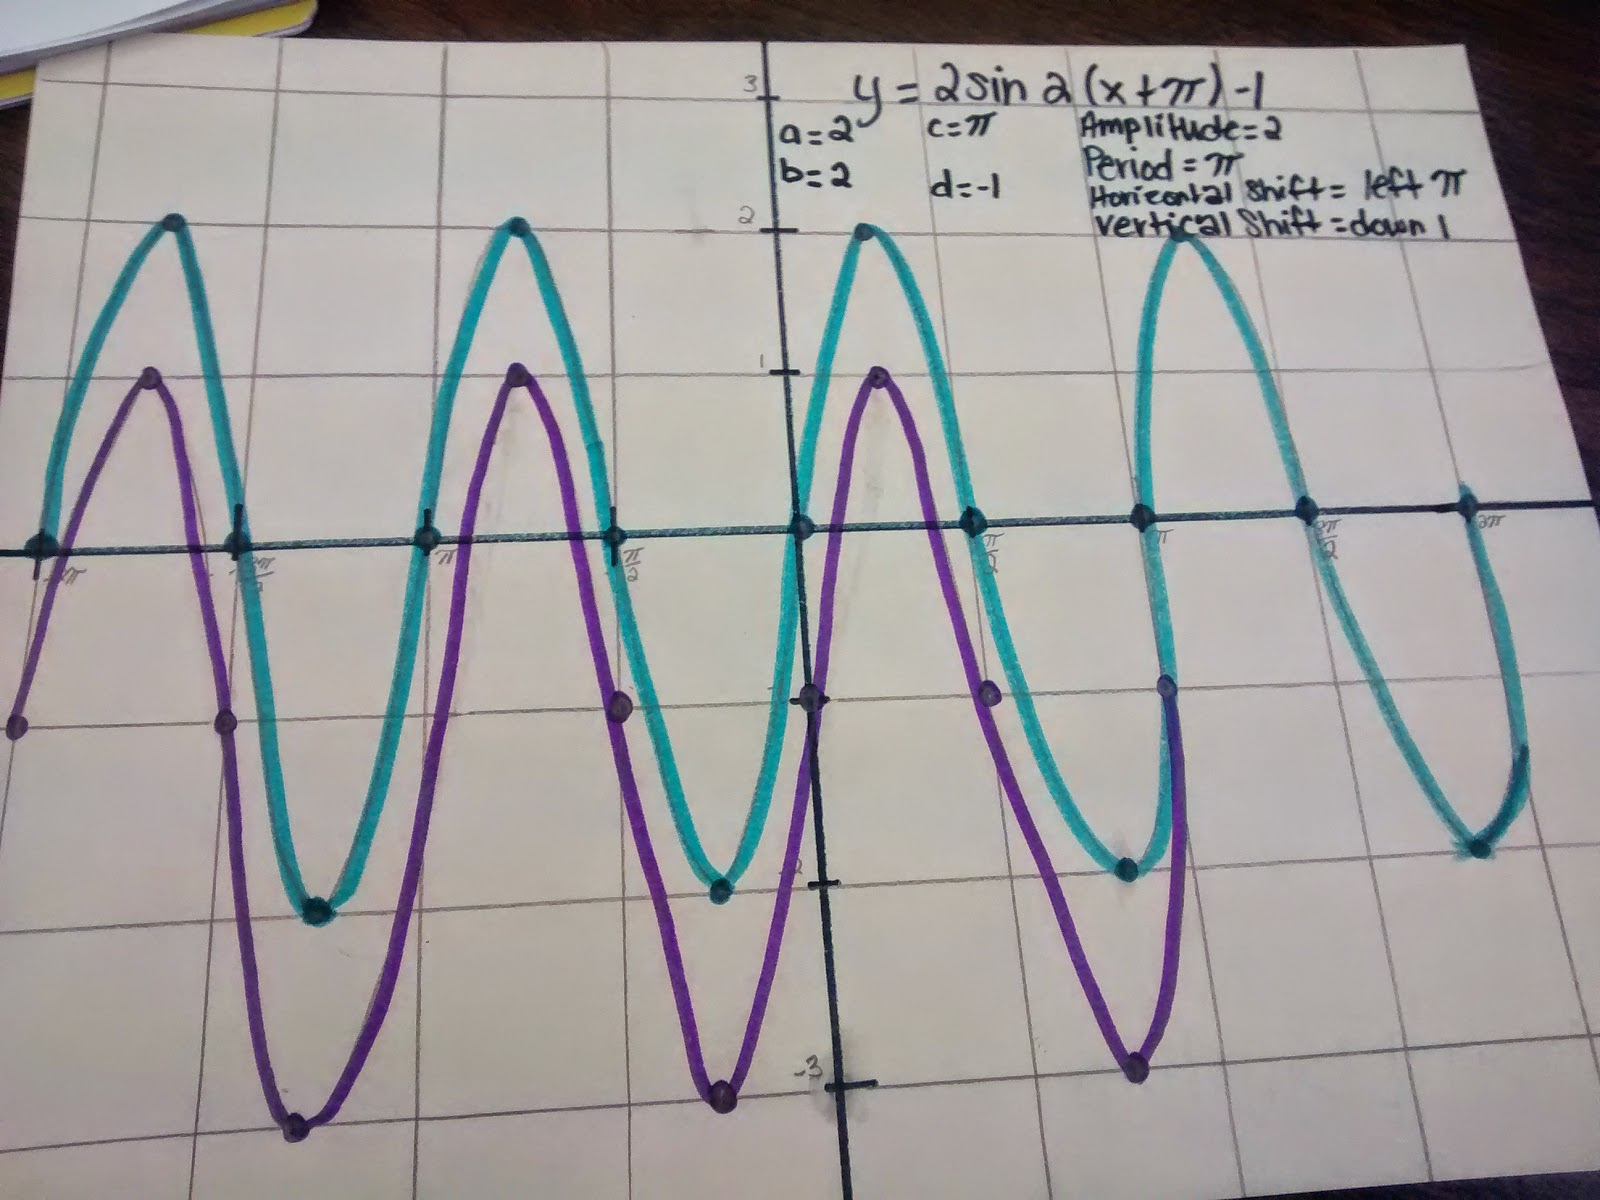
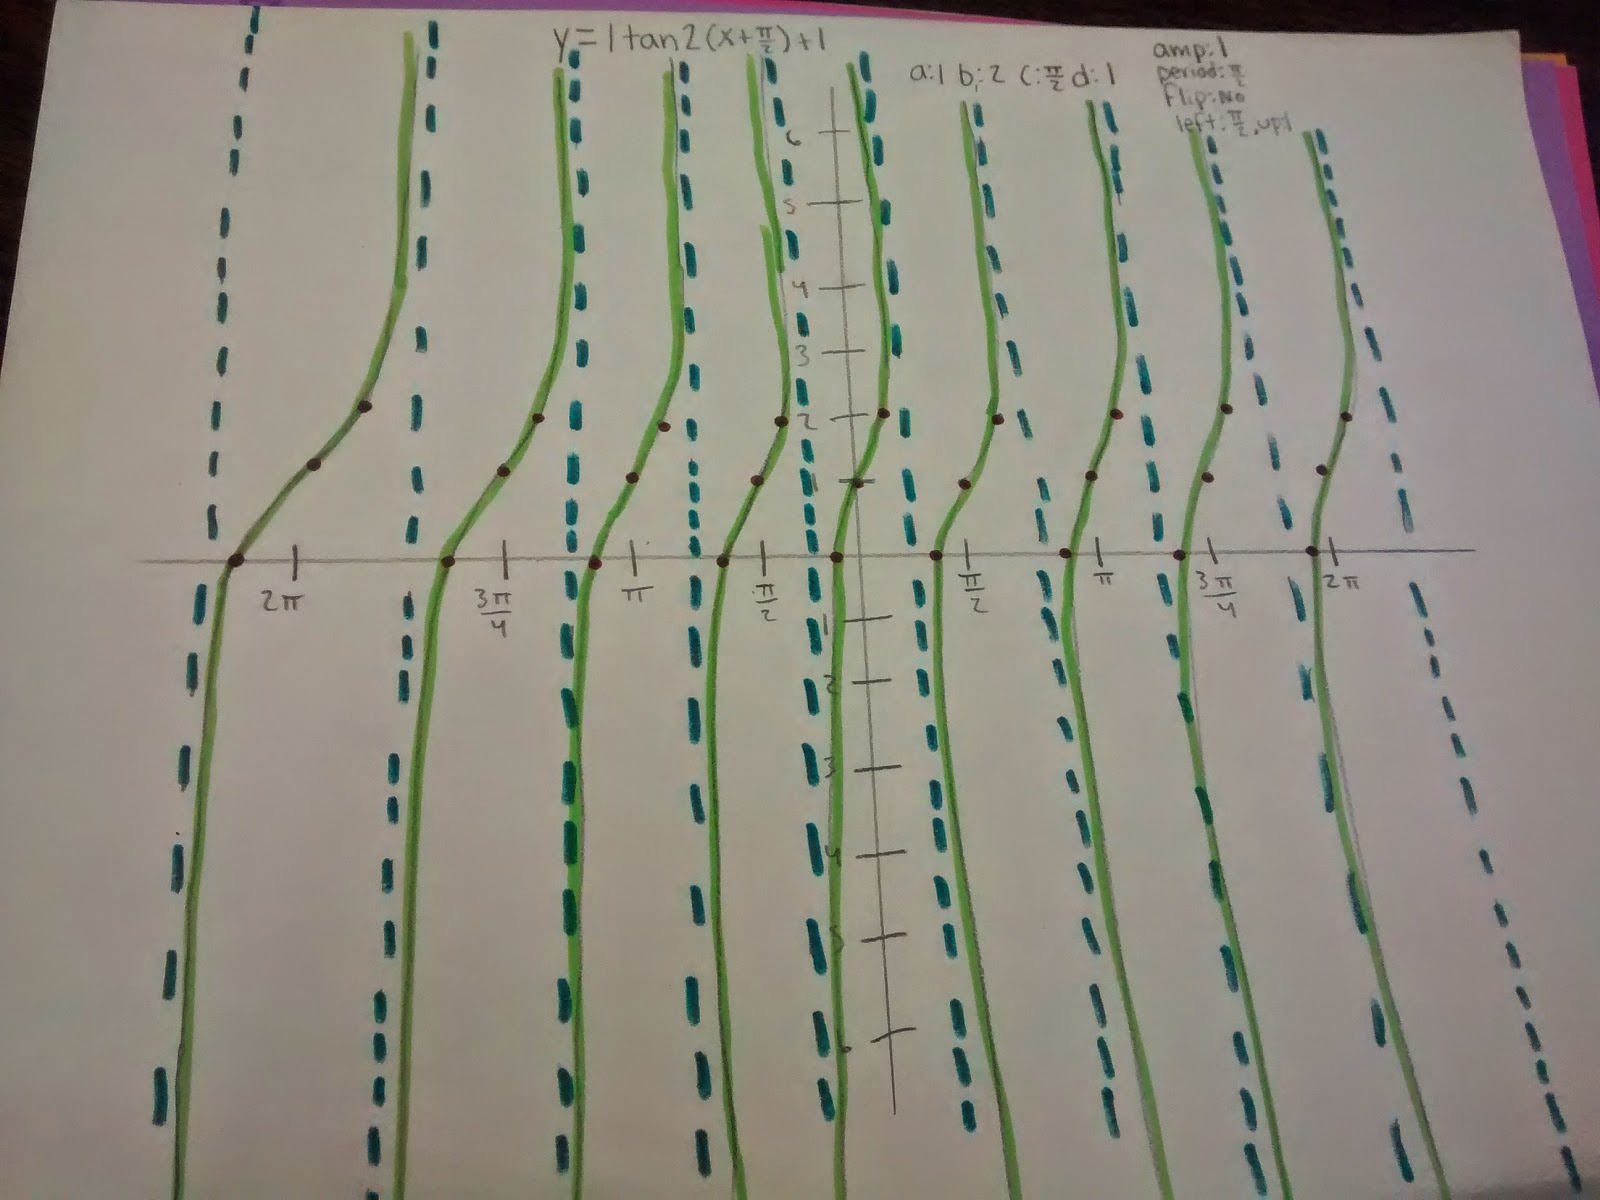
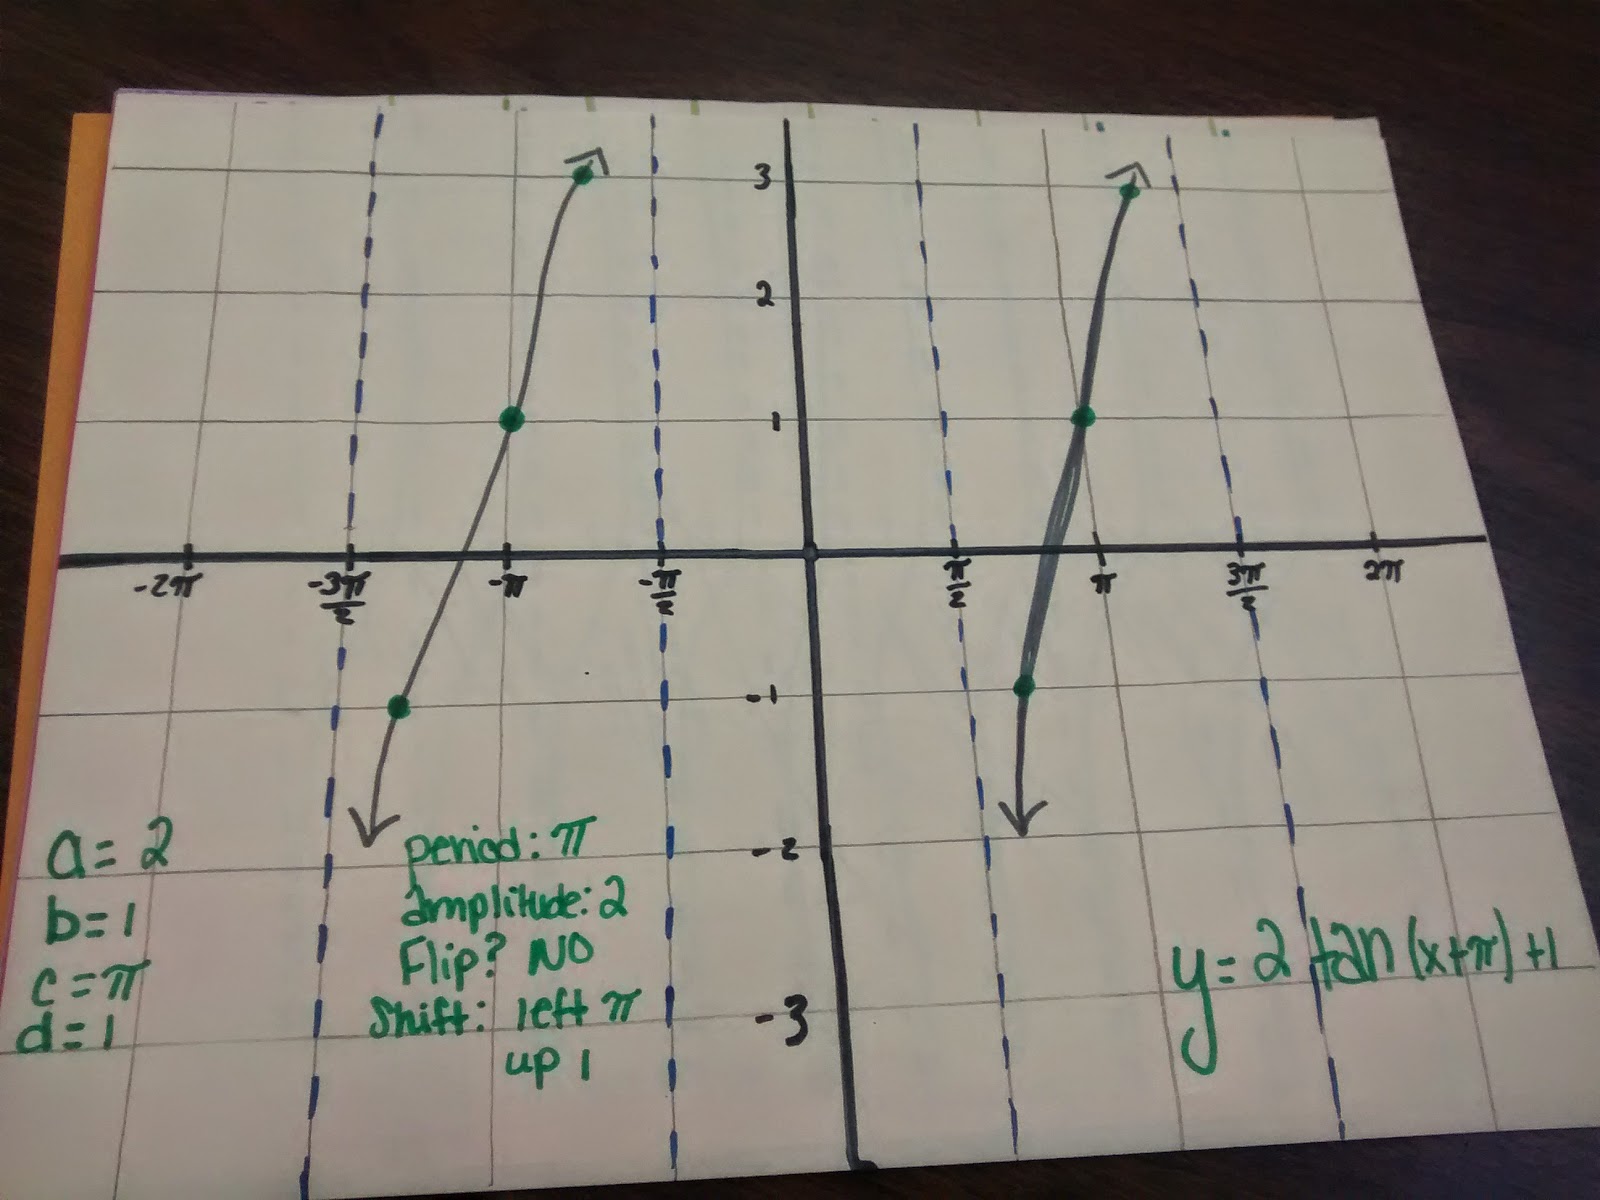
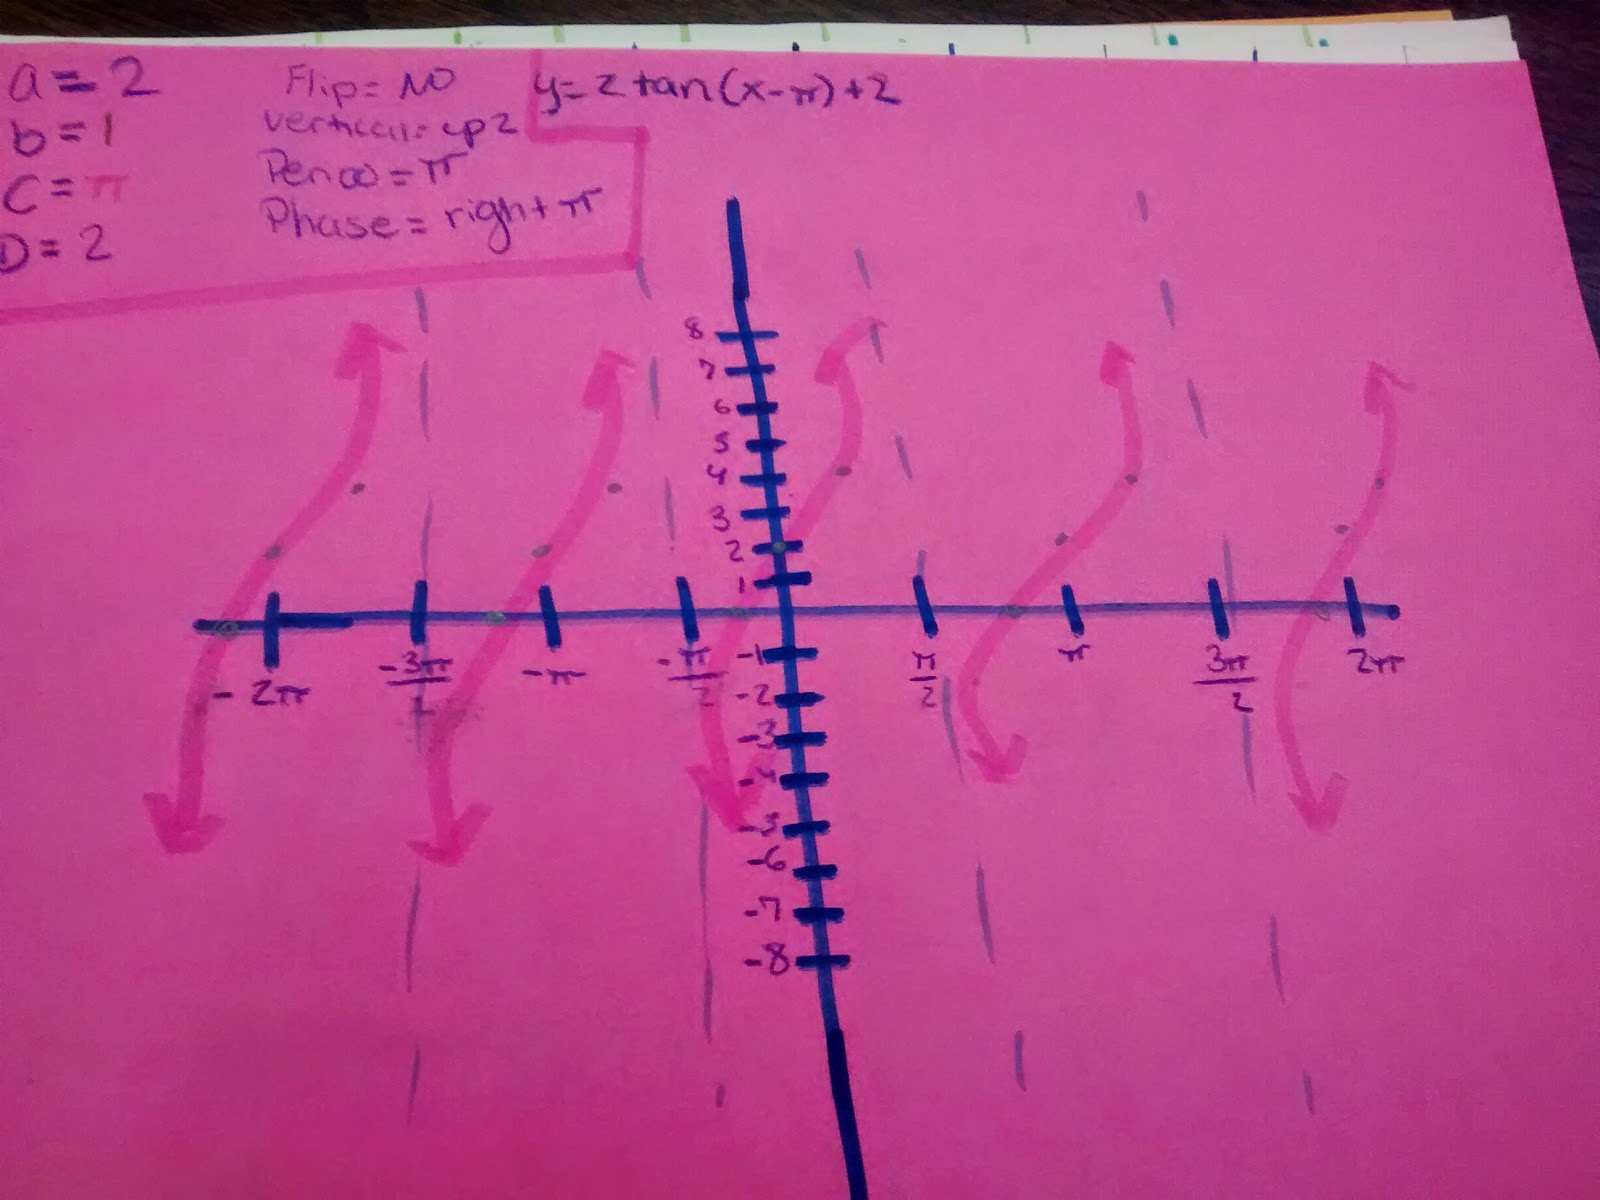
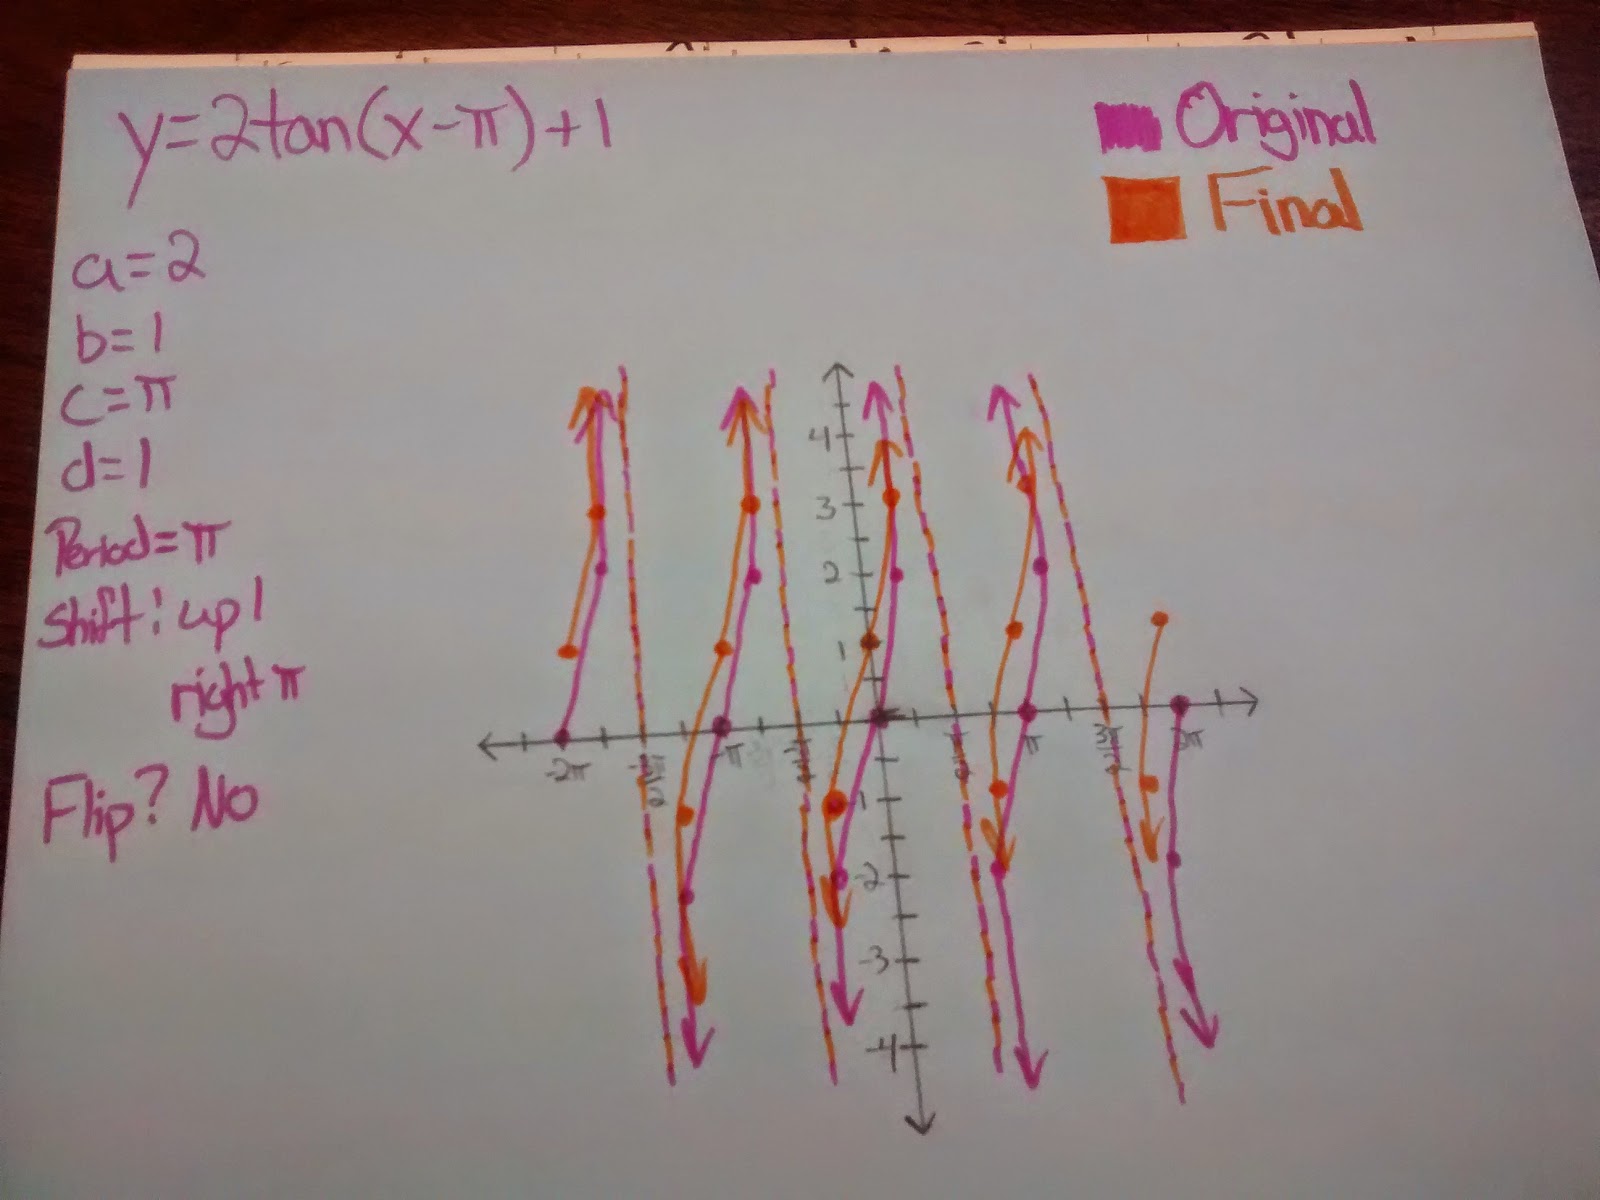
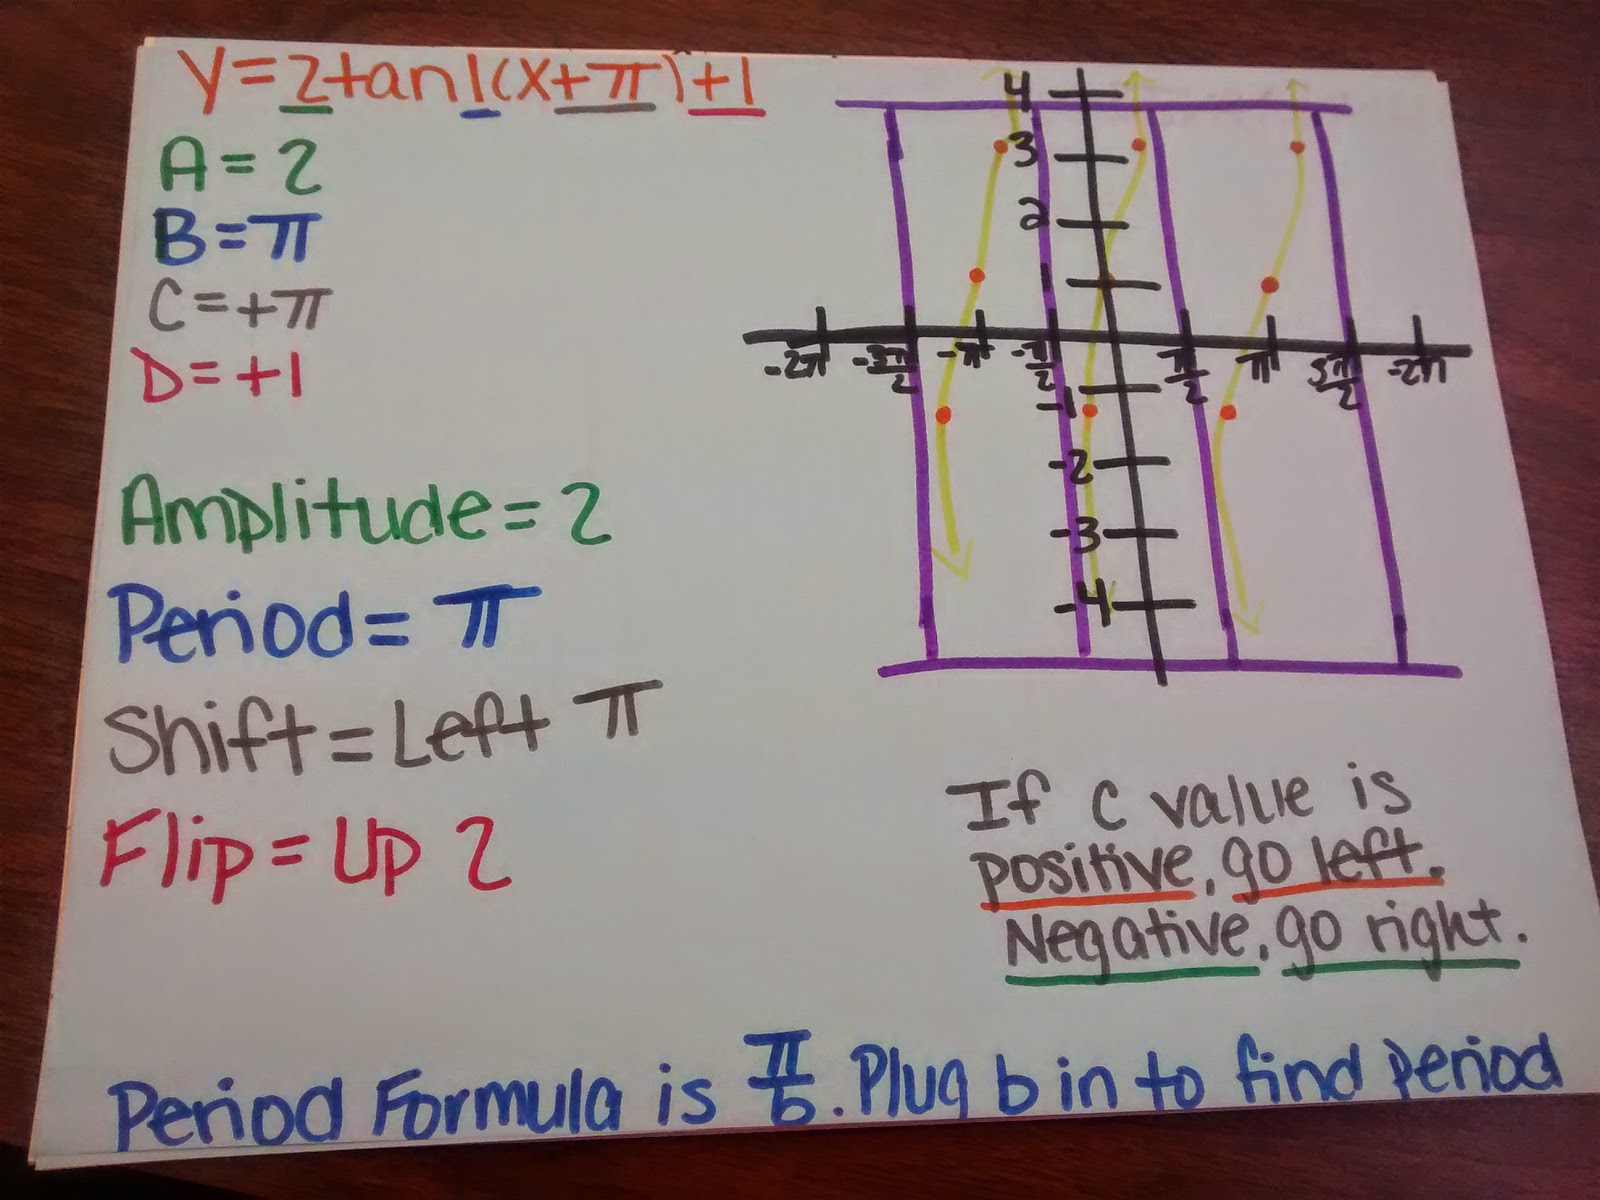
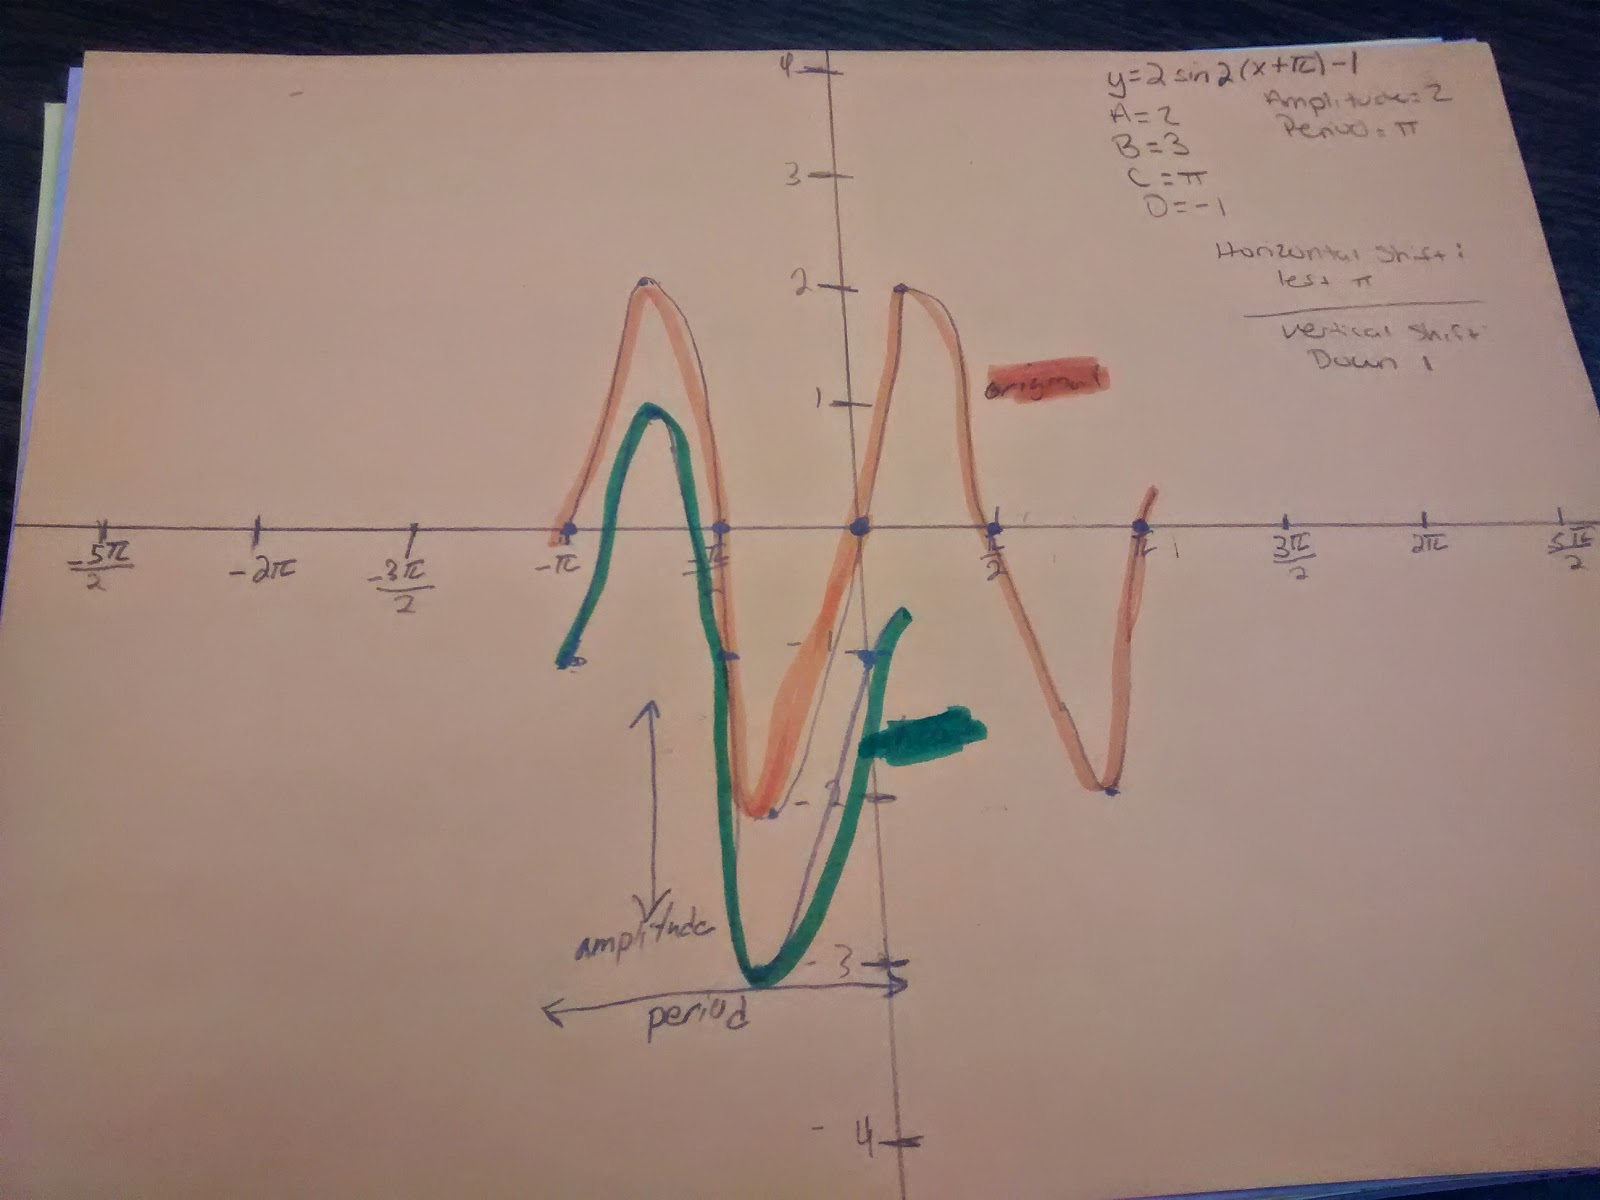
One thing I’ve done this year is ask my students to create mini-posters that summarize how to graph various trig functions by hand. Some of my kids did a much better job at this than others, but I think they all learned from this process. Instead of giving them each an equation to graph, I had them make their own equation. (However – they can’t use the equations from their notes or their neighbor’s equations!) Because my kids are smart/lazy/, they started thinking about what a,b,c,d values would make their functions easy to graph. A lot of them realized that if they changed the b value on their sine or cosine graph to pi, they could mark their x axis in terms of integers instead of in terms of pi. And, the best thing would be when my kids accidentally made mistakes with their graphing. Normally, mistakes wouldn’t make me that happy. But, so many of my students would figure out how to change their equation to account for the “mistake” instead of re-graphing the entire function. Then, it wasn’t a mistake anymore. 🙂
I snapped some pictures of the posters made by my students. Some of these have errors. So, please don’t take them for gospel!
Notes to myself for next time I teach trig:
* Take better notes over how to identify/label the period/amplitude of a graph
* Have students do everything but the final graph in pencil. Graph the final graph (after translations) in color.
* Give the mini-poster project as an assignment BEFORE the quiz instead of after it. Lots of awesome learning happened in the process. 🙂




SUPER-LIKE!!!
– Elizabeth (@cheesemonkeysf)
Thanks Elizabeth!
Hi Sarah,
This is such a great project since it gives students multiple ways to choose how to present their mastery. I especially like that you challenged students to use equations other than those that were in their notes.
Did you have students present their posters? When I do a similar activity in my classroom, I want to ensure students have the opportunity to share in multiple formats: written, graphically, and orally. I'm excited to see how students decide to accomplish this.
Thanks,
Pamela
I haven't had students present their posters, but this is a GREAT idea!
I'm a math teacher and I've been feeling burnt out recently, but you have inspired me! Thank you for your efforts to make math class a place where creative minds can thrive.
-Mike
Thanks for the comment, Mike. I just took a look at your blog, and your work in South Africa is so inspiring. Hope you're able to beat these feelings of being burnt out. You've inspired so many students already!
I co-taught math 4 (senior level math in georgia) this past year and the last unit was trig. I hated trig in high school and in college. However, my co-teacher assigned our students this cool project that models the minuets of daylight a city (any where in the world) gets using a sine or cosine function. Our students had to take 2 years (by month) of average minutes of daylight for 3 cities, one had to be Atlanta because that is where they all live and they got to choose the other 2. Then they had to graph the daylight minuets on a graph (or on desmos) and use the graph to come up with their shifted trig function. I thought it was a super neat project, but this was well after senioritis had kicked in and not many of the kids thought it was as cool as I did.
What a cool idea!!!