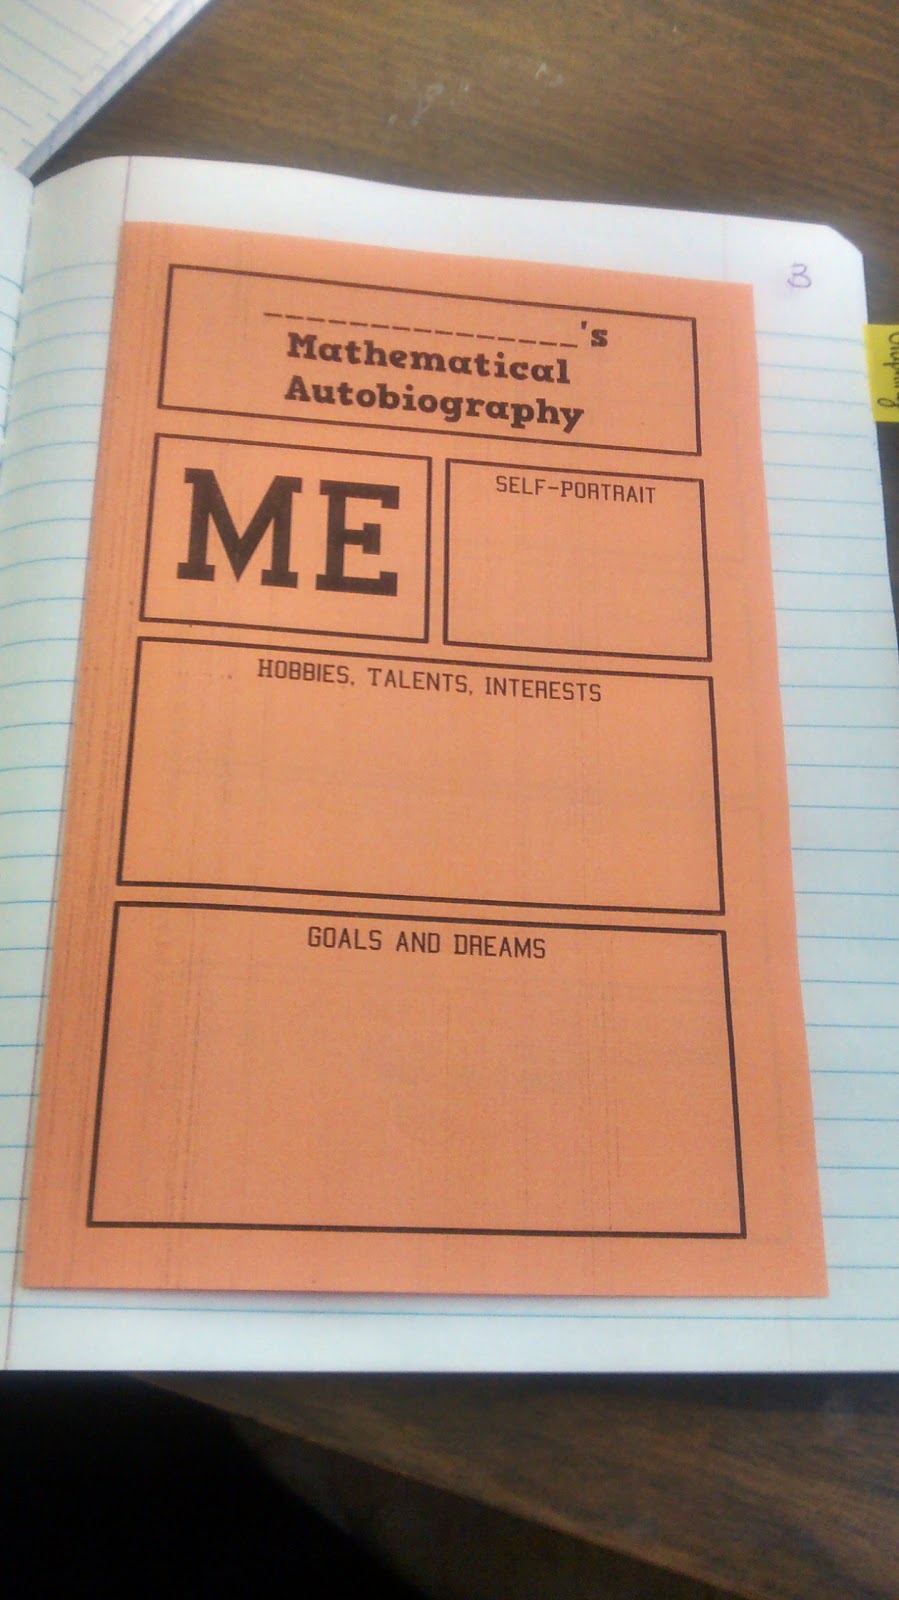
Describing Absolute Value Relations Foldable
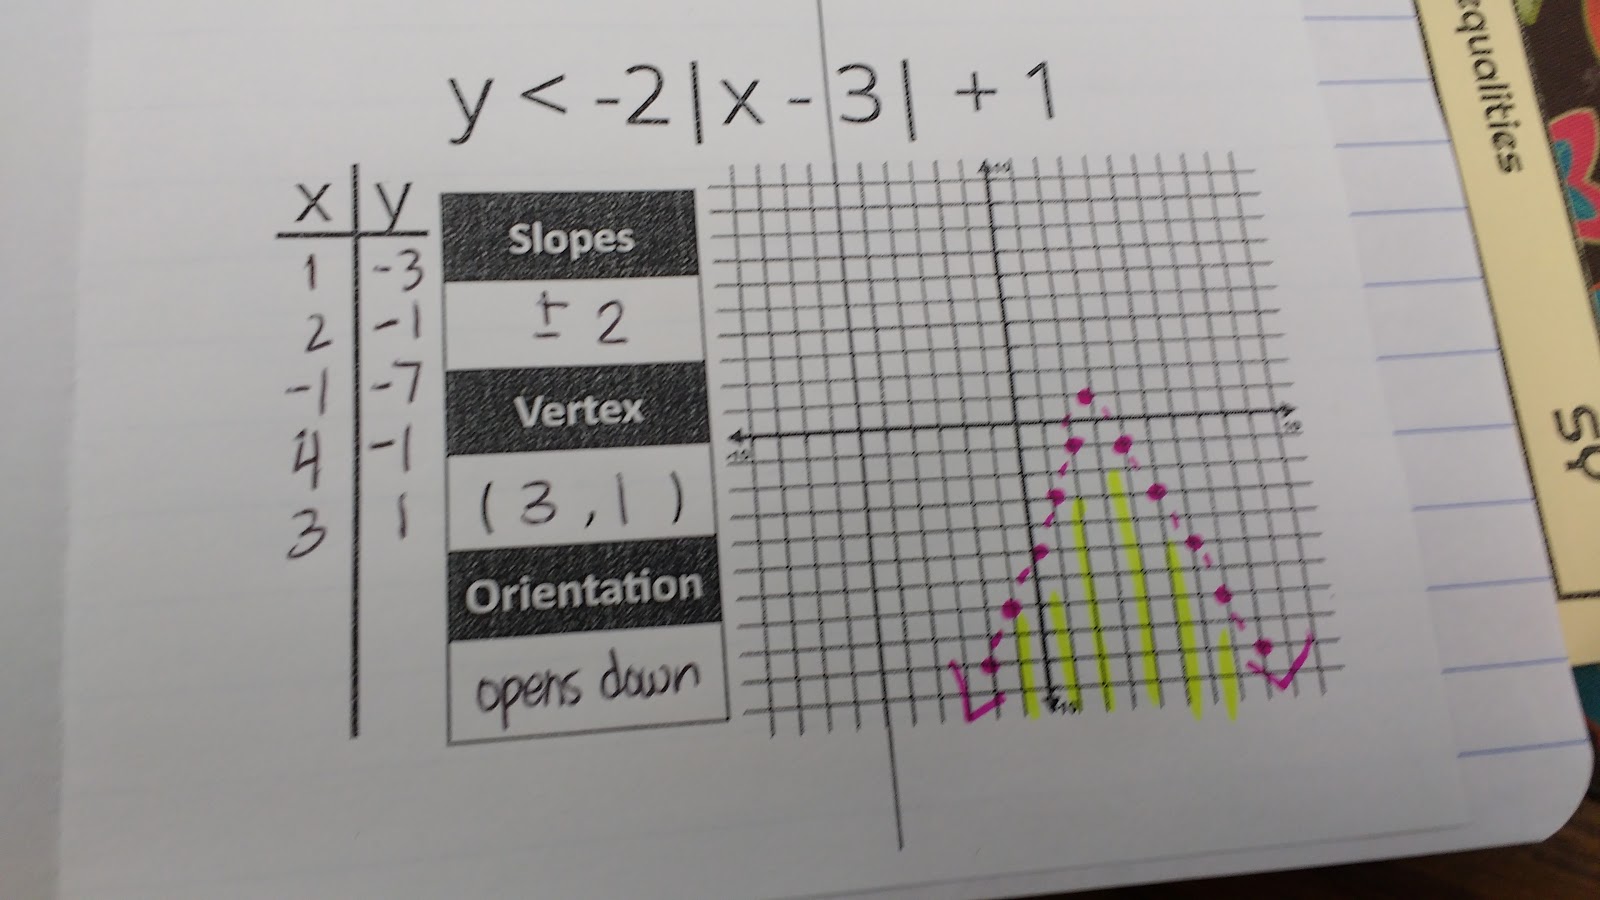
I created this describing absolute value relations foldable to introduce students to the graphs of absolute value equations and inequalities. My Algebra 1 students glued the resulting foldable in their interactive notebooks.
My first goal of my absolute value unit was to get students to graph absolute value functions by making an input/output table and make connections between the numbers in the equation/inequality and the slopes, vertex, and orientation.
My students had already graphed absolute value functions earlier in the unit in our relations and functions unit. So, the graphing part wasn’t new. The looking for patterns for vertex, slopes, and orientation was definitely new.
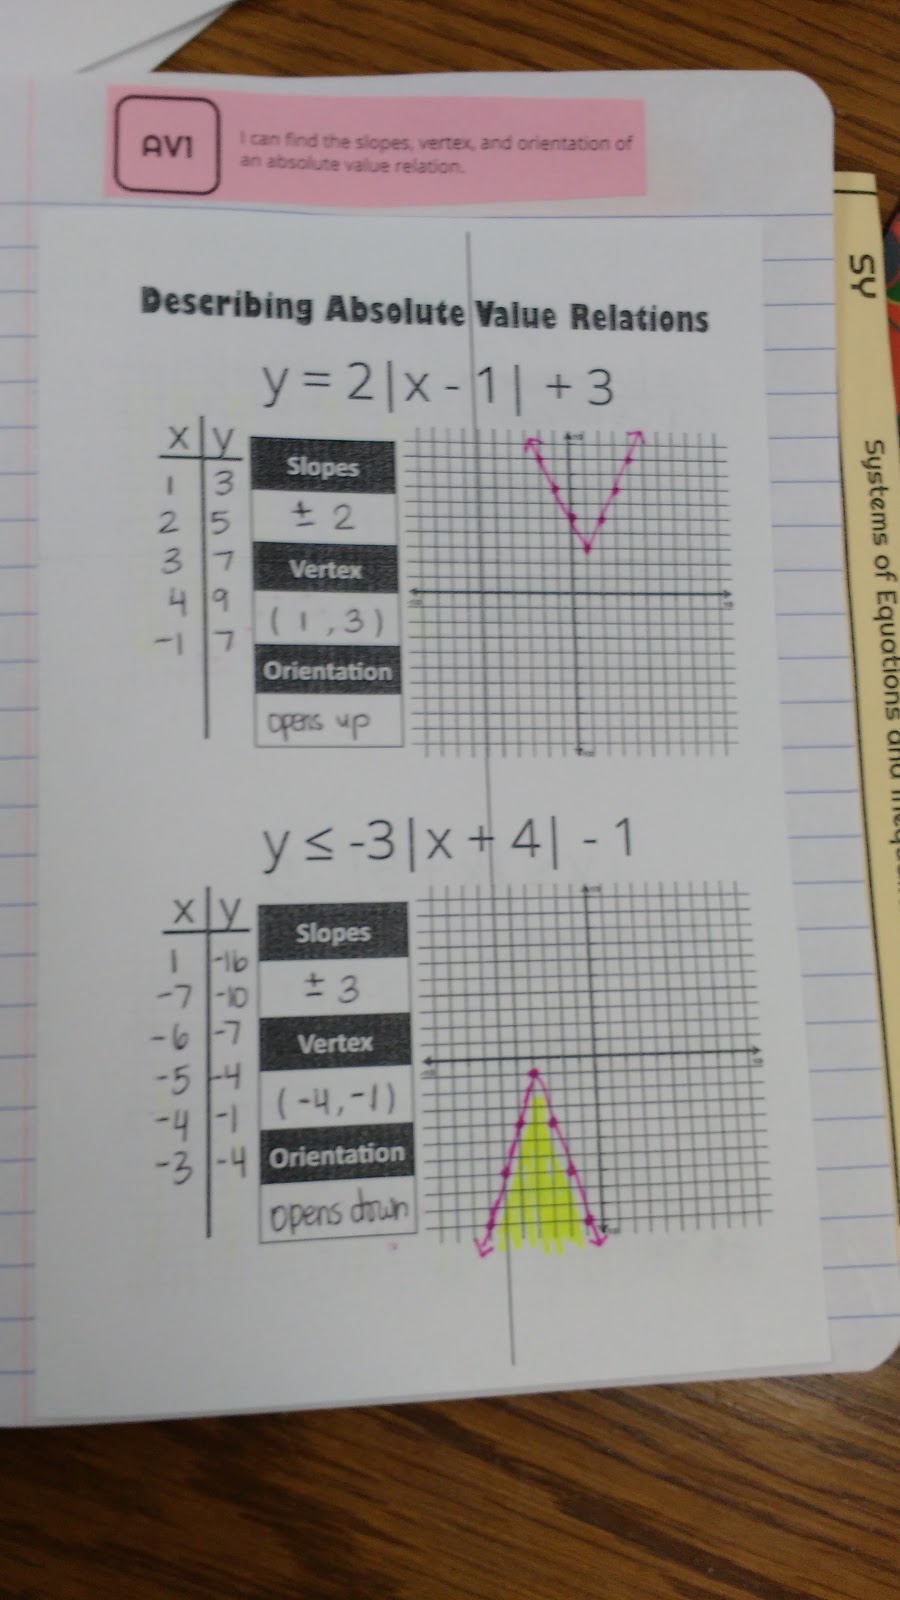
Students took turns picking x-values for us to plug into the equation/inequality. We had already learned that absolute value graphs are always “v-shaped,” so students knew that we had to keep plugging in values until our graph made a “v.”
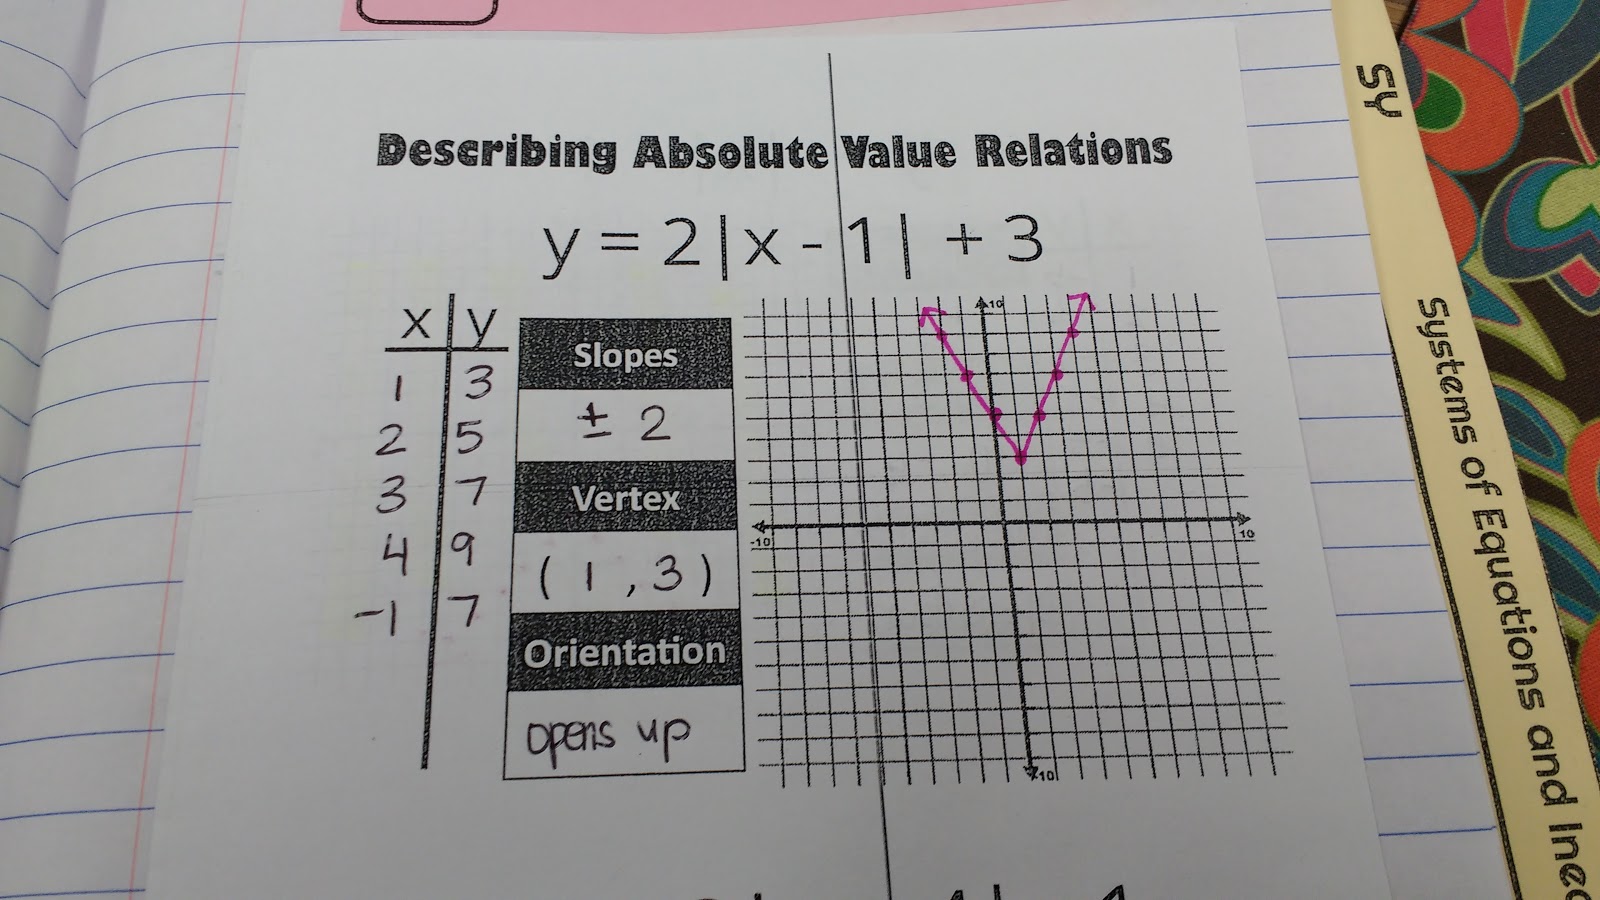
When I was teaching this lesson during the first period of the day, I kept finding myself frustrated that my students didn’t seem to be looking for patterns between the slopes, vertex, and orientation. Instead, they seemed plenty happy with just plugging in value after value to make every single graph.
I teach three periods of Algebra 1 each day. 1st period, 5th period, and 6th period. This meant I had plenty of time to think about how to salvage this lesson that did not go as planned during 1st period.
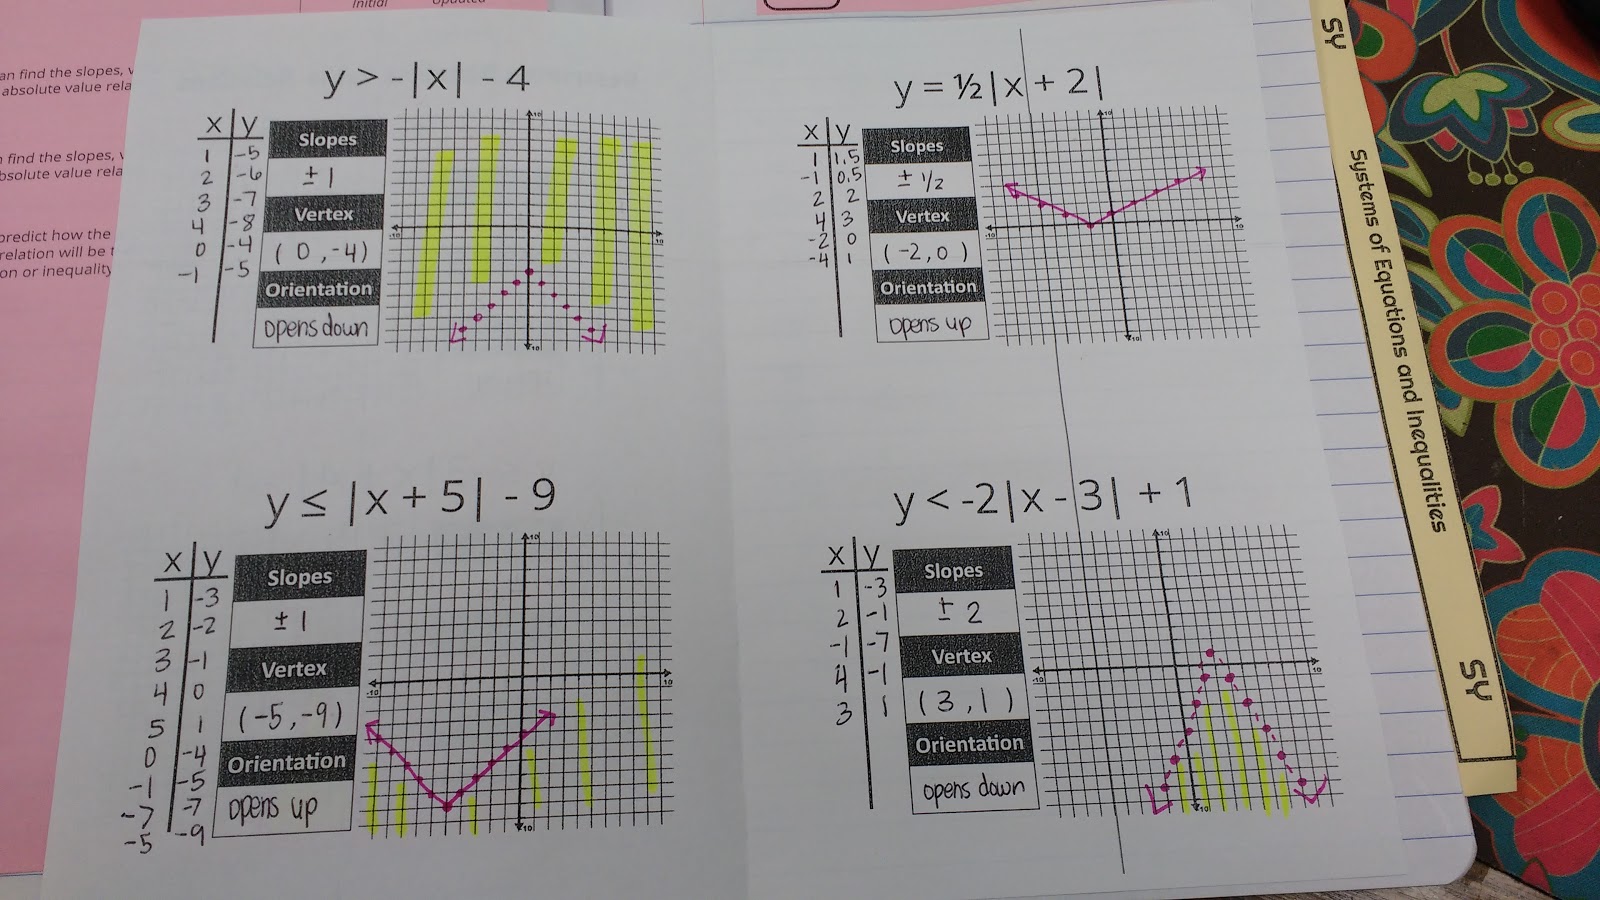
When 5th period rolled around, we did the first problem the same way we had done it first period. Students gave us x-values. We plugged each value in and graphed the resulting ordered pair. Repeat until the graph made a “v.” After we had found the slopes, vertex, and orientation, I told my students that my goal for this lesson was that they would be able to figure out the slopes, vertex, and orientation without doing ANY graphing by the time the bell rang.
Of course, they told me this was impossible. There’s no way that you can tell those things without making a graph. Next, I made a slight change that did get my students looking for patterns. It was such a simple idea, but it worked like a charm!
Before I let students give me x-values to plug into the next problem, I asked students to make predictions about what the slopes, vertex, and orientation were going to be. I wrote these guesses on the board, but I warned my students to NOT write them down until we had made the graph and verified them.
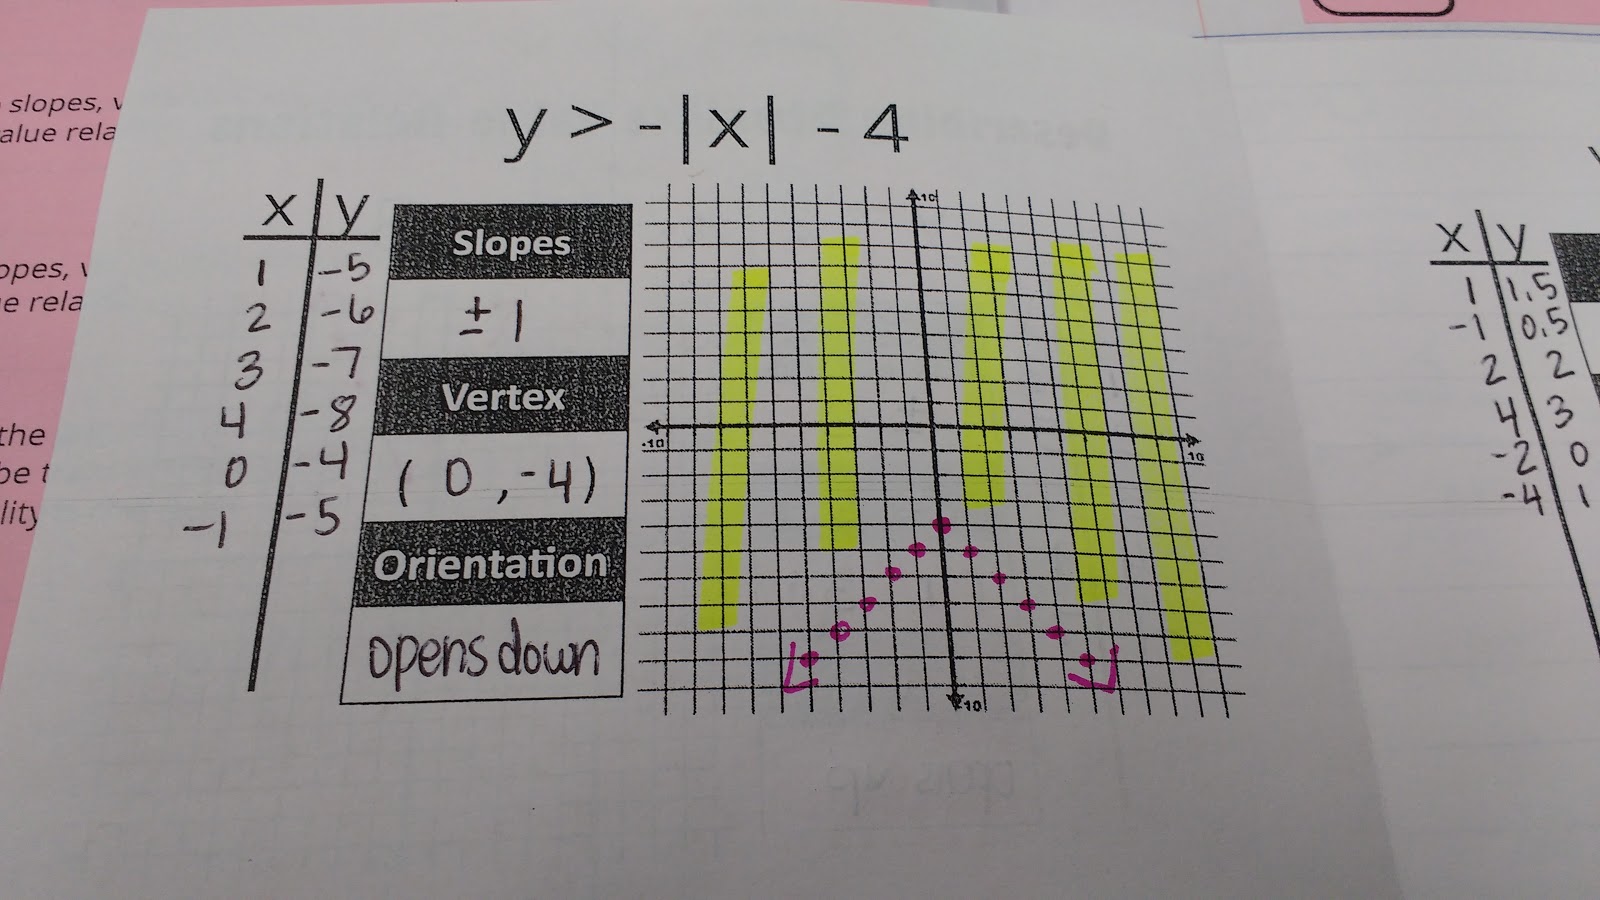
After my students made random, off the wall guesses, we plugged in values and made a graph. Then, we examined if our guesses were correct. All of a sudden, students were making much more informed guesses and sharing their theories with their classmates. Many of their theories were later disproven, but I felt like my students learned SO much from these false theories.
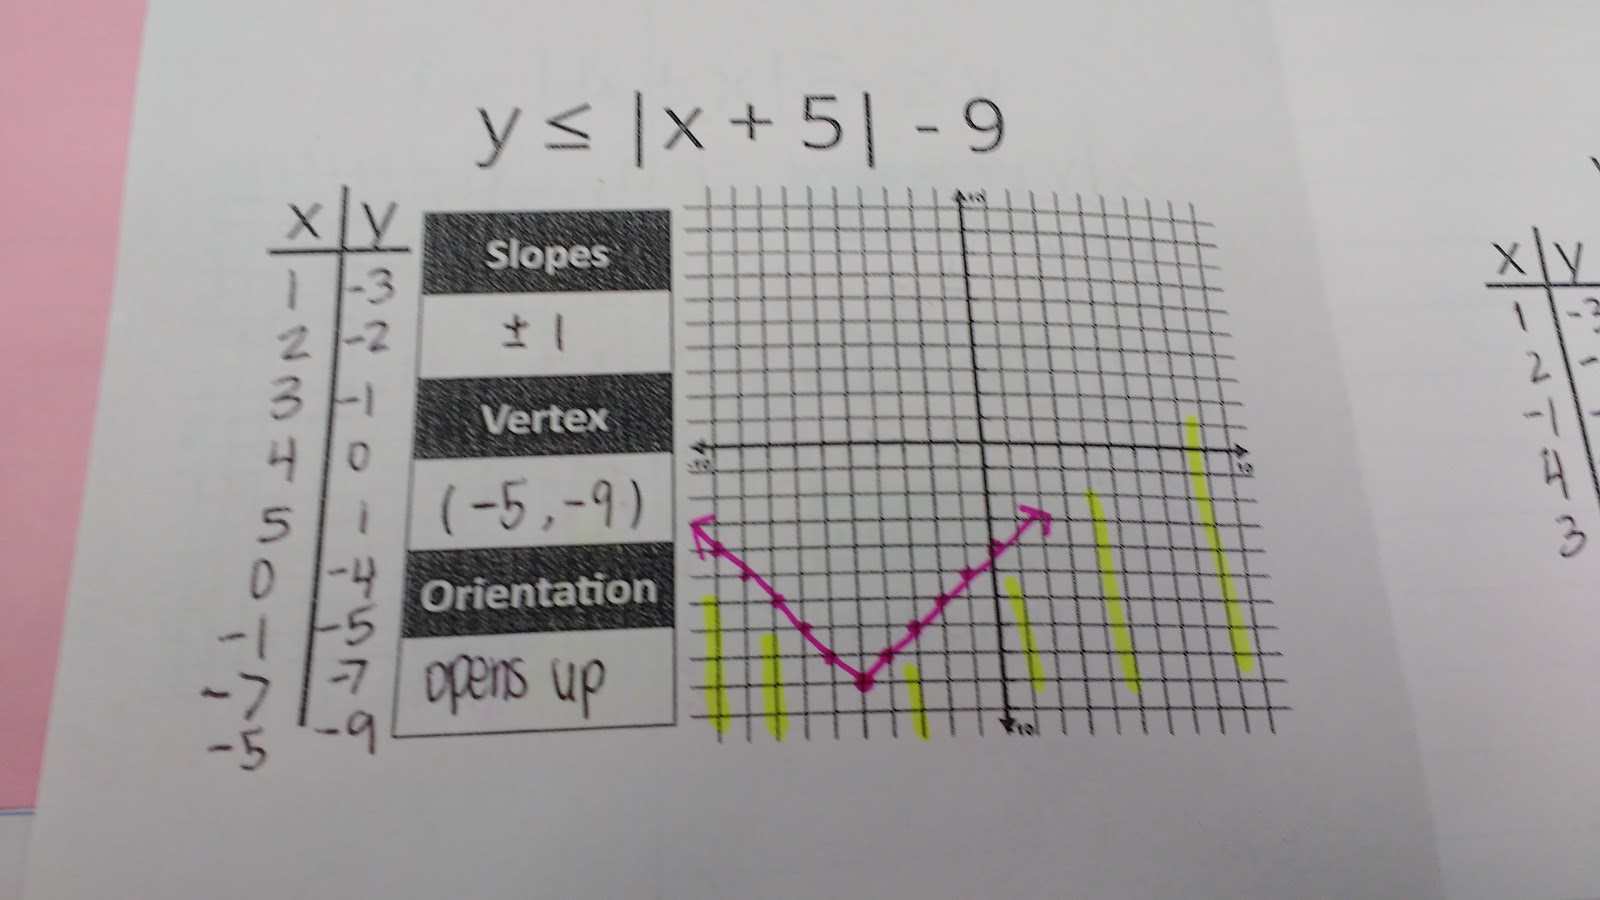
So, I guess I learned an important lesson. I shouldn’t just expect that my students will discover patterns on their own. I need to explicitly encourage them to look for patterns.
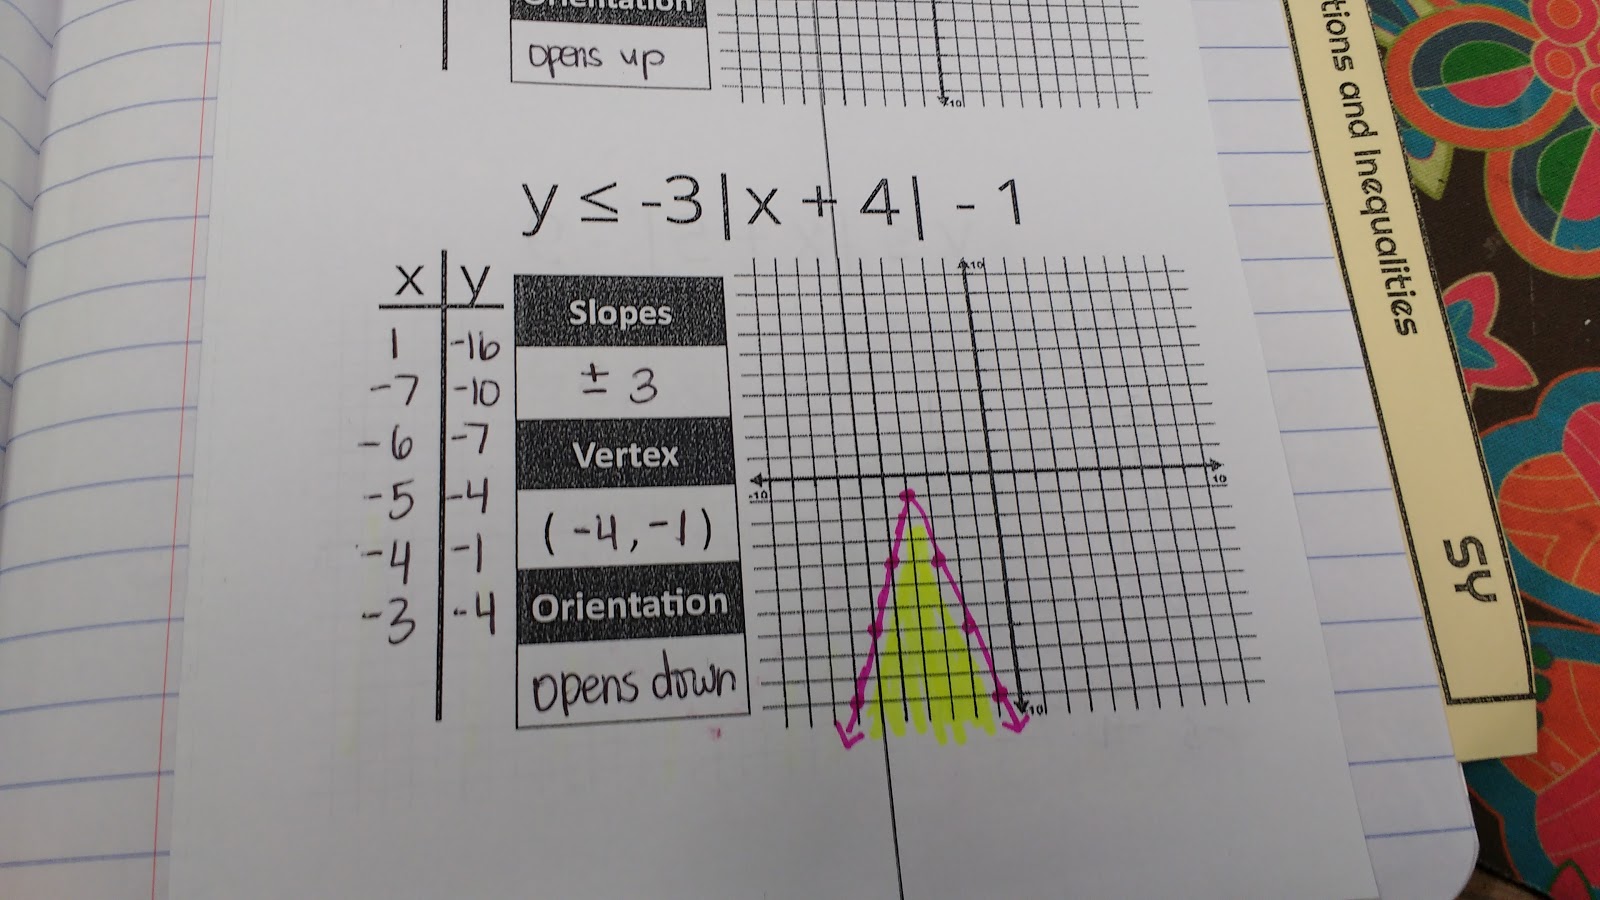
My students were able to figure out pretty quickly how to tell if the graph opened up or down. It also only took a few examples for them to figure out how to find the vertex of the graph. What they really, really, really struggled with was figuring out which way to shade on the inequality based solely on the equation.
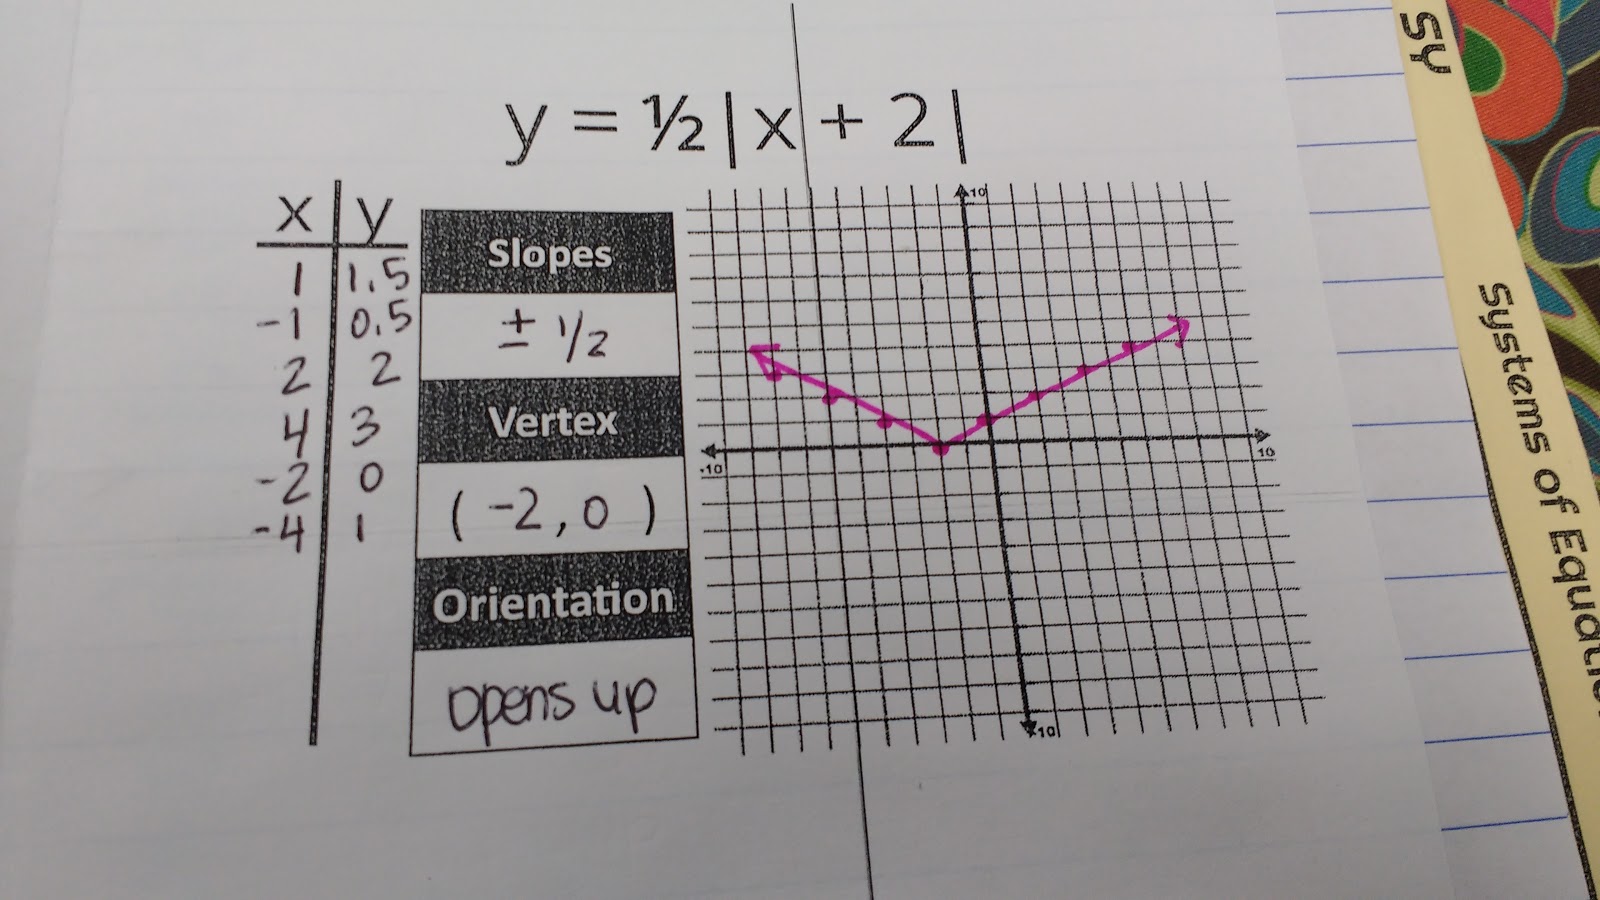
After spending a day working on our theories, we made an absolute value foldable to summarize our findings.
