Semi-log Plots Activities and Teaching Resources
Make learning semi-log plots fun with these free printable activities and teaching resources for this sometimes tricky topic!
What is a Semi-Log Plot?
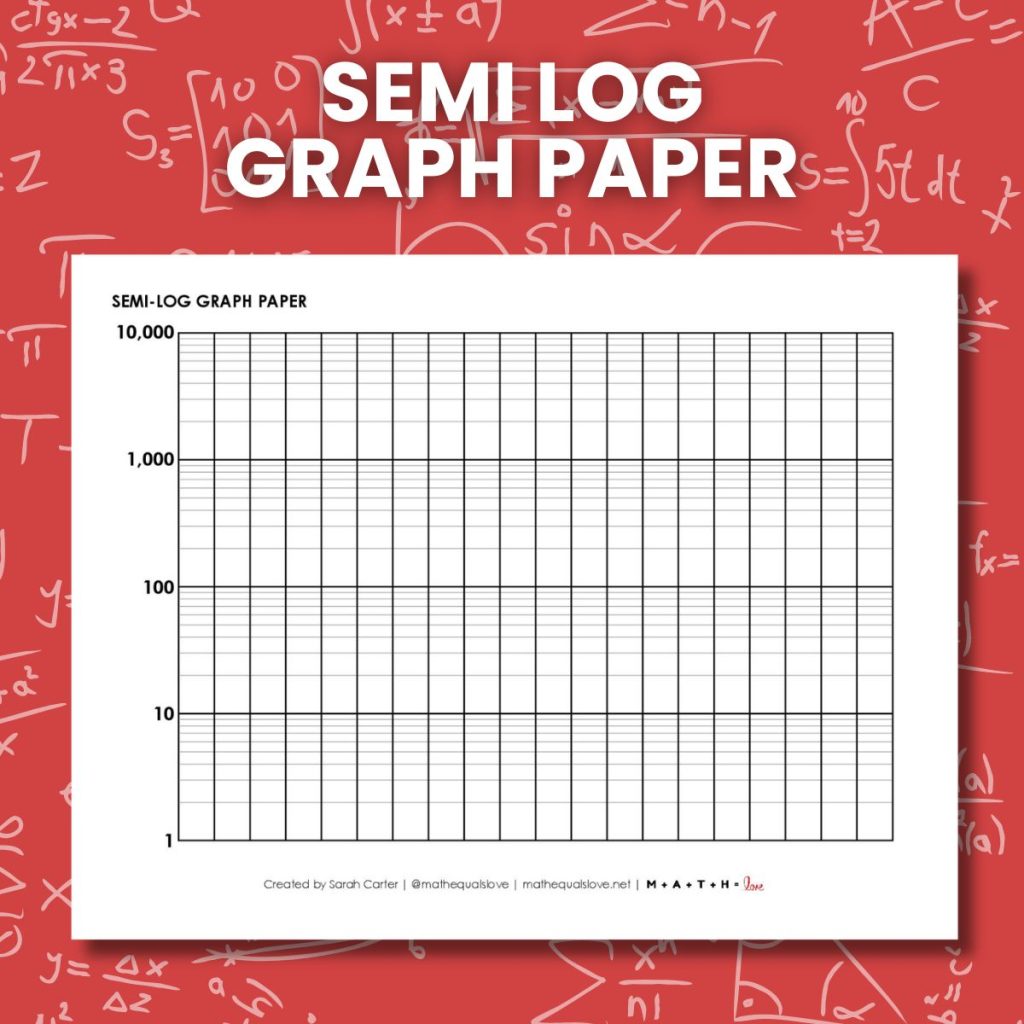
A semi-log plot is a graph where one axis uses a regular linear scale and the other uses a logarithmic scale, making it useful for visualizing data that spans several orders of magnitude or grows/decays exponentially.
Semi-log plots are commonly used in fields like biology, finance, and physics to reveal patterns — such as exponential growth — that would appear as straight lines rather than curves on a semi-log plot.
Semi-log plots are included in the AP Precalculus curriculum.
Semi-Log Plot Activities and Resources
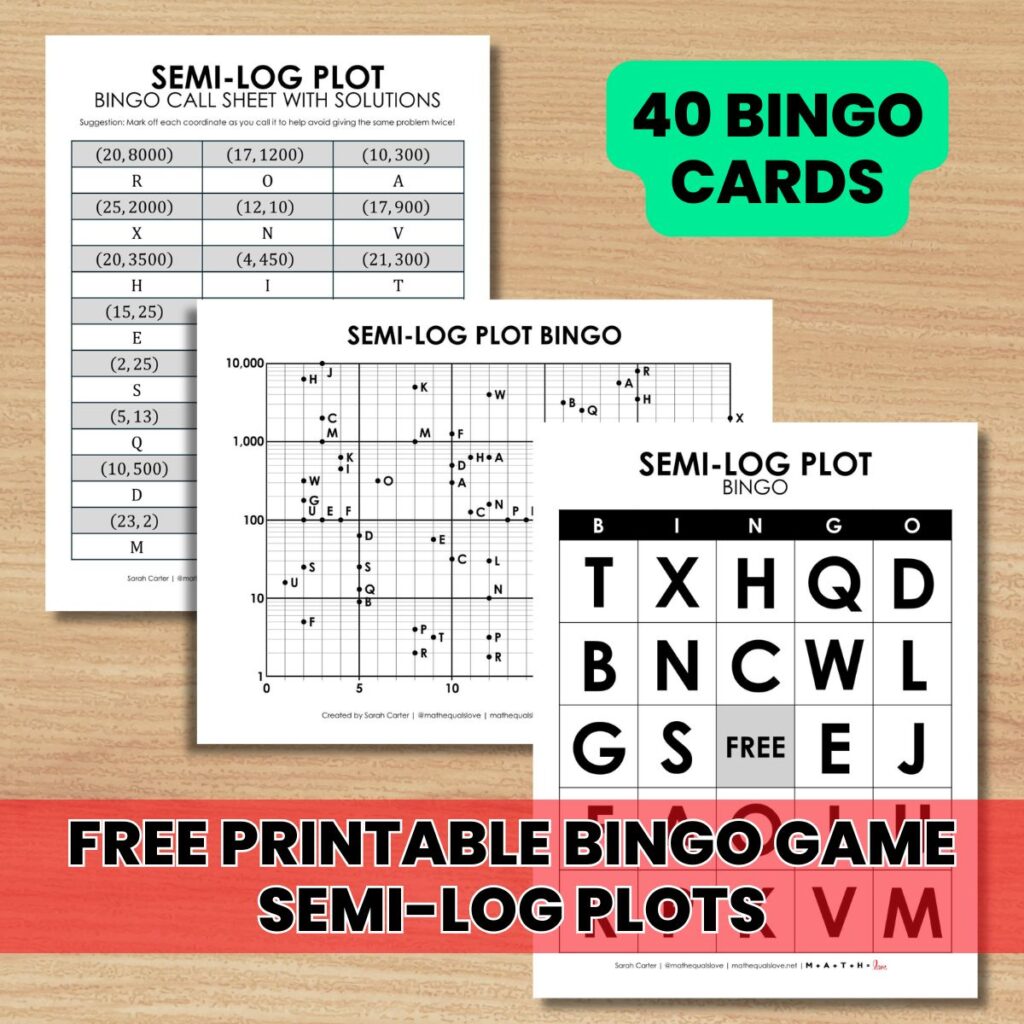
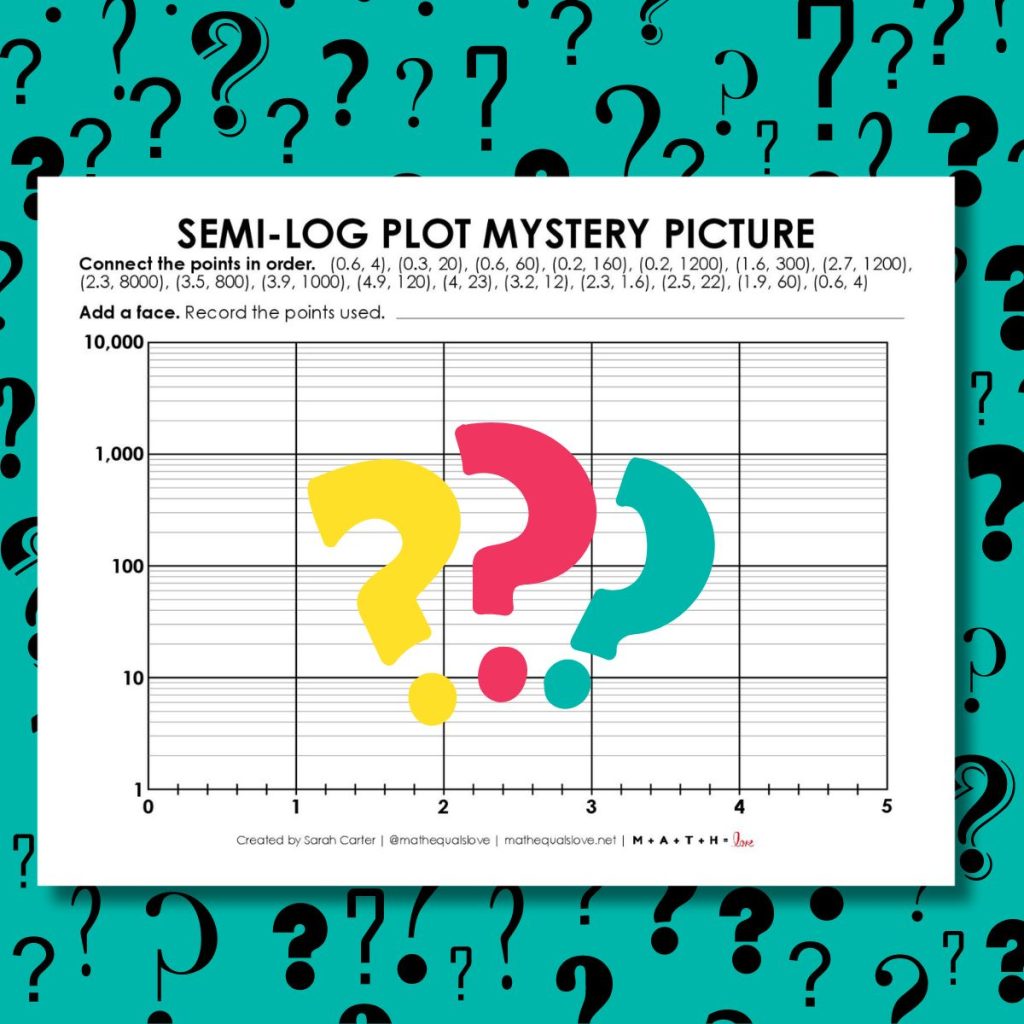
When I first started teaching AP Precalculus, I had no idea what a semi-log plot even was! Over the past few years, I have developed several resources for teaching this topic to my AP Precalculus students. I’m excited to share them with you as well!
Activity Solutions
Activity and worksheet solutions are available on a password-protected solution page. I do not openly post the answer keys because one of my goals as a resource creator is to craft learning experiences for students that are non-google-able. I want teachers to be able to use these activities and resources in their classrooms without the solutions being found easily on the Internet.
Please email me at sarah@mathequalslove.net for the password to the answer key database featuring all of my printable puzzles and math worksheets. I frequently have students emailing me for the answer key, so please specify in your email what school you teach at and what subjects you teach. If you do not provide these details, I will not be able to send you the password.