Describing Characteristics of Graphs Foldable
This blog post contains Amazon affiliate links. As an Amazon Associate, I earn a small commission from qualifying purchases.
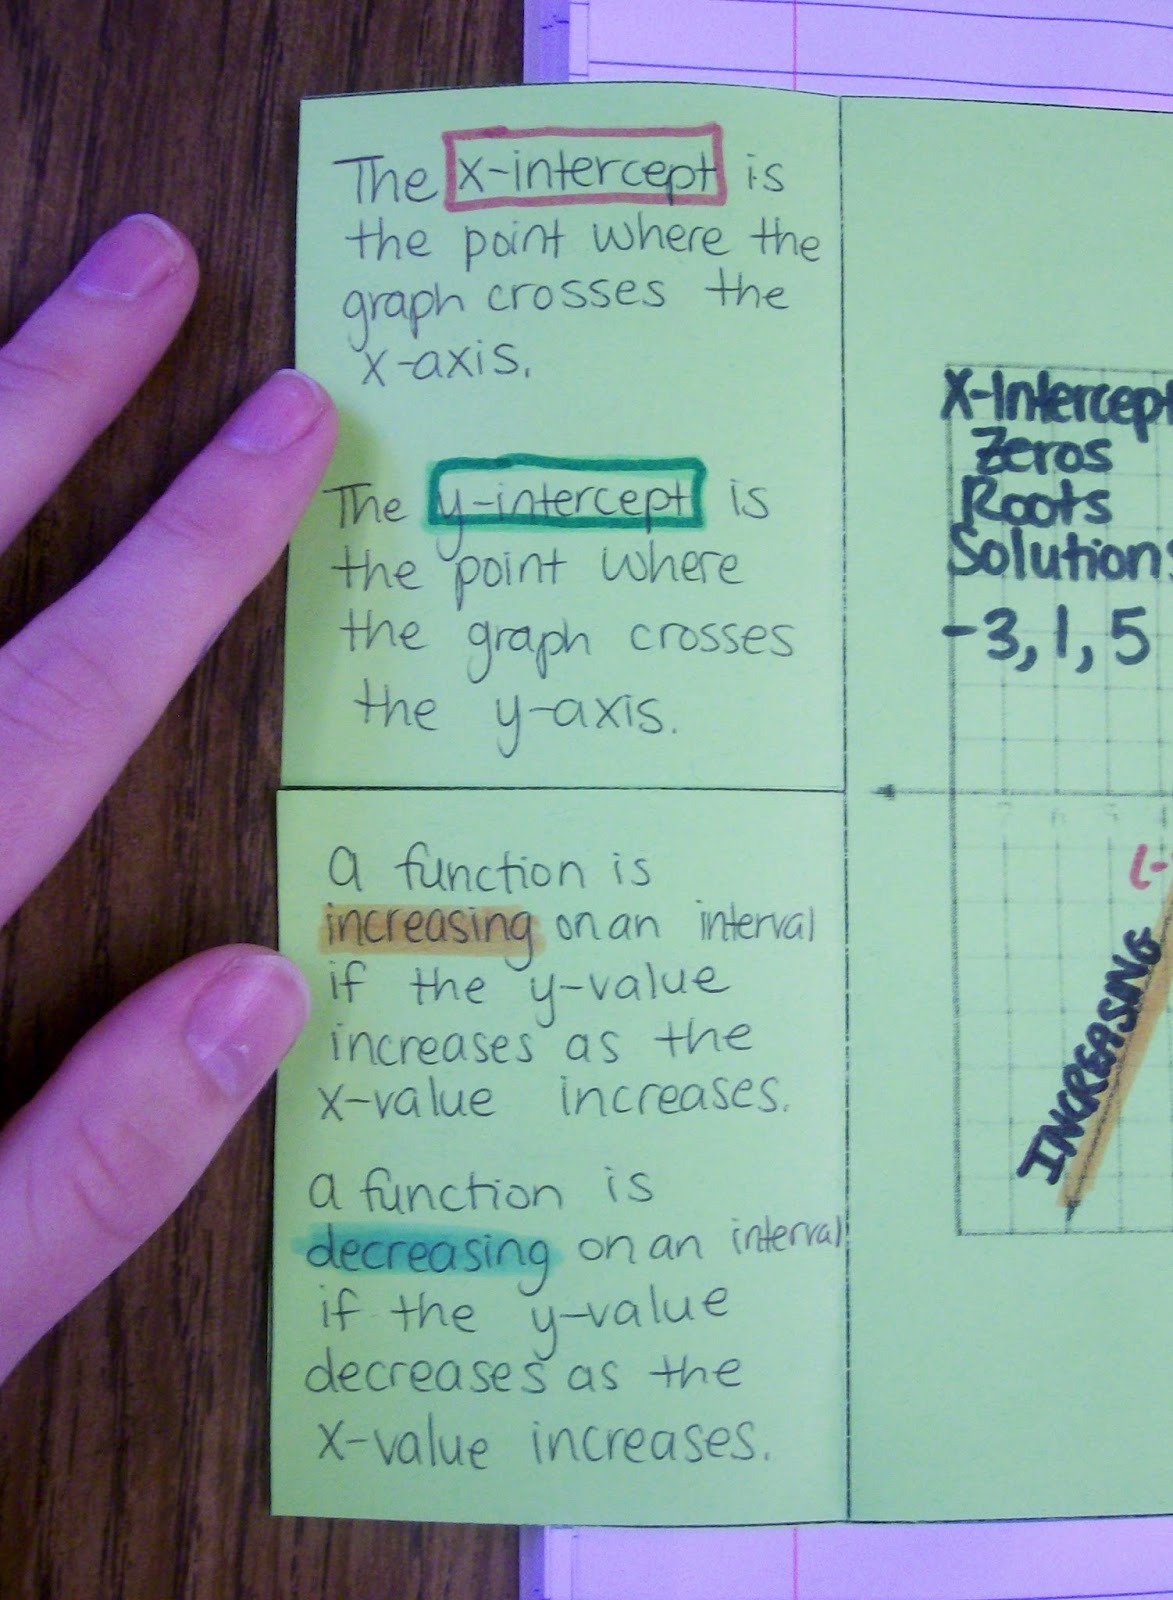
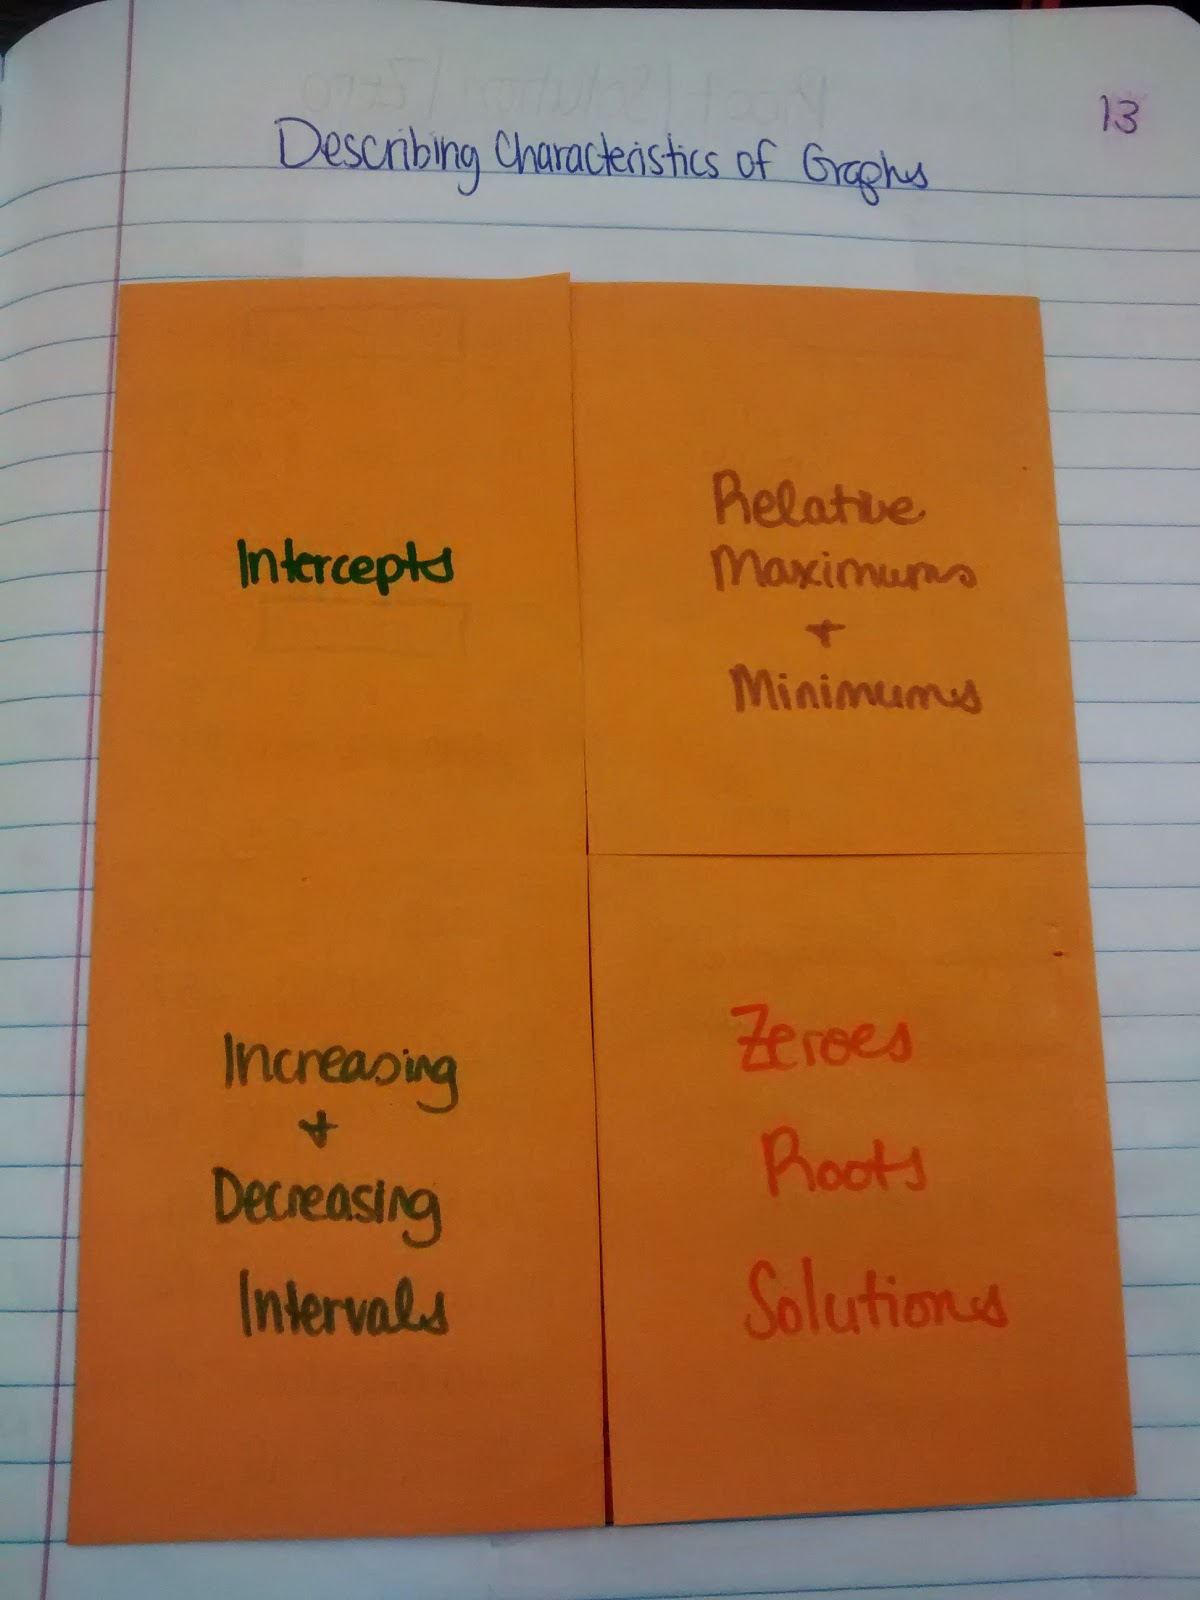
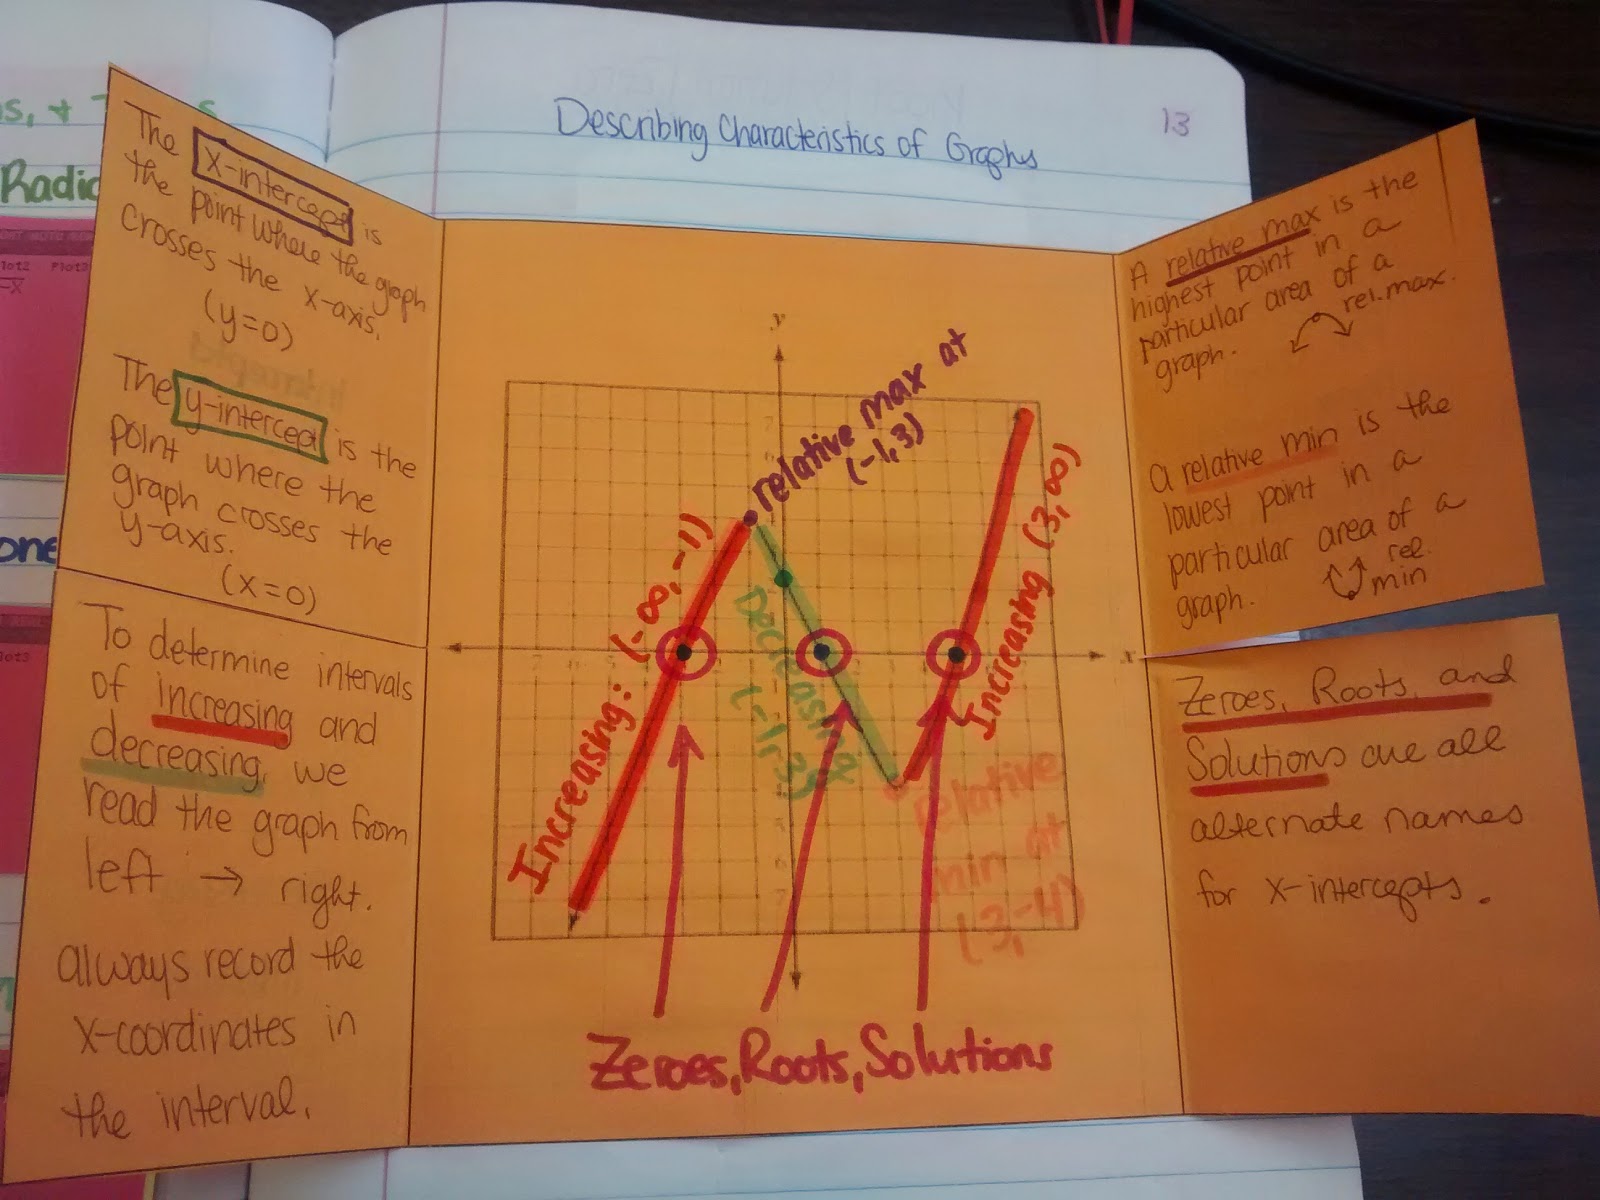
One of the main thing my students need to be able to do on their Algebra 2 EOI is to describe graphs. This describing characteristics of graphs foldable is an attempt to introduce my students to the concepts of x-intercepts, y-intercepts, relative maximums, relative minimums, increasing intervals, decreasing intervals, roots, solutions, and zeros.
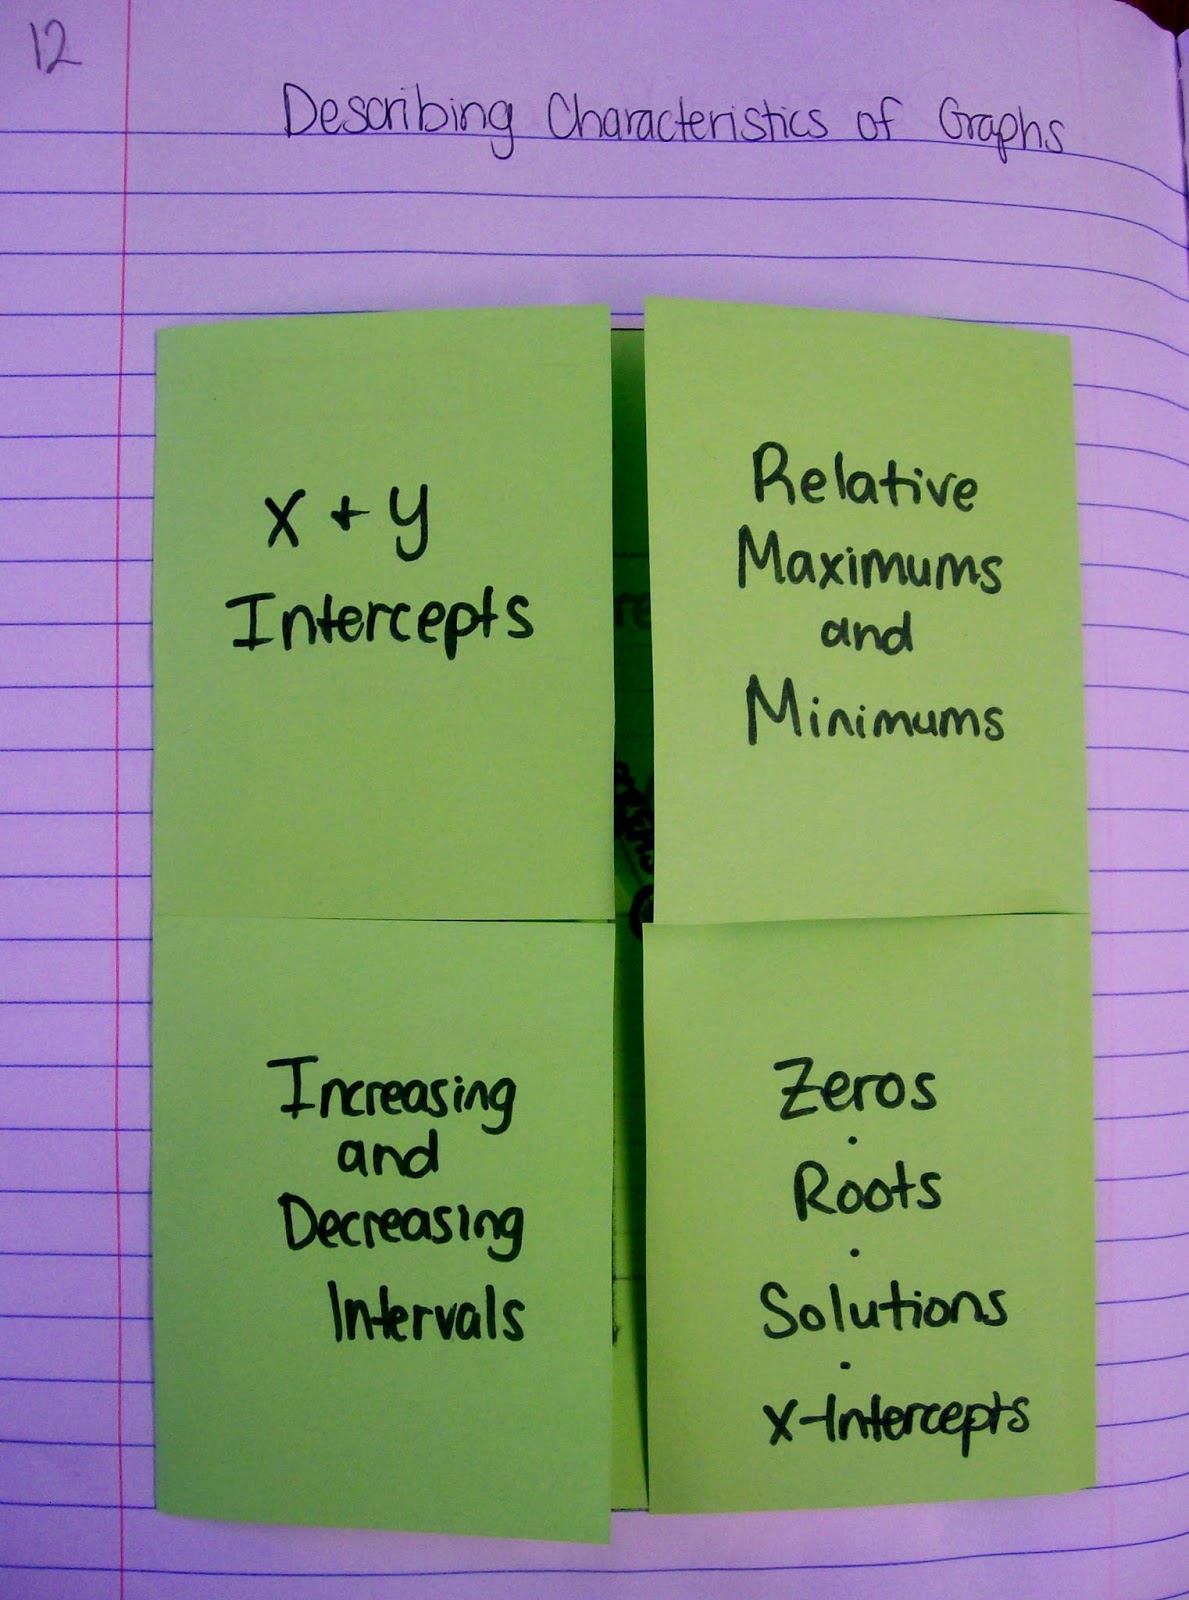
Because there is so much information on this one foldable, this was a perfect opportunity to use COLOR WITH A PURPOSE. Each term was marked with a different color. And the corresponding part of the graph was marked with the same color. This is one of my favorite foldables that we have done this year!
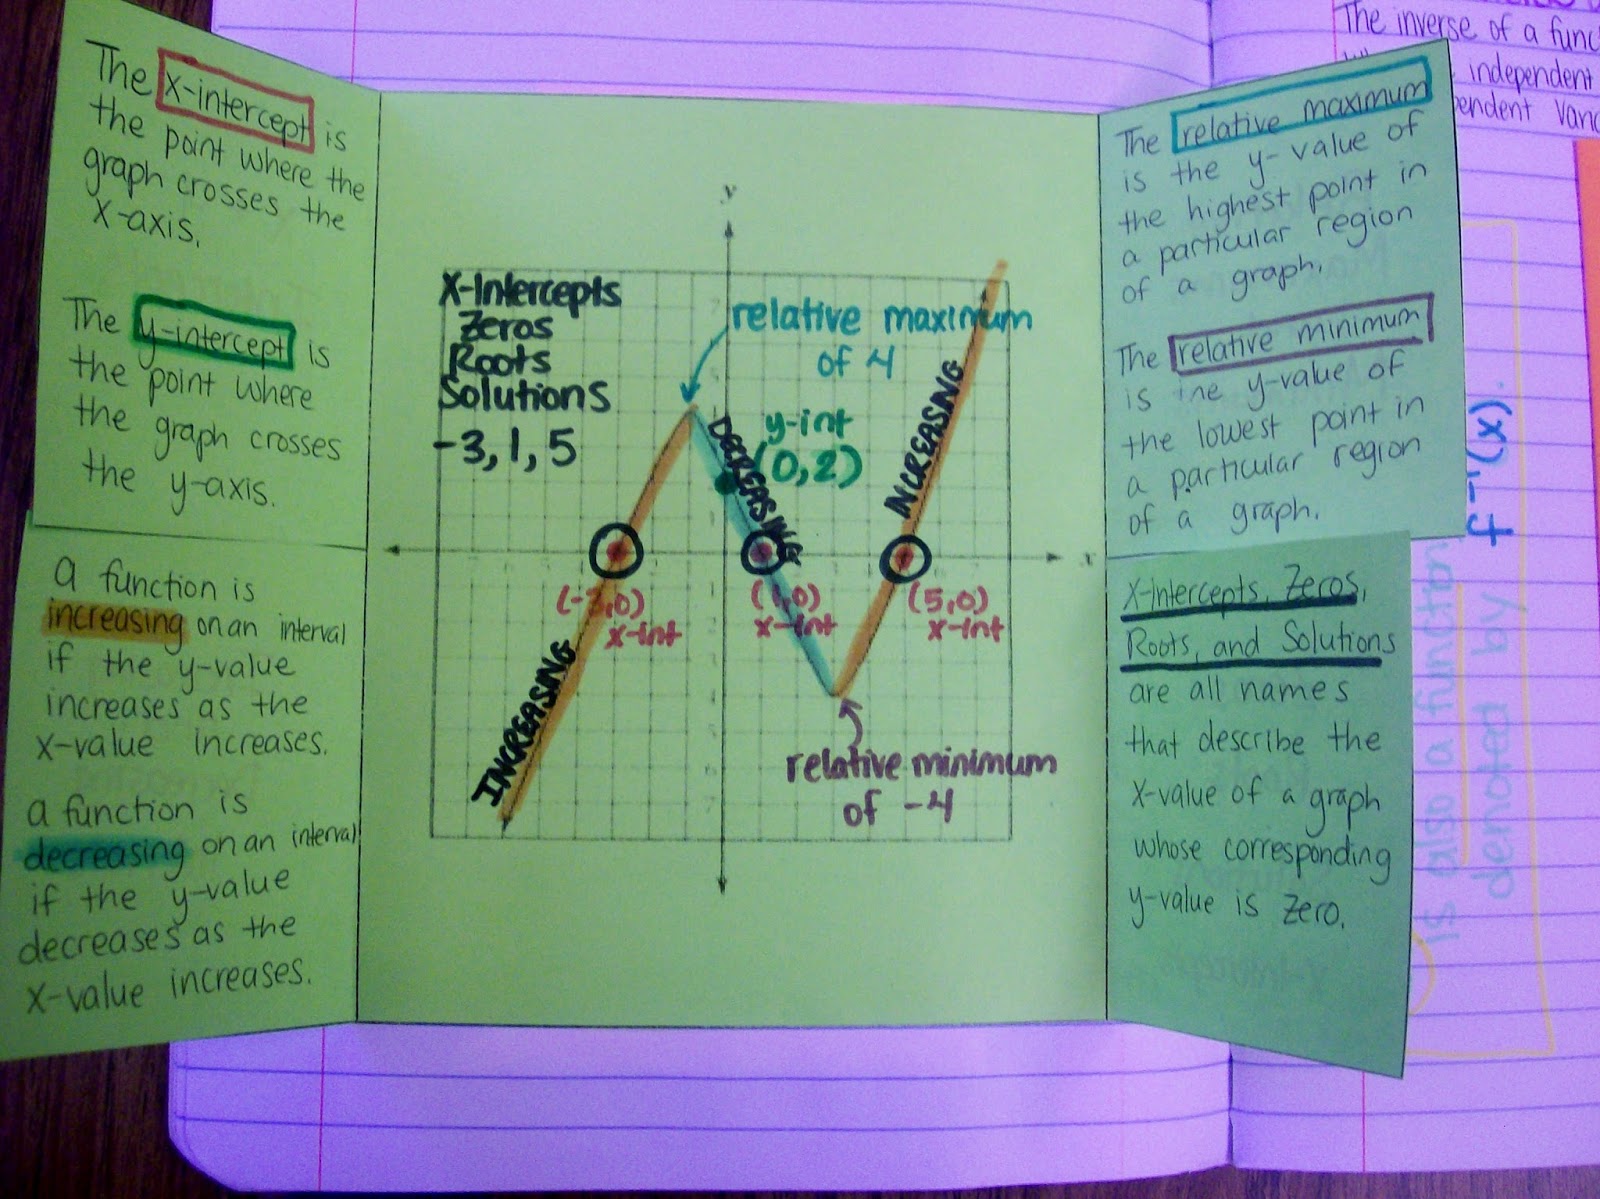
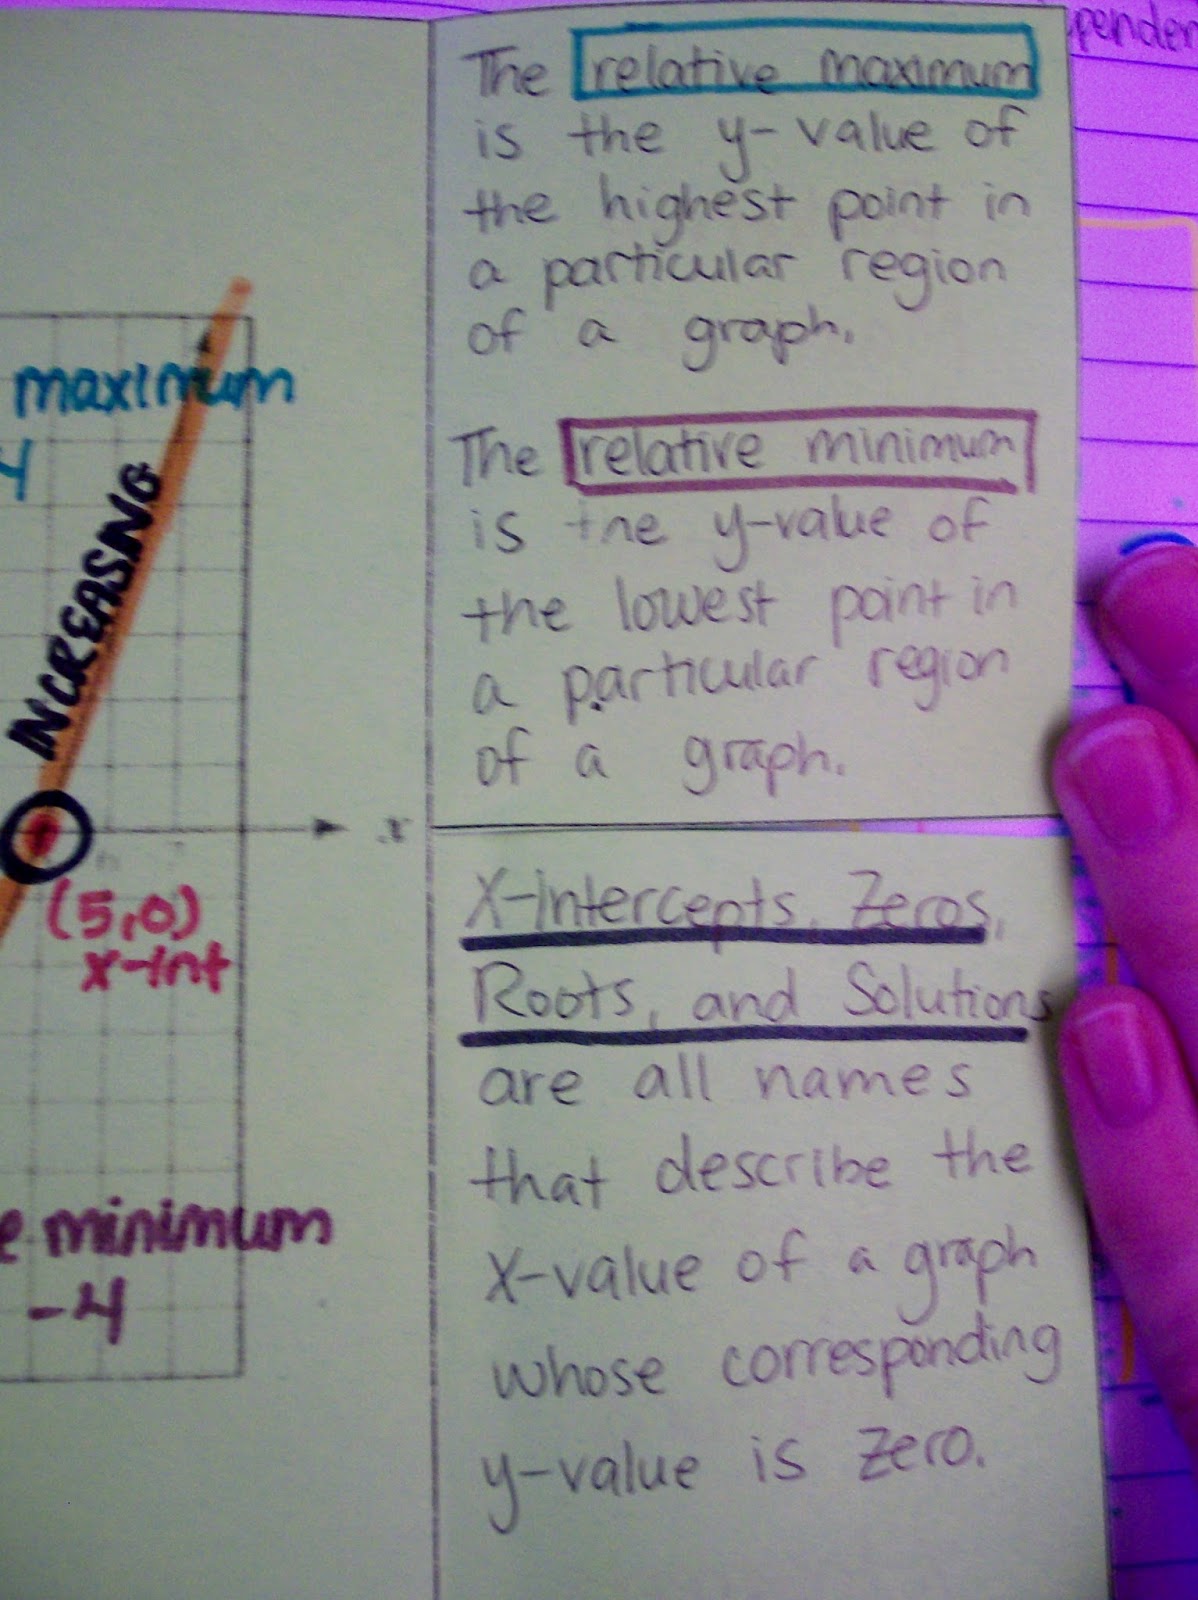
I’ve posted some close-ups of the flaps if you’d like to see what I had my students write.
Behind the Scenes Look at Foldables in the Making
I get a lot of comments and e-mails asking exactly how I model my notes for my students. I know some teachers write the notes on an actual foldable under the document camera, but I don’t have the most user friendly document camera. And, it’s a big pain to switch back and forth between the document camera and my SMART Board.
So, I make foldable templates in the SMART Notebook software to write on top of. This isn’t foolproof. I often have students take notes in the wrong place, but I think that’s a result of their not paying attention. Because usually 95% of the class will do it right…
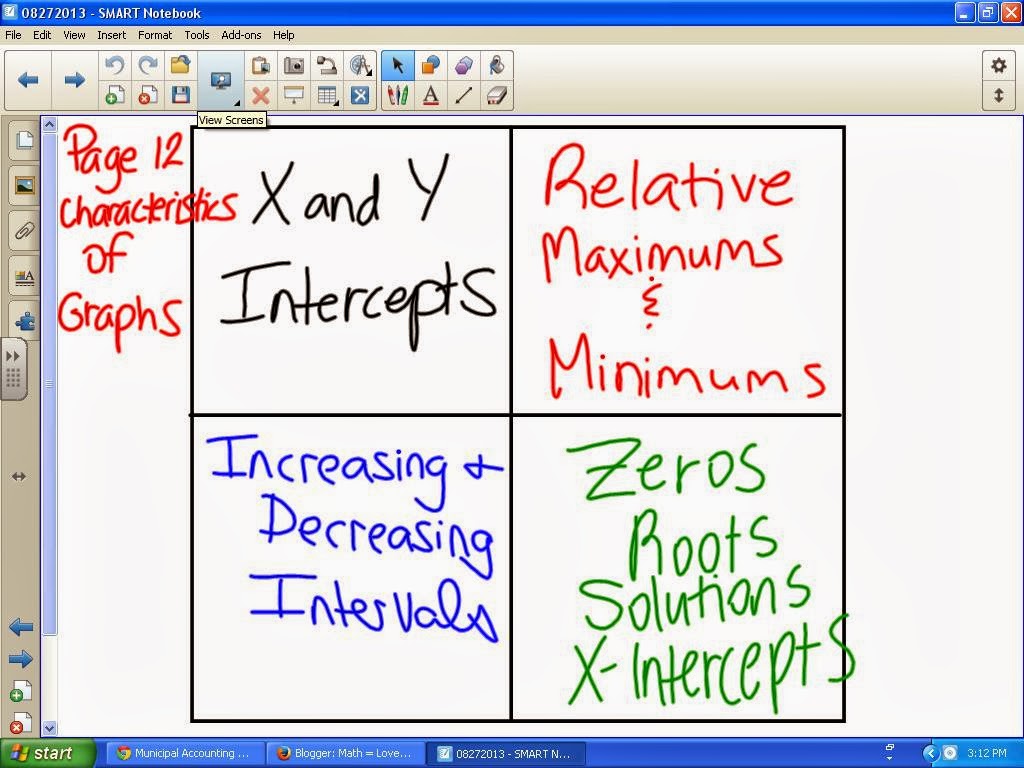
Here’s an example of what my SMART Board notes look like for this foldable.
I write everything every class period. This can get a bit old, but I find myself tweaking my wording throughout the day. I take what didn’t work first hour and try to make it better third and fifth hour. I teach 3 classes of Algebra 1 and 2 classes of Algebra 2, so I never have to write the same thing more than 3 times. There are some things that I type out in advance for my students. And, there are some days when I think some notes will take 3 minutes to write. When they take 10 minutes in reality, I usually end up typing them out for the rest of my classes and simply have them glue them in. Timing activities can be really tricky with interactive notebooks. I’ve found that giving my students a specific amount of time to do a task (via a timer) can be a big help!
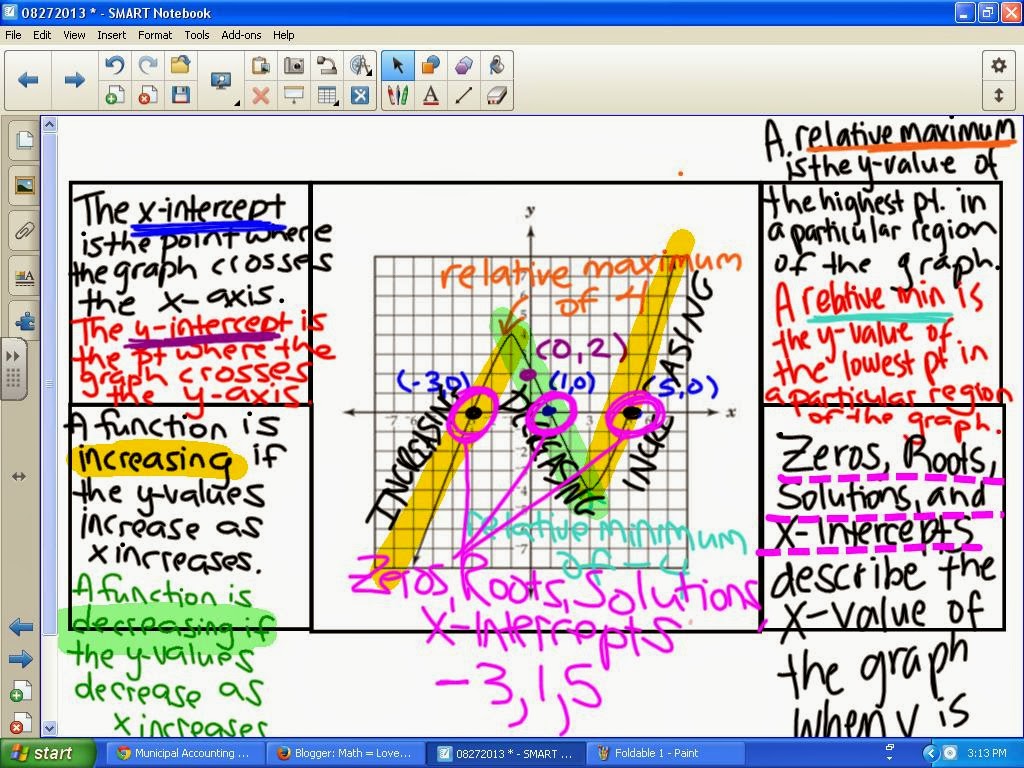
As you can see, I try to incorporate lots of color-coding. Doing this is pretty easy on the SMART Board. Plus, if a student was absent, I can always pull up the previous day’s notes on the SMART Board for them.
The notes look super messy once we get done, but my students don’t seem to have too much trouble following along with what’s new on the page. Though, they do take every opportunity they can get to criticize my SMART Board handwriting…
Files for Describing Characteristics of Graphs Foldable
Click here to SAVE the file to your device.
Describing Graphs Foldable (PDF)
1913 saves – 25.80 KB


