Dot Plot of the Day Activity
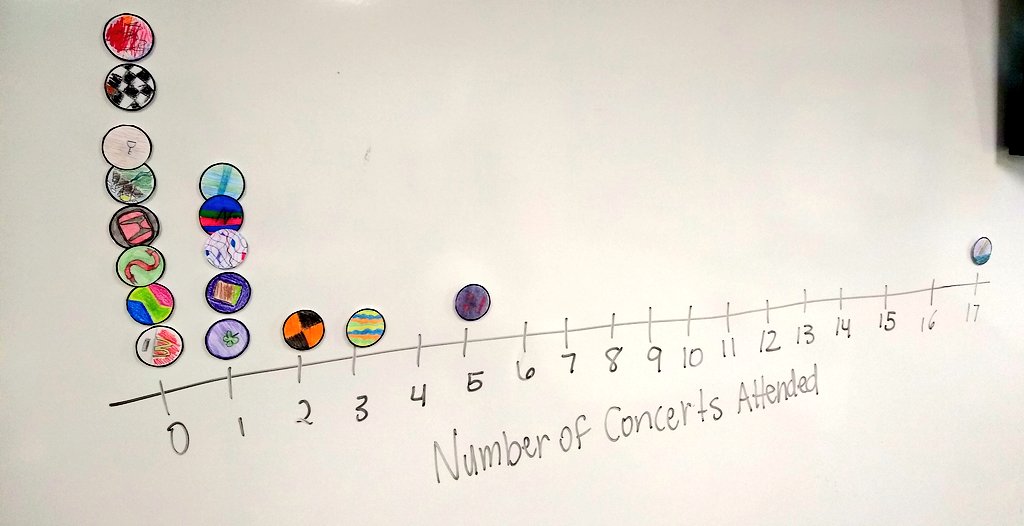
After creating our own individual magnets, my statistics class used them to complete this dot plot of the day activity. For an entire week, we created a dot plot at the beginning of each class period. Then students practiced writing a short paragraph to describe the data’s distribution.
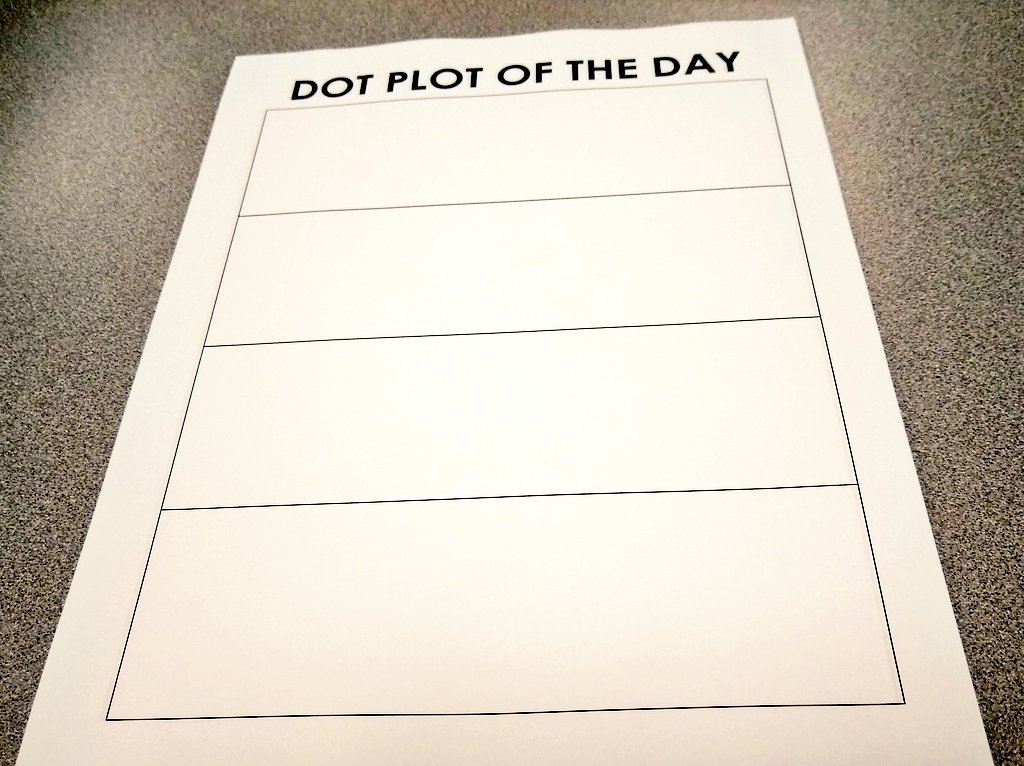
I only see my students four days a week since we have asynchronous distance learning days each Monday. So, the dot plot of the day template I used with my students only had space for four prompts. I also created a five day template in case you have a more normal school week.
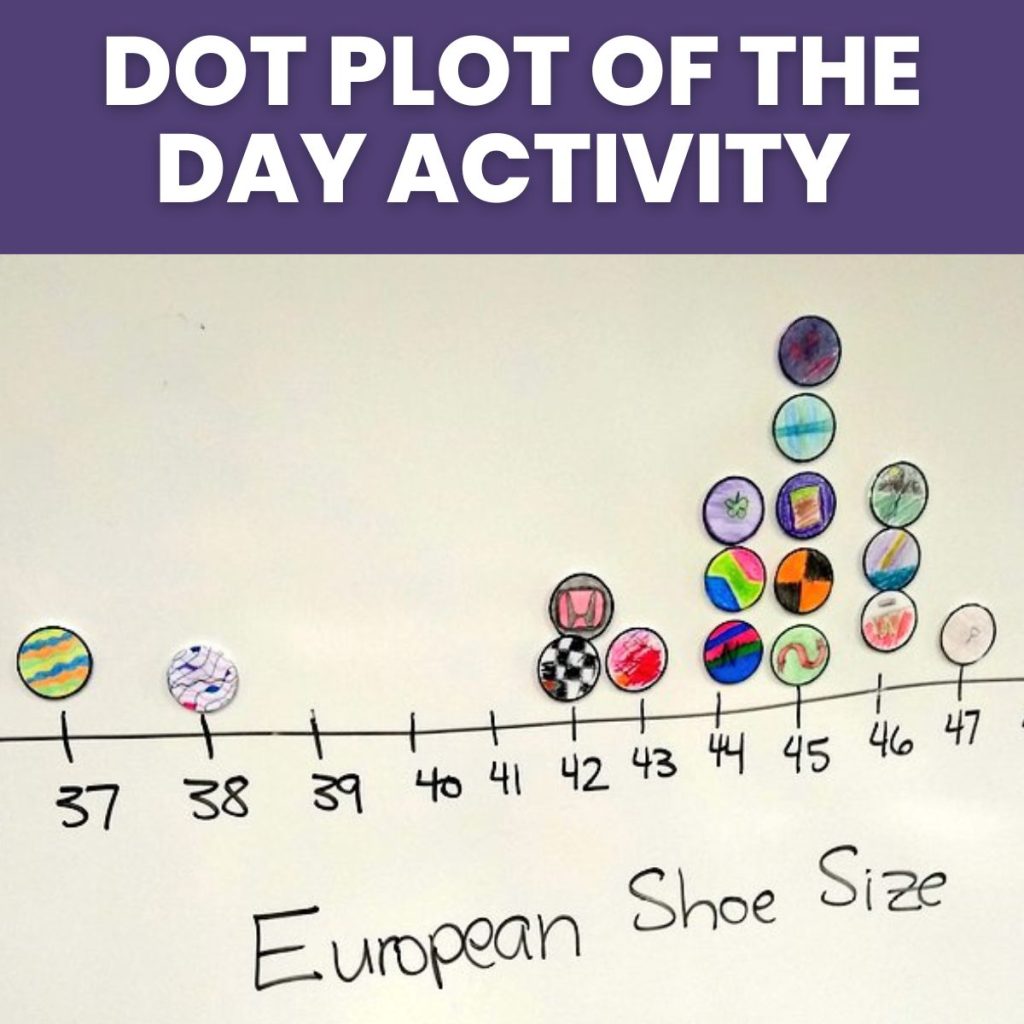
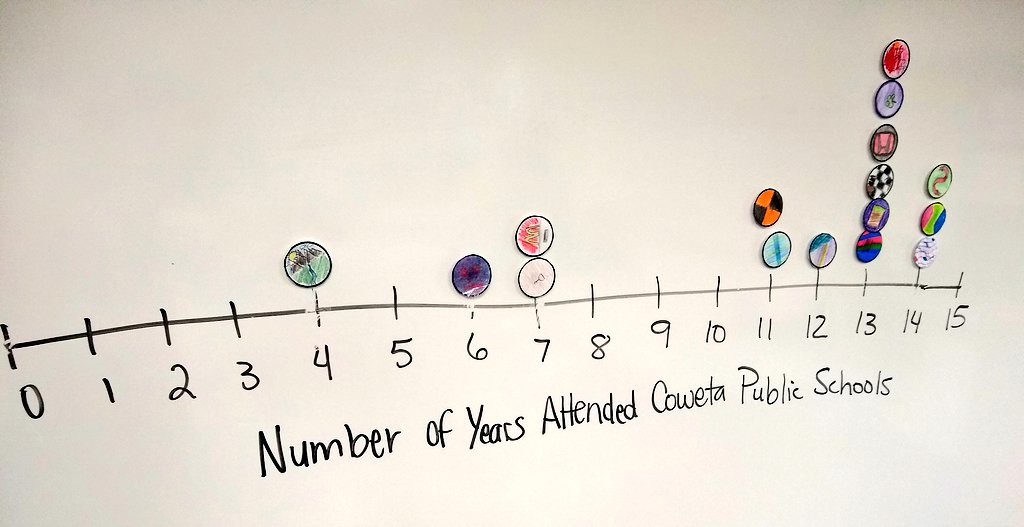
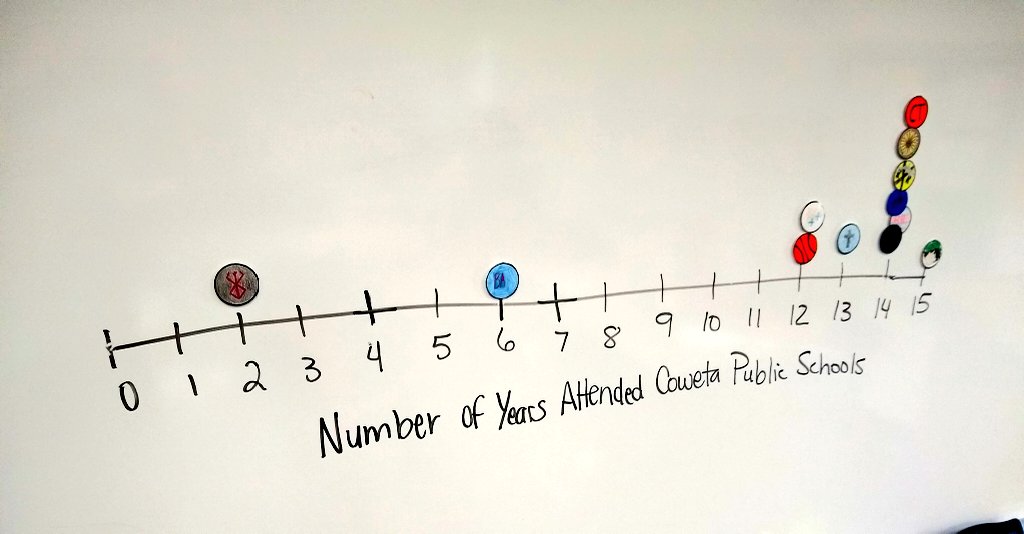
Here are some examples of the prompts I used with my students. We had a lot of fun with this activity in statistics.
How many years have you attended Coweta Public Schools?
This is a nice prompt if you are looking to create a skewed data set! Of course, you would need to insert your own school district’s name…
What is your European Shoe Size?
I use European shoe size because it is the same for men and women. We always have a discussion about how if we used American shoe sizes that we would have to create separate dot plots for each gender.
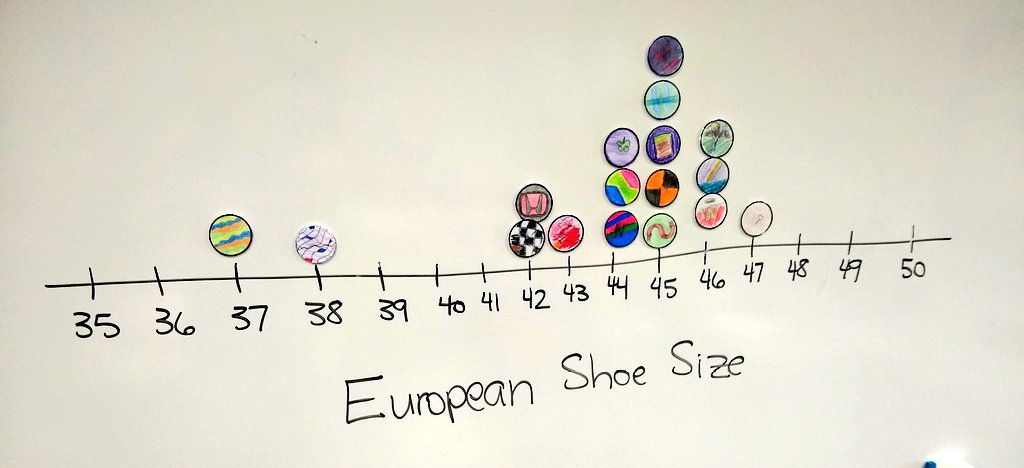
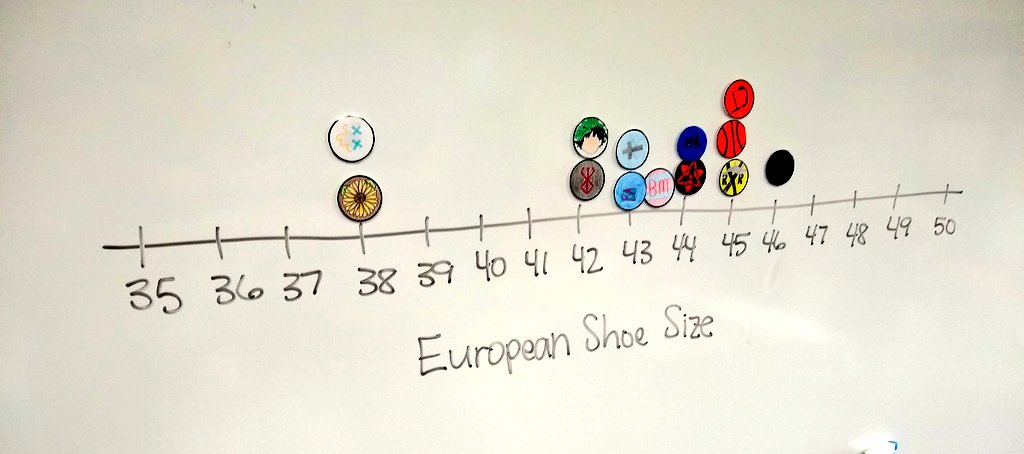
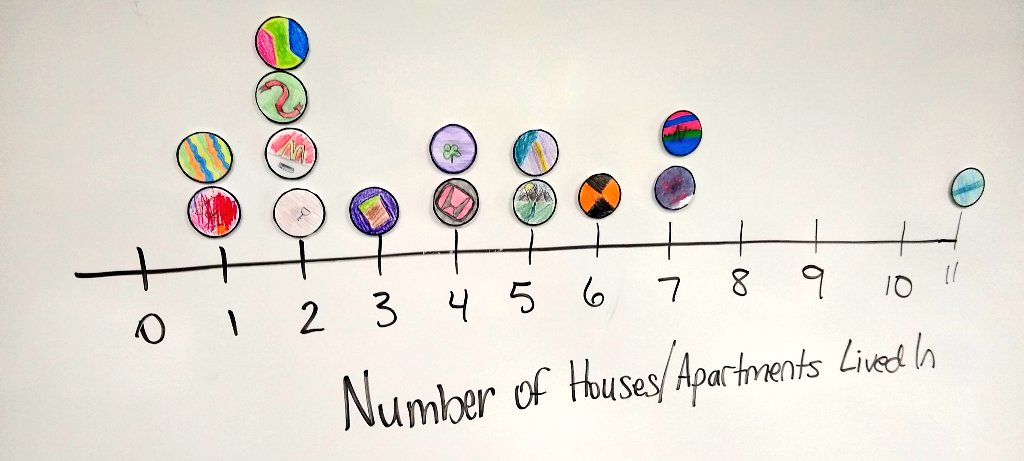
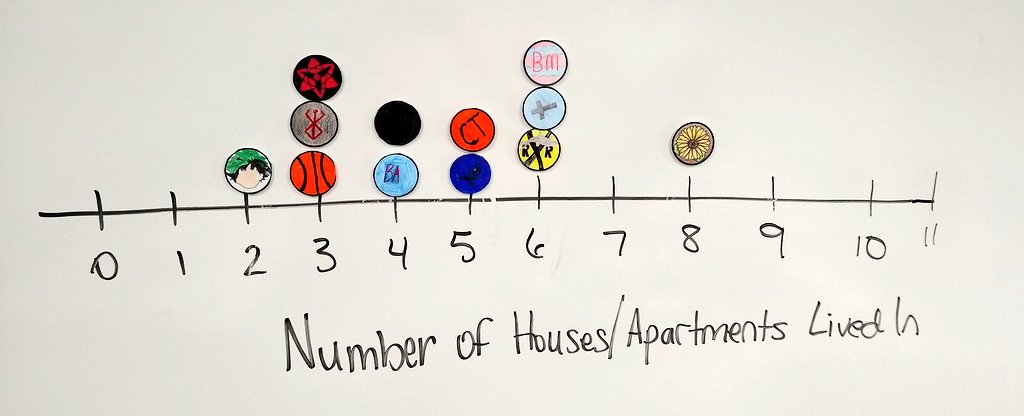
How many different houses/apartments have you lived in?
How many concerts have you attended?
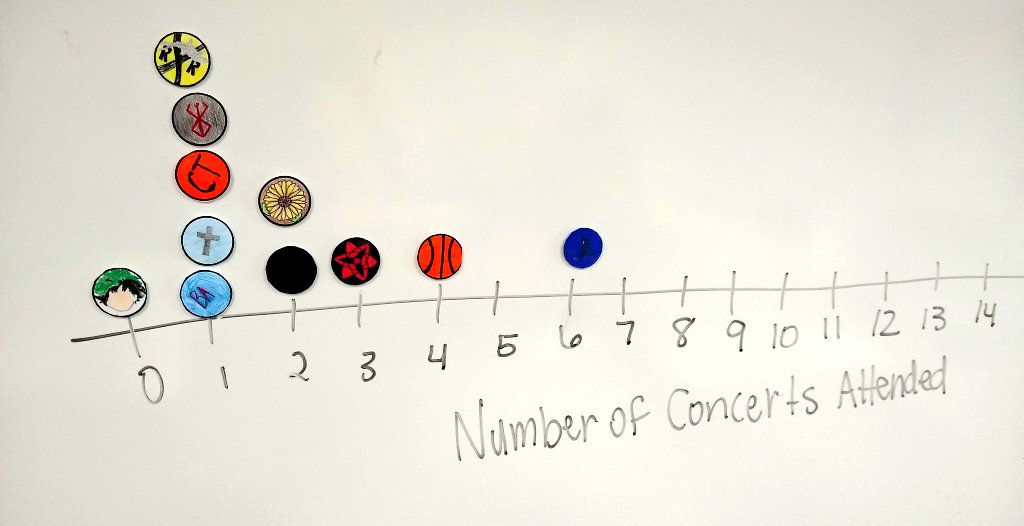
Check out this outlier! We had to make the student list off all the concerts he had attended!
