Dry Erase Workmat for Finding Five Number Summary, IQR, and Outliers
This blog post contains Amazon affiliate links. As an Amazon Associate, I earn a small commission from qualifying purchases.
My Algebra 1 students are in the midst of our next-to-last unit of the year: data analysis. This is my first year of teaching Algebra 1 where my students do not have to take an end-of-instruction exam in Algebra 1. This means that I don’t have to rush through concepts in order to have enough time to review for a test in April even though school doesn’t get out until May. Usually, our unit on data analysis is super-short as a result.
This year, I have plenty of time to really develop my students’ skill at reading data displays and creating their own data displays. Today, I want to share an activity I created to give my students practice with finding the five number summary and IQR of a set of data. Students then used this information to check for and identify outliers.
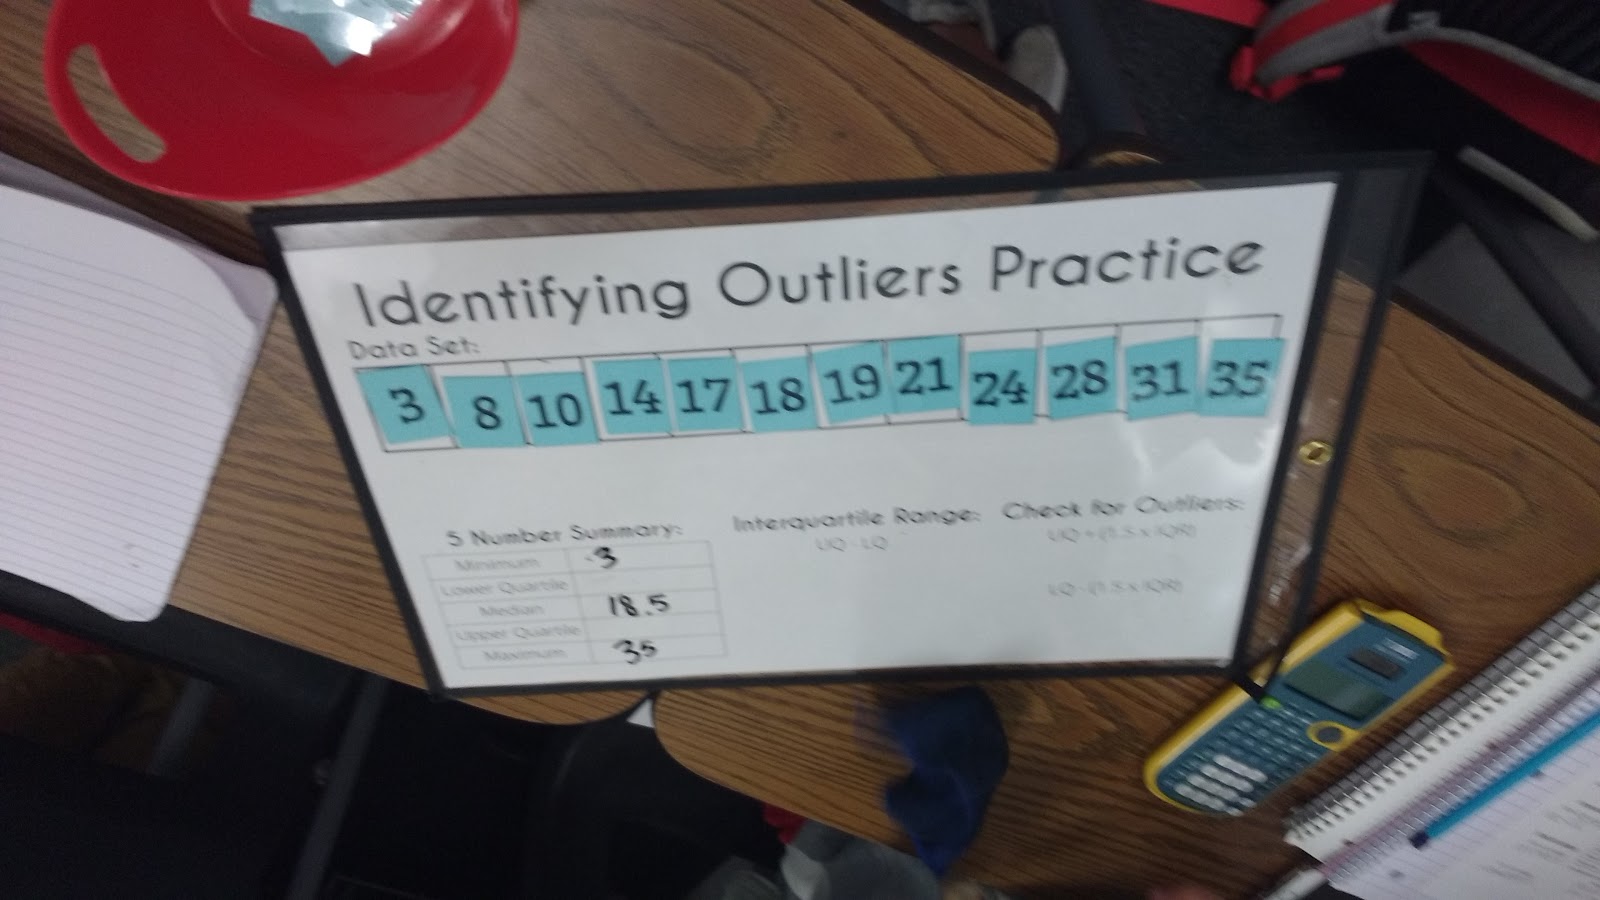
I started by creating a workmat template in Publisher. I use Publisher to create almost all of the resources I post on my blog.
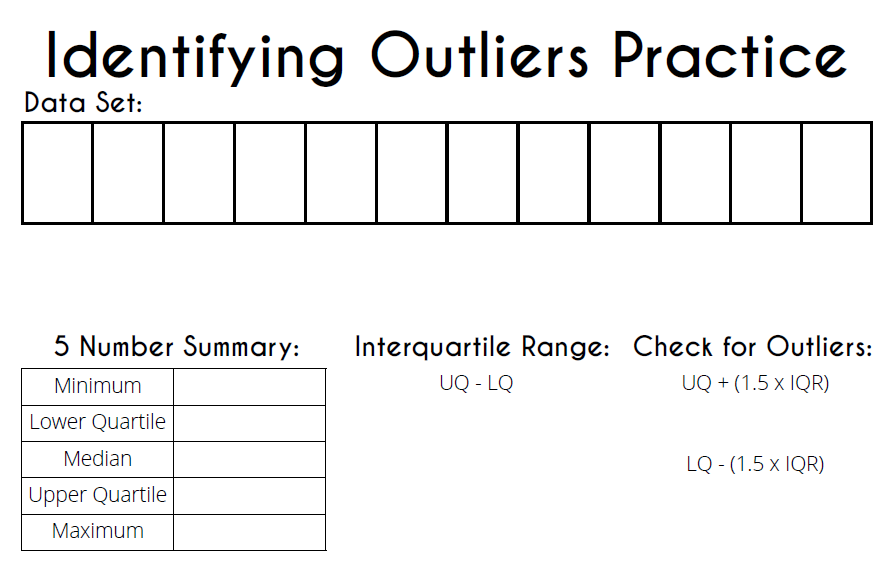
I titled it “Identifying Outliers Practice,” but it also gave my students practice with finding the five number summary and IQR. Not sure what I could title it to include those as well…
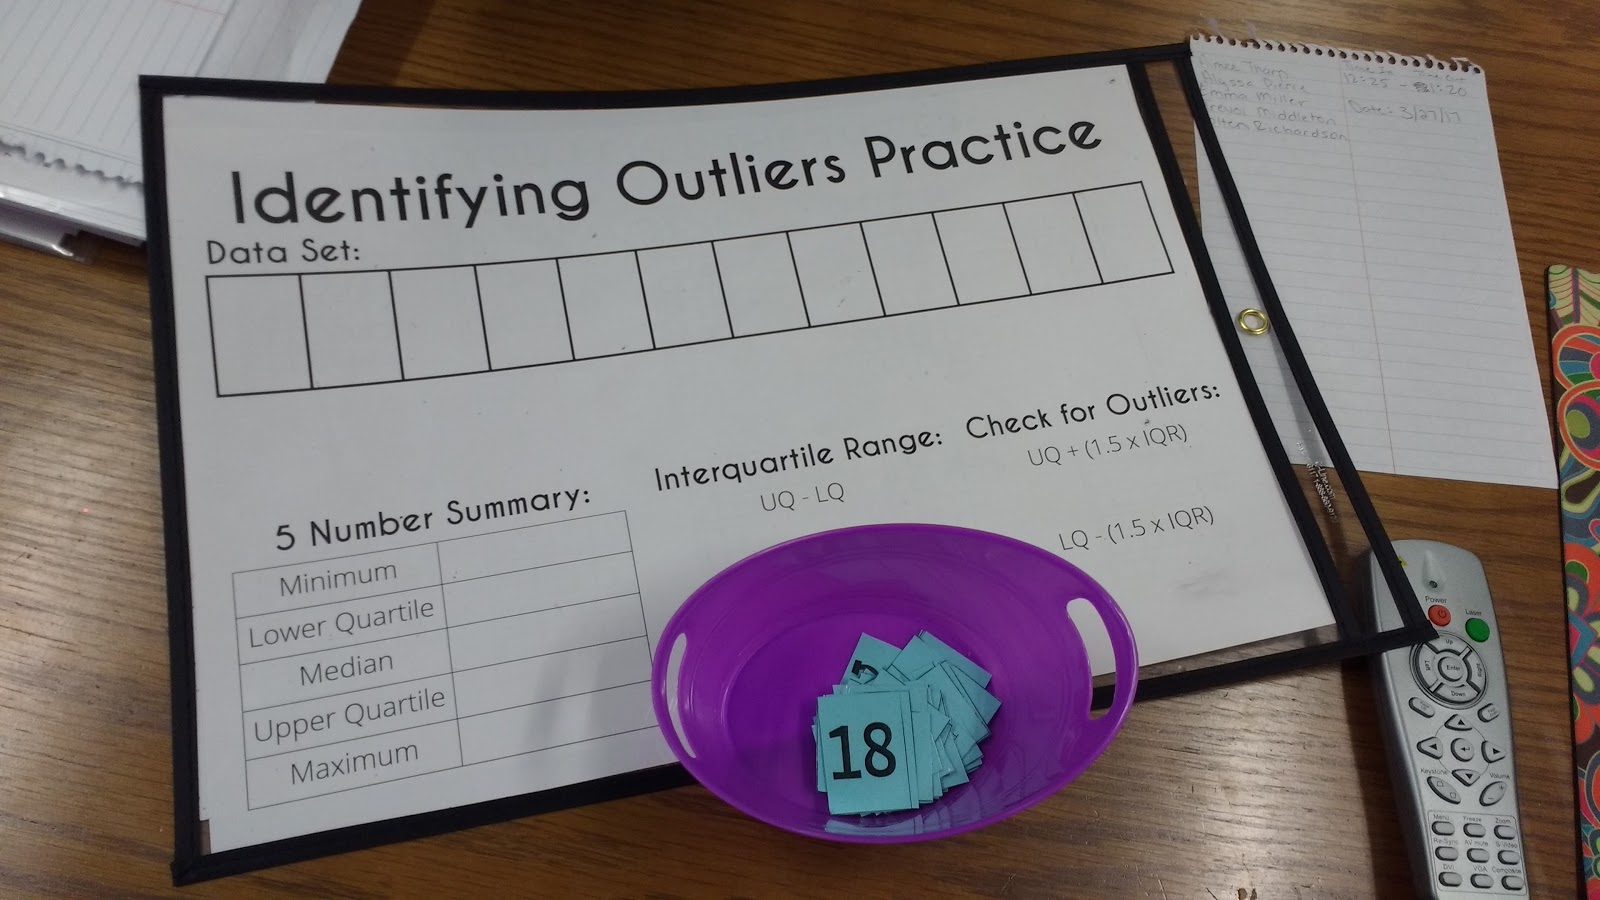
I printed this workmat on 11 x 17 cardstock that I slid into one of my 11 x 17 dry erase pockets. I have a set of smaller, 8.5 x 11 dry erase pockets, too. I prefer the 11 x 17 size for partner work.
MATH = LOVE RECOMMENDS…
I cannot imagine teaching math without my dry erase pockets! They instantly make any activity more engaging and save me countless hours at the copy machine since I can use the same class sets of copies year after year.
Here are my current go-to recommendations:
If you are looking to save a bit of money, you can also pick up a package of 11 x 17 sheet protectors for a much cheaper price! They won’t be quite as durable, but students can still write and erase with their dry erase markers.
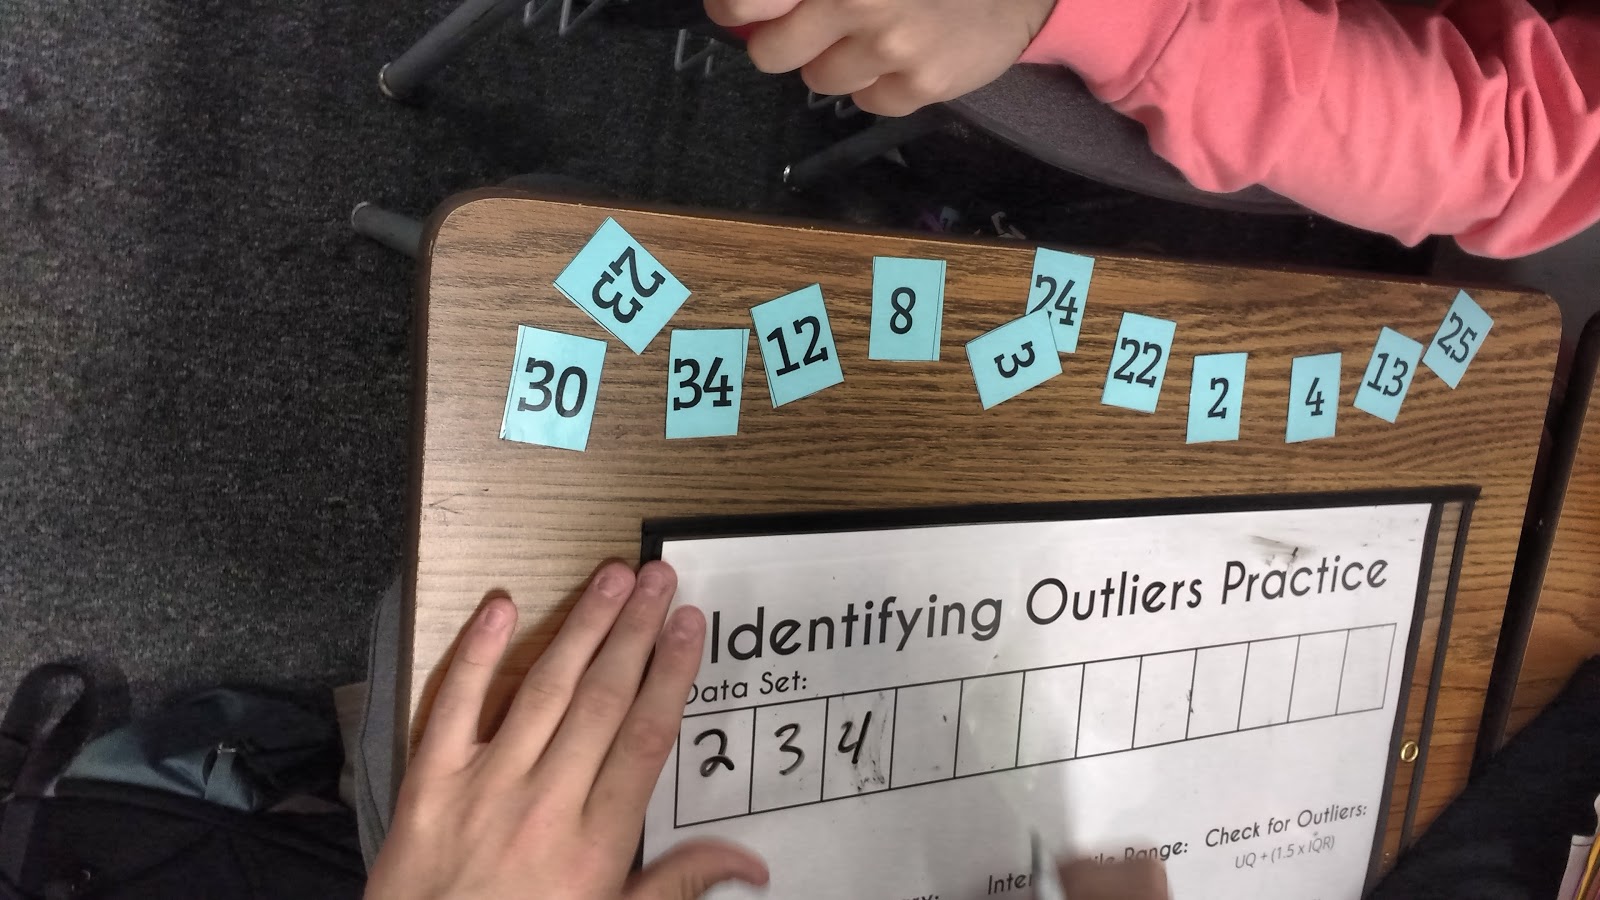
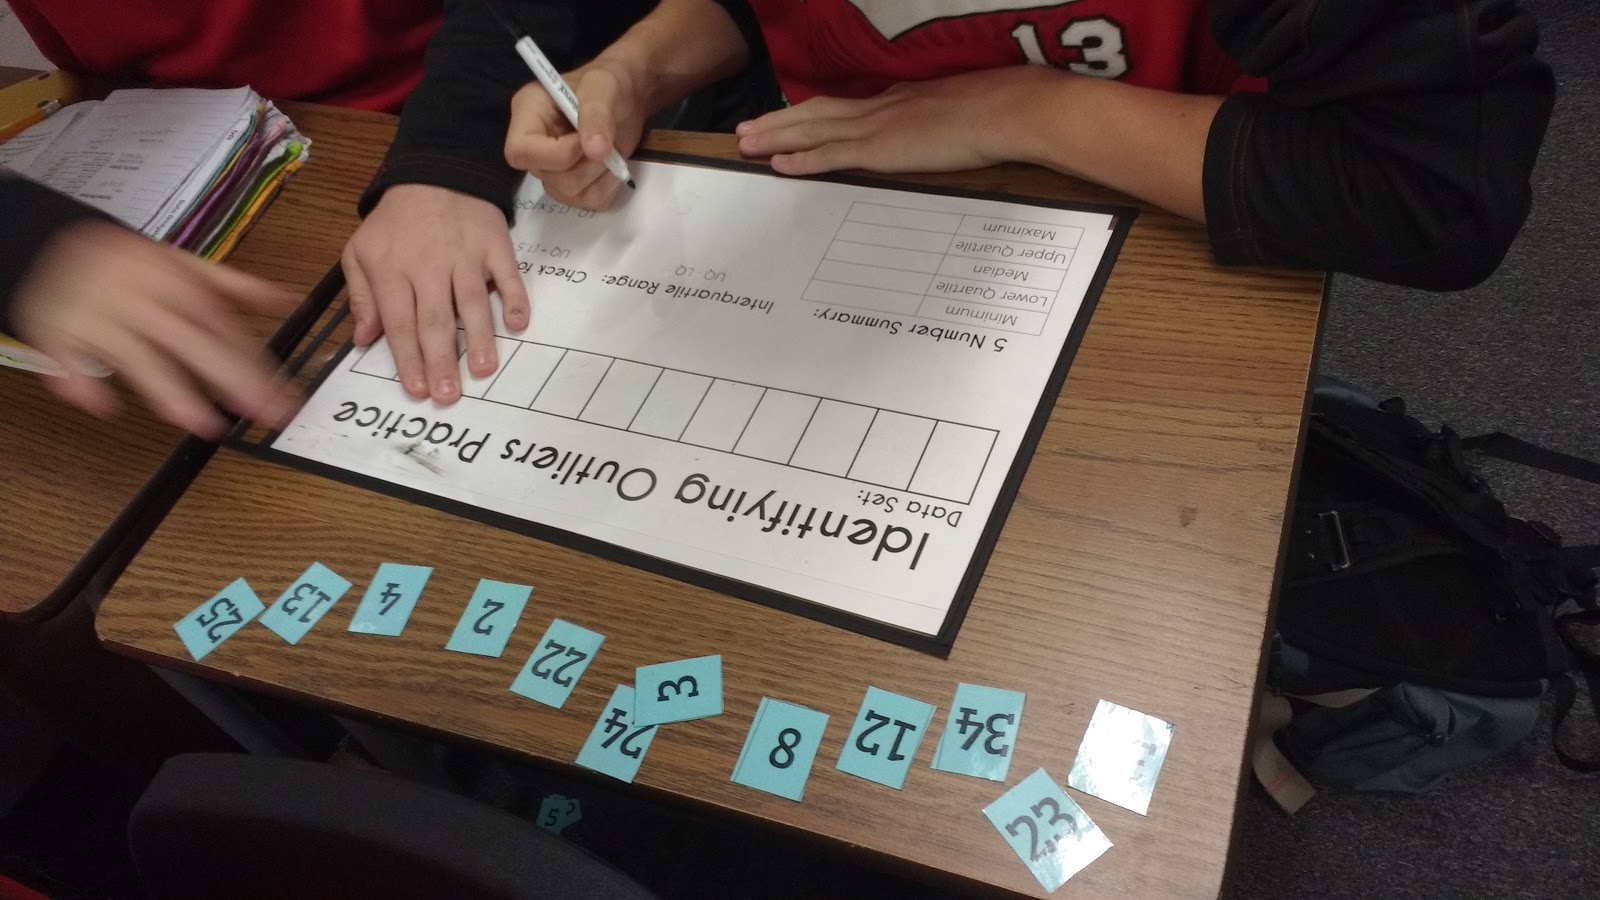
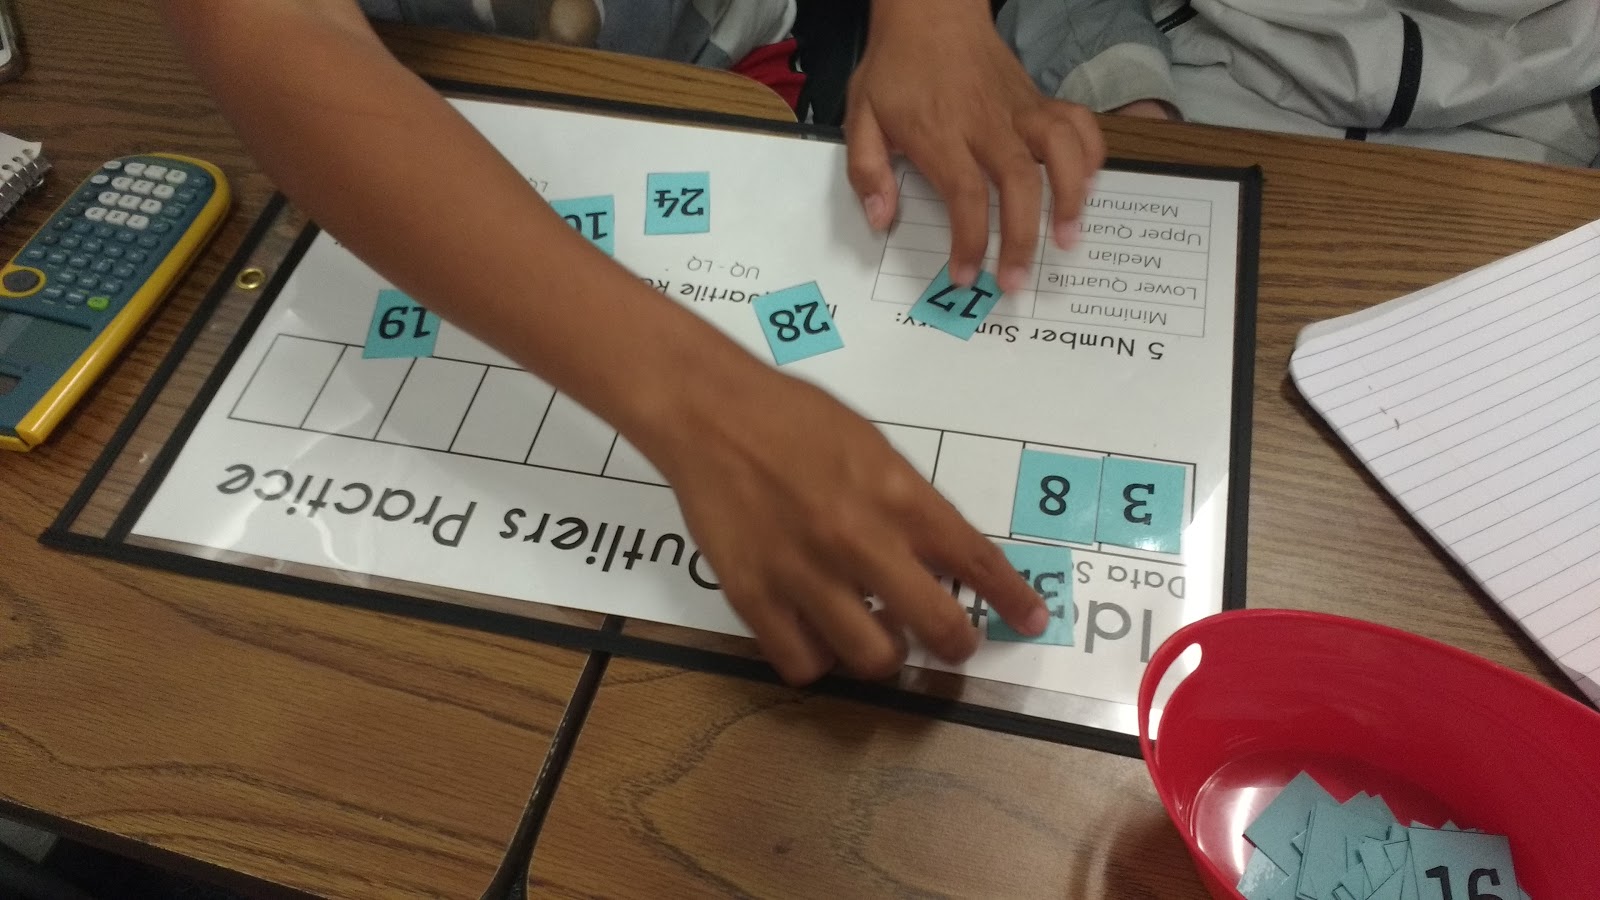
I also created a set of data value cards (1-36) that fit exactly into the data set boxes on the work mat.
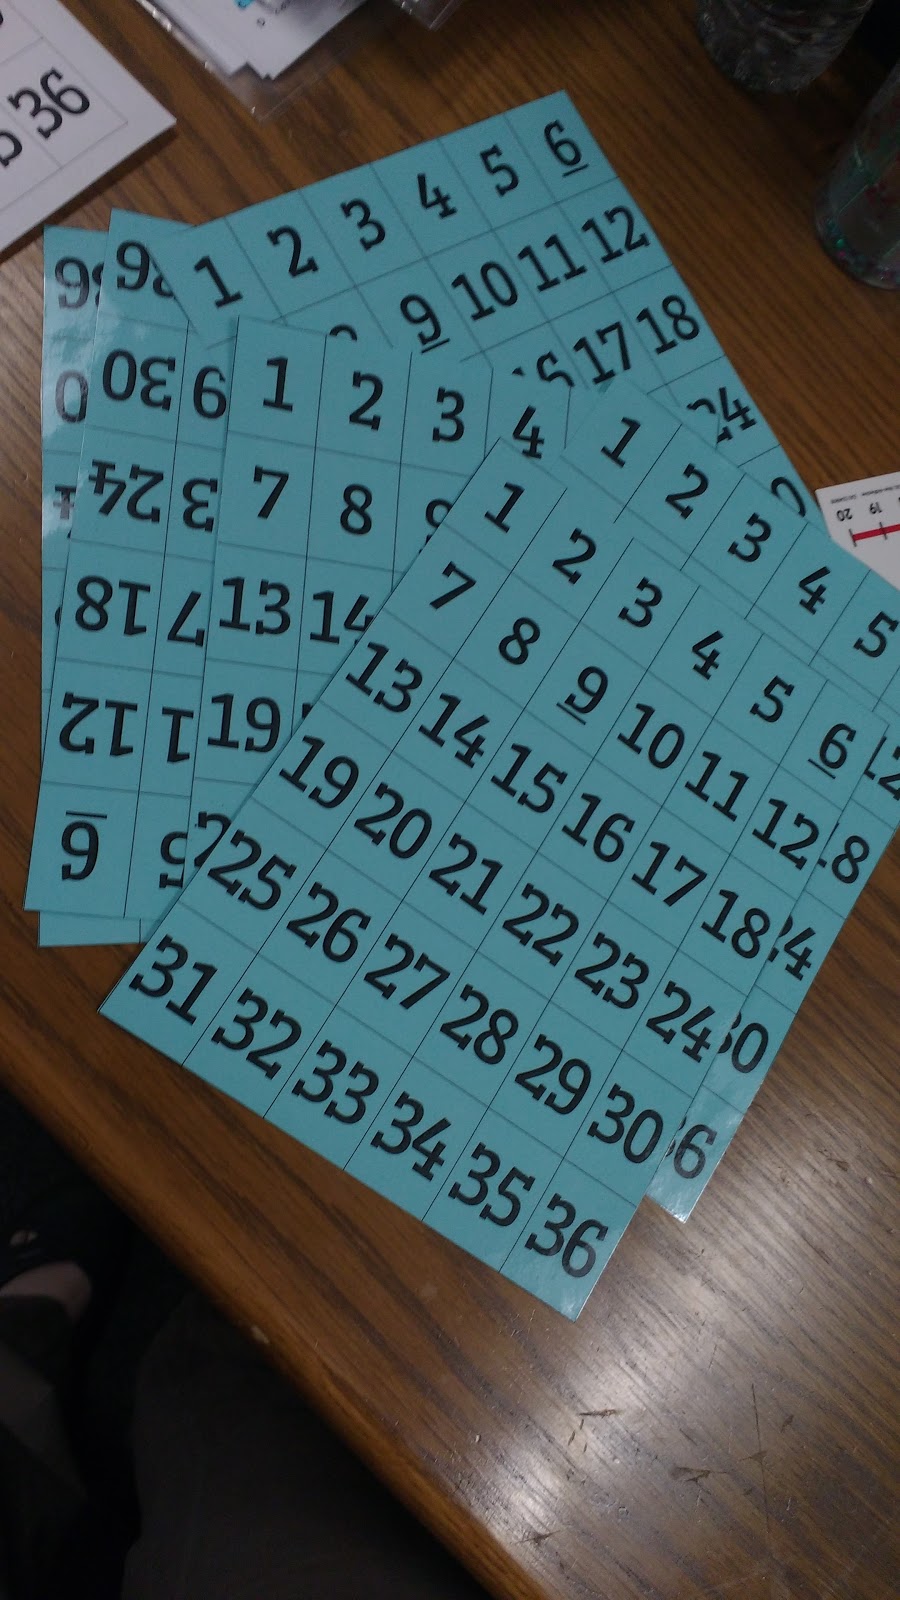
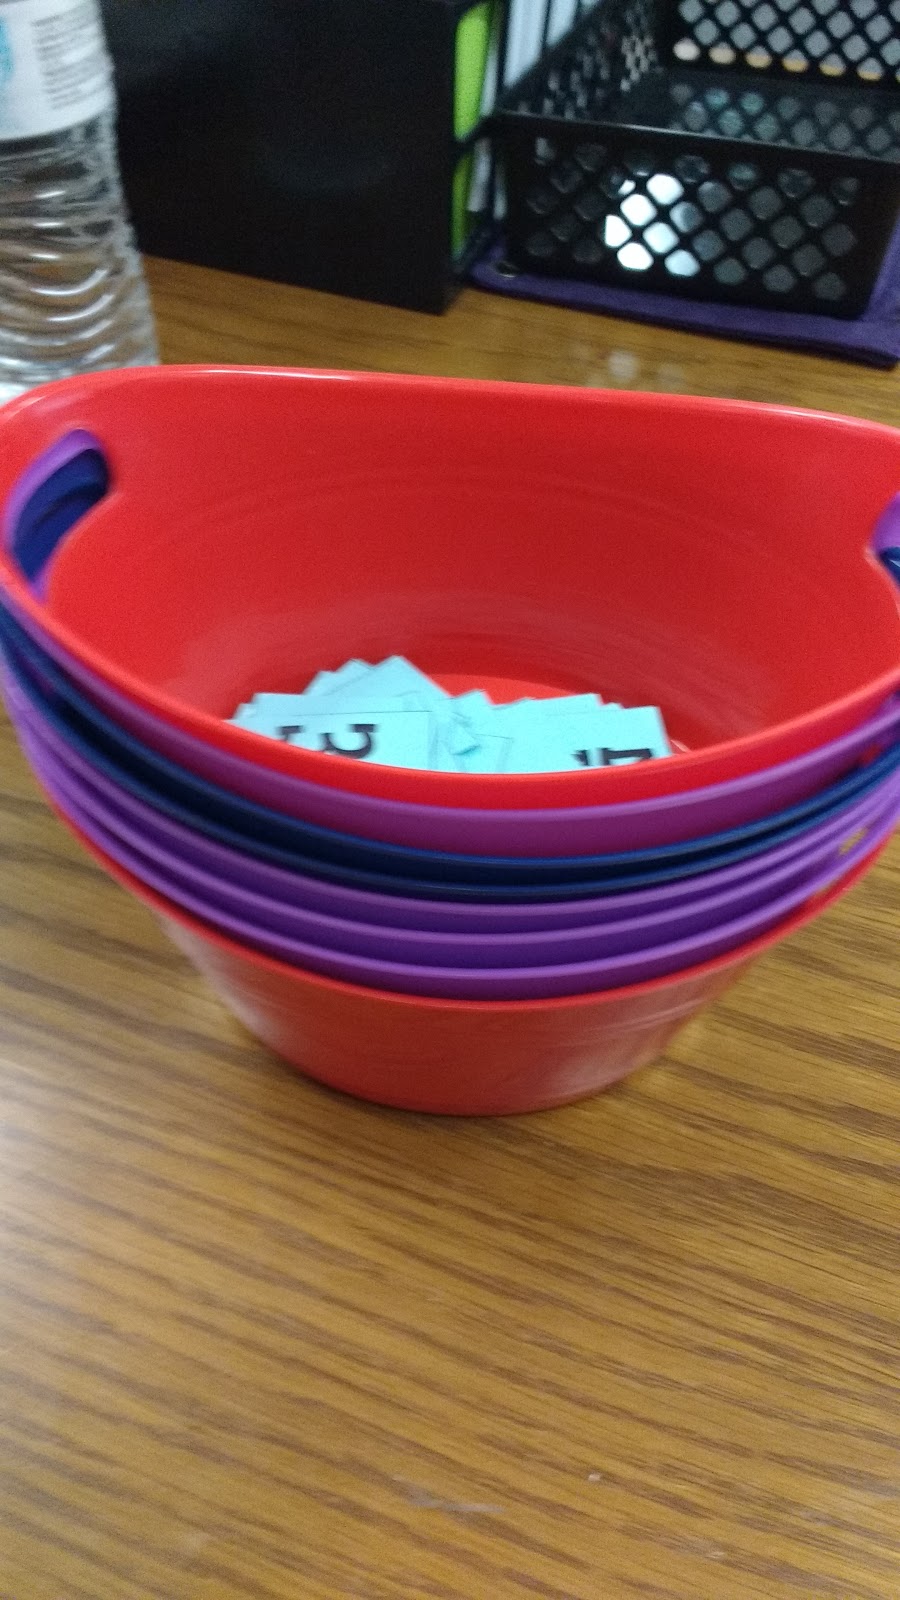
Each set was cut apart and placed in a tiny bucket from Dollar Tree.
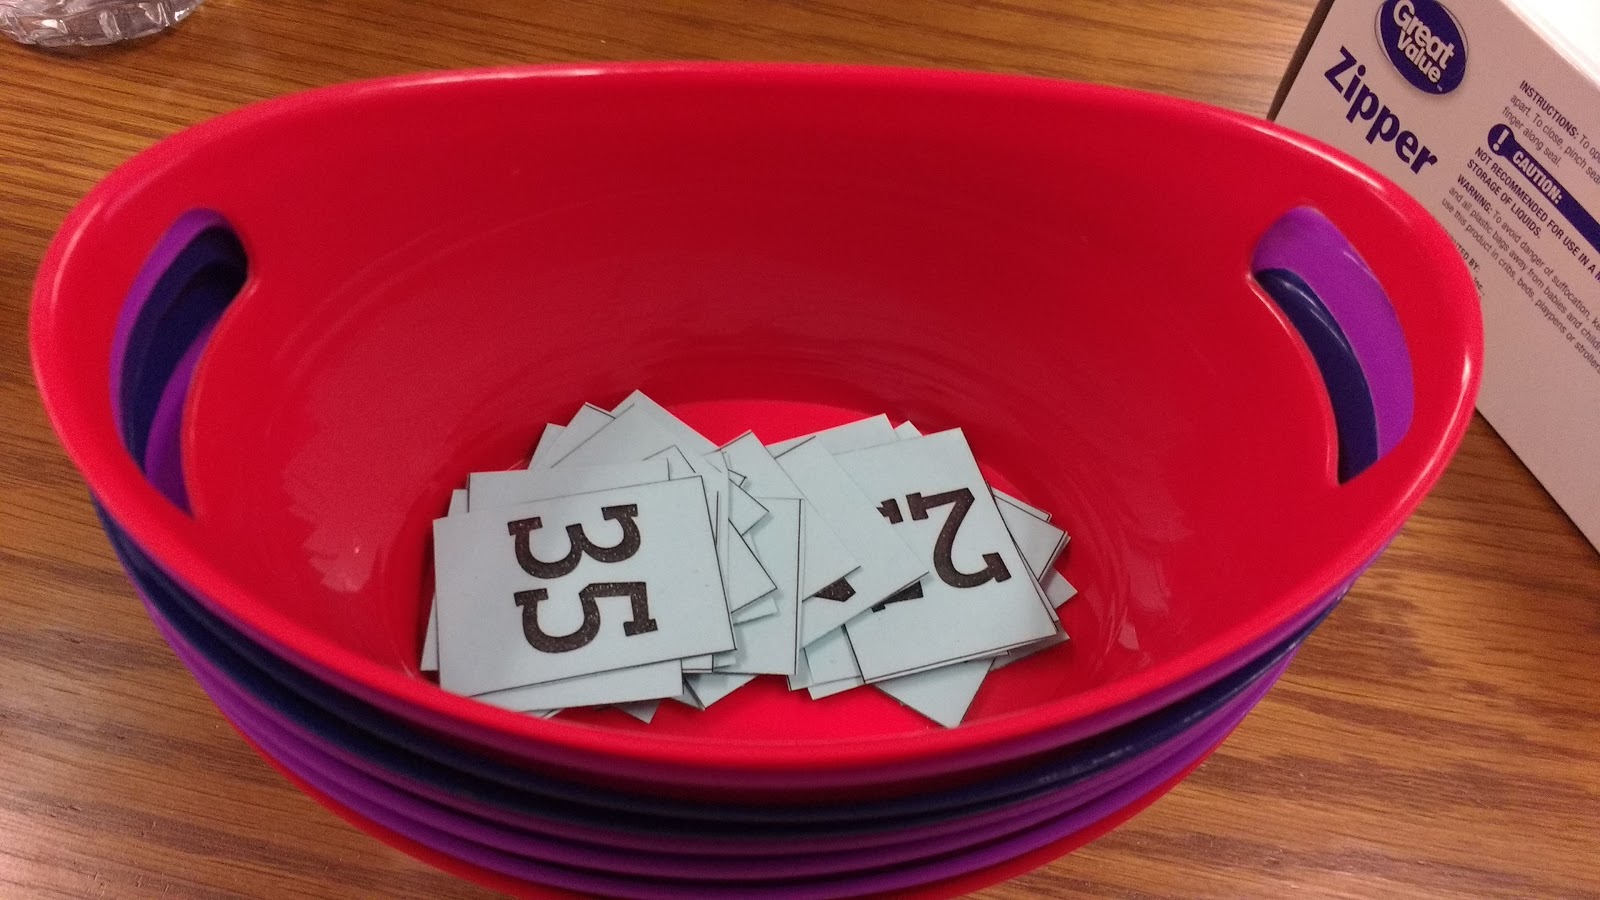
These stacked up very nicely between classes!
Like many activities I create, I ended up modifying the activity throughout the day to improve it and make it more effective. Originally, I had planned for each pair of students to roll a 12-sided die (from this set of polyhedra dice from EAI Education) to determine how many data values they should draw from their bucket before starting.
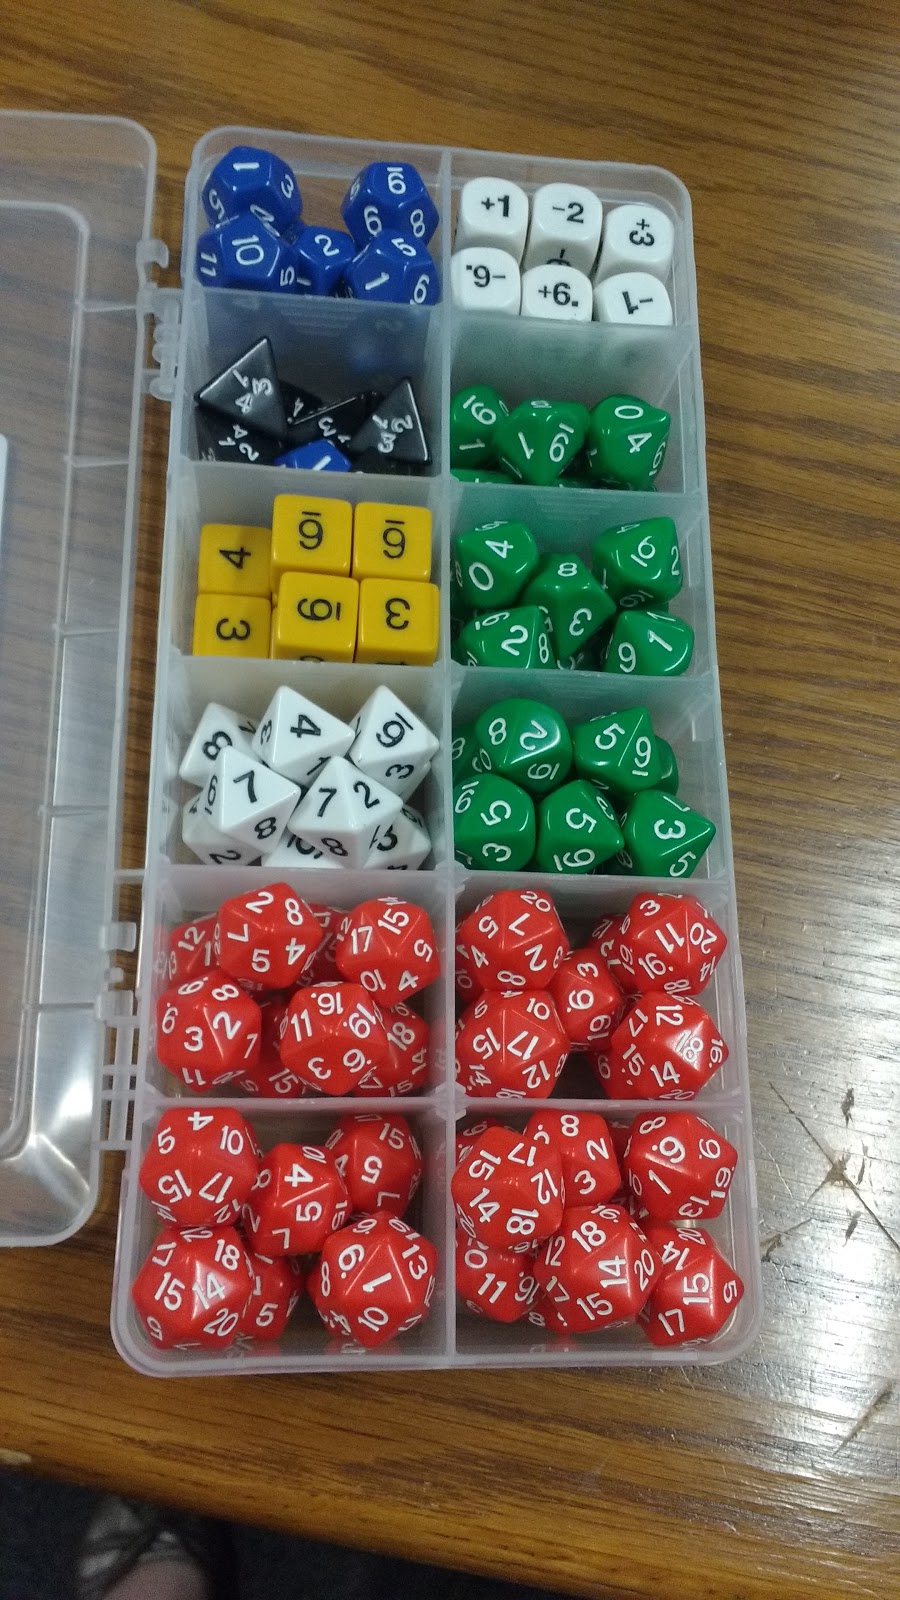
My thought behind having them roll a die was that I wanted them to get used to how to deal with quartiles when there are an even number of values and an odd number of values.
But, then my students were ending up with data sets of 3, and the data practice just wasn’t rigorous enough.
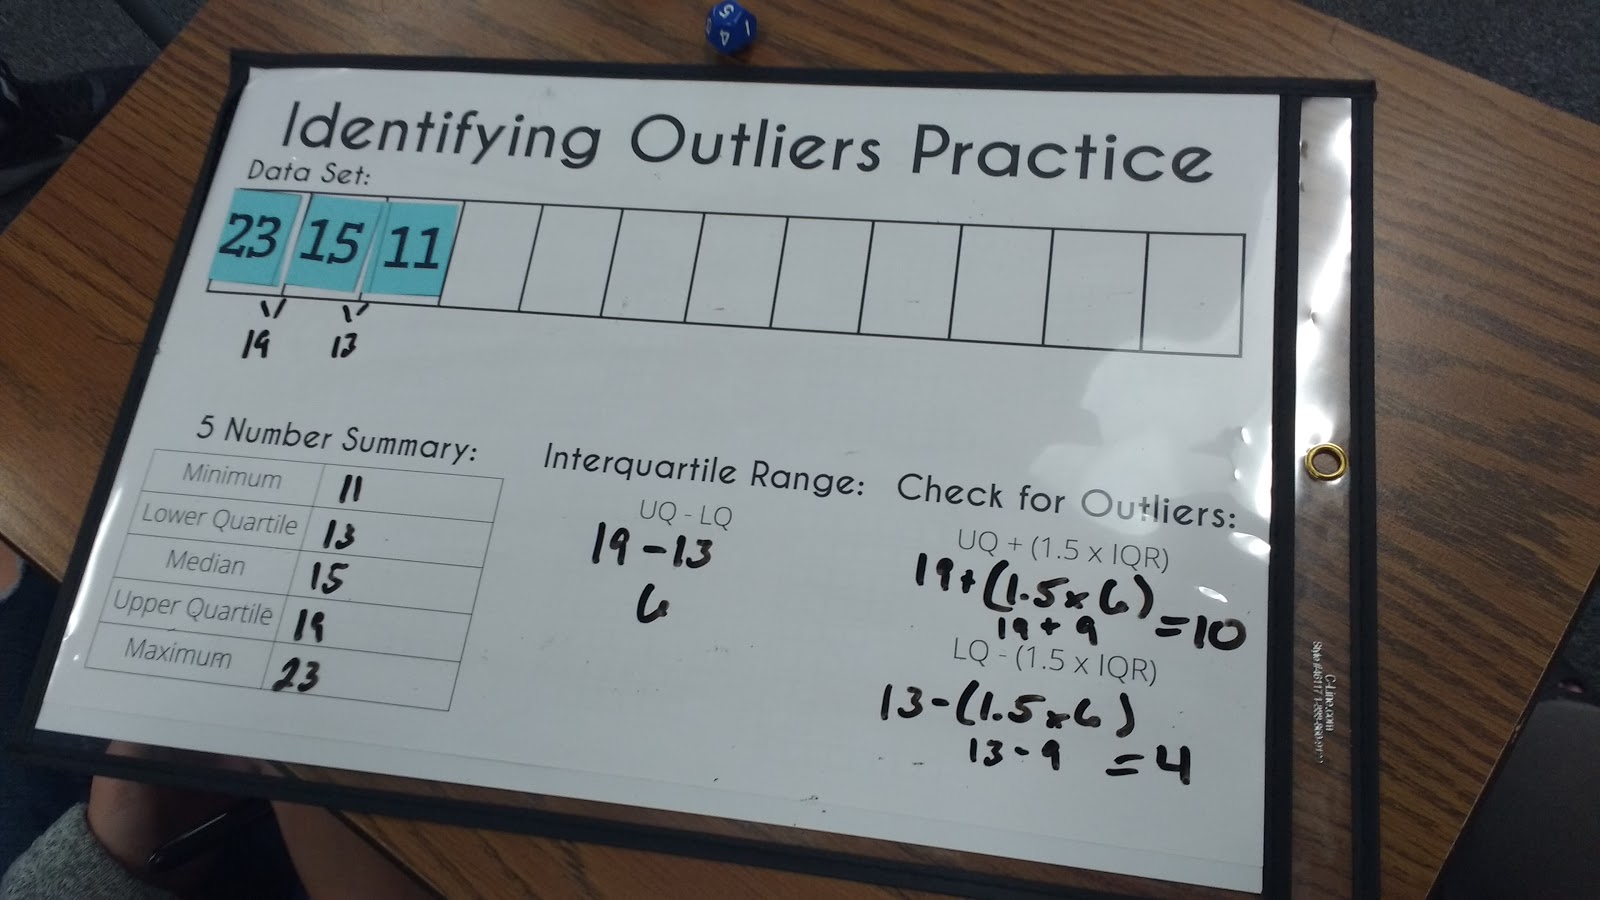
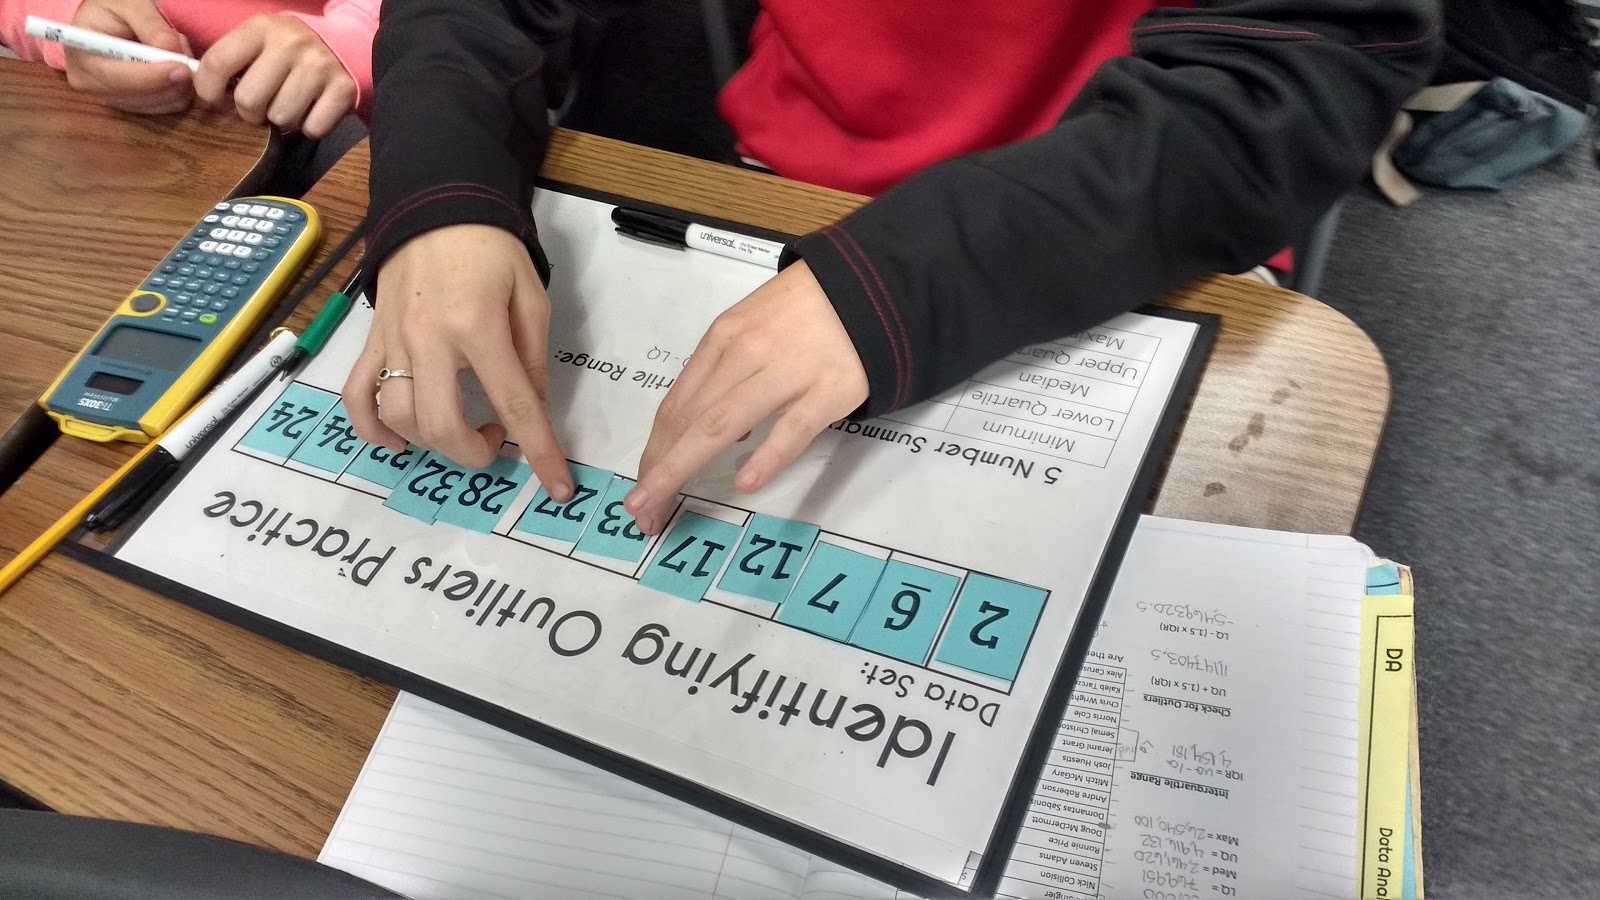
For my afternoon classes, I did away with the dice and had each pair of students draw 12 data values from their buckets. This ended up working soooo much better!
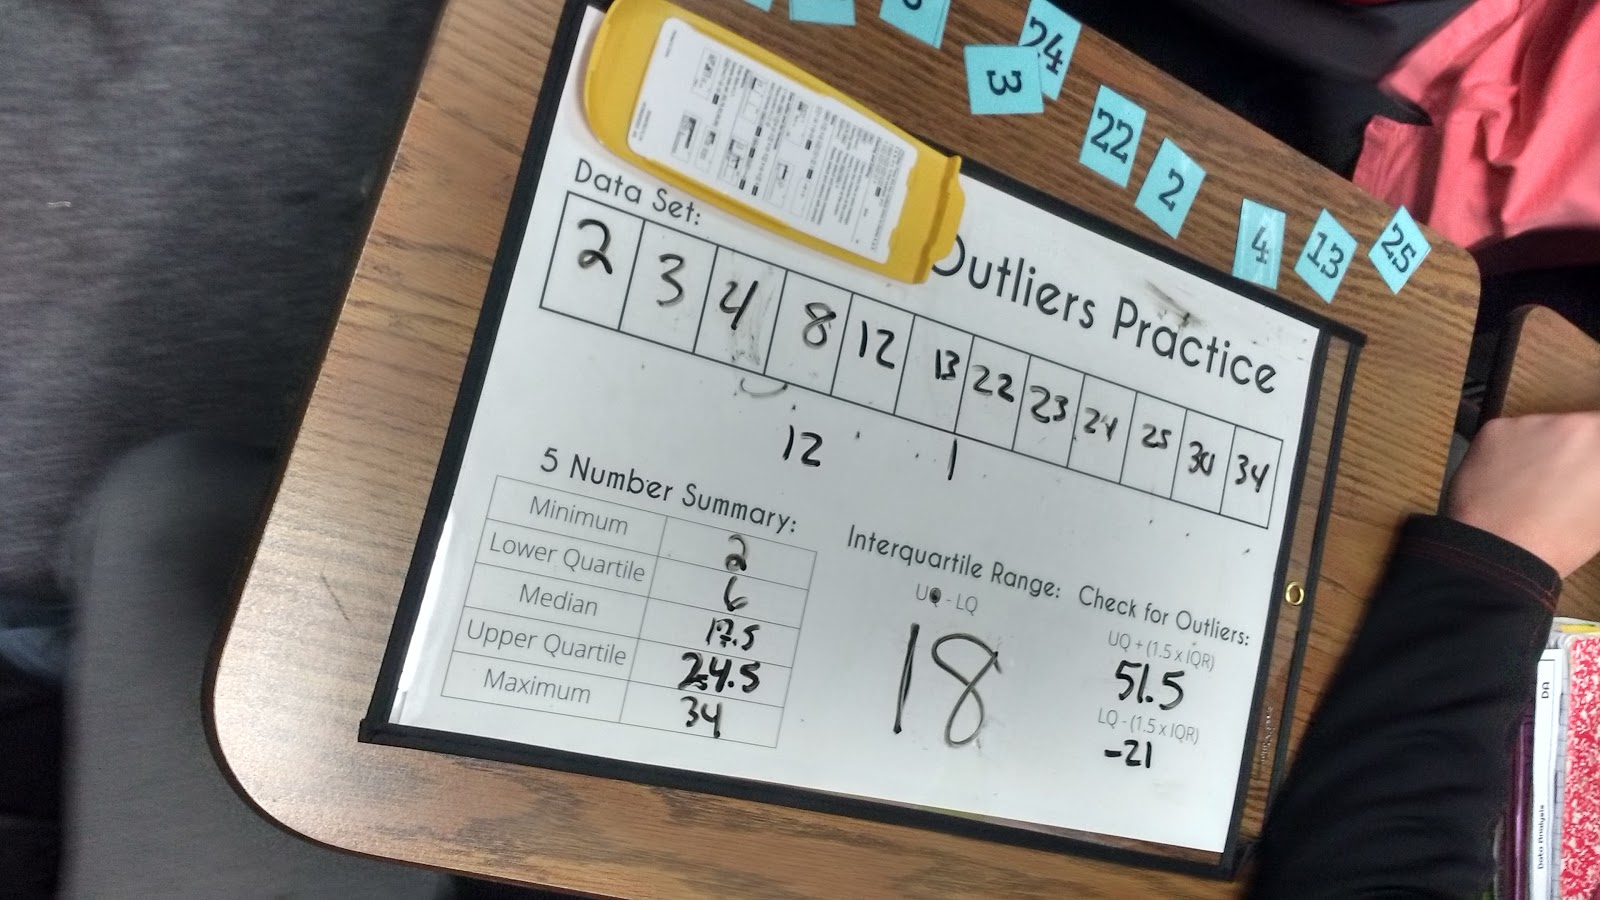
As students worked, I circulated the room and checked for errors. In the picture above, the IQR should actually be 18.5.
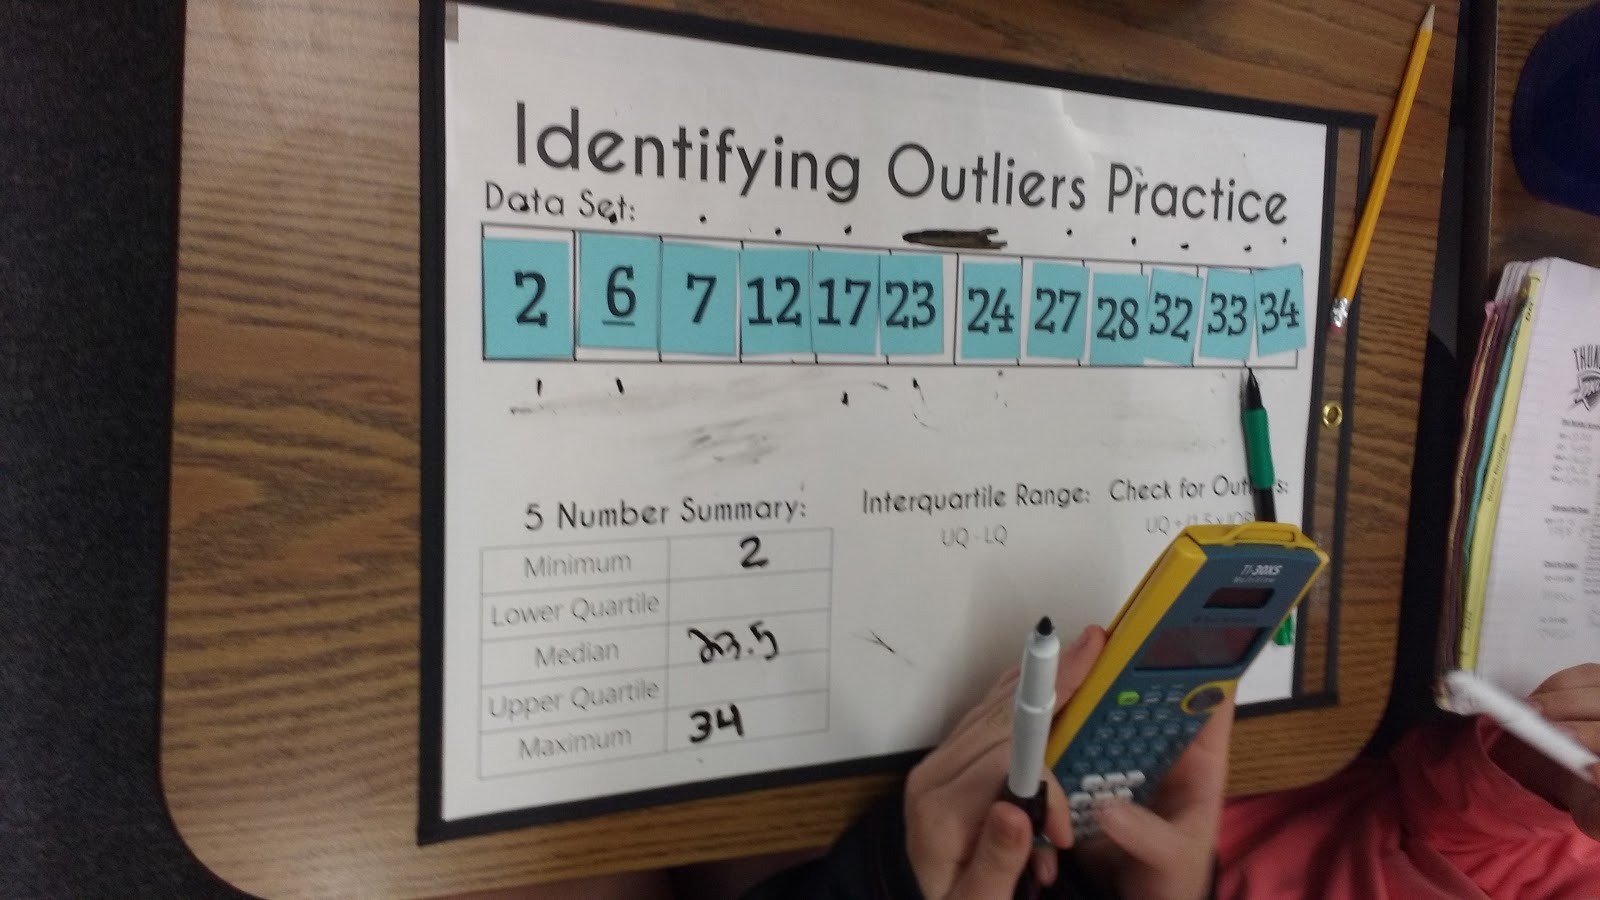
As pairs finished, they would raise their hands to have their calculations spot-checked.
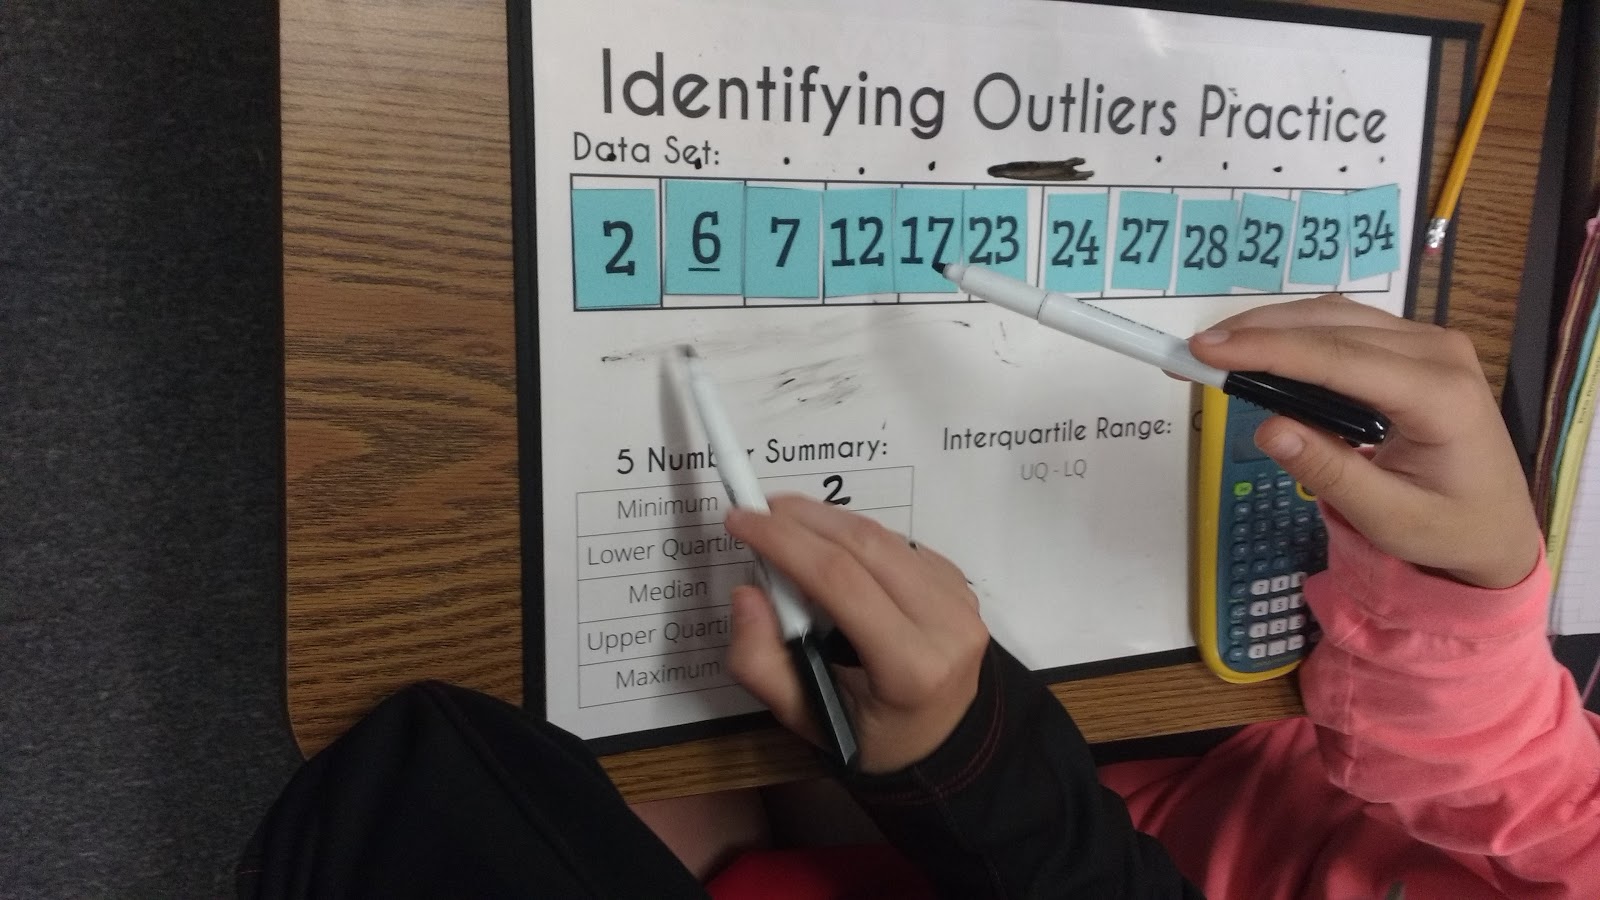
One of the issues I didn’t foresee with this activity was that the majority of students did not find any outliers in their data.
It ended up being okay because after I checked each pair’s work, I would challenge them to create their own data set that had outliers.
This ended up being the perfect extension activity!
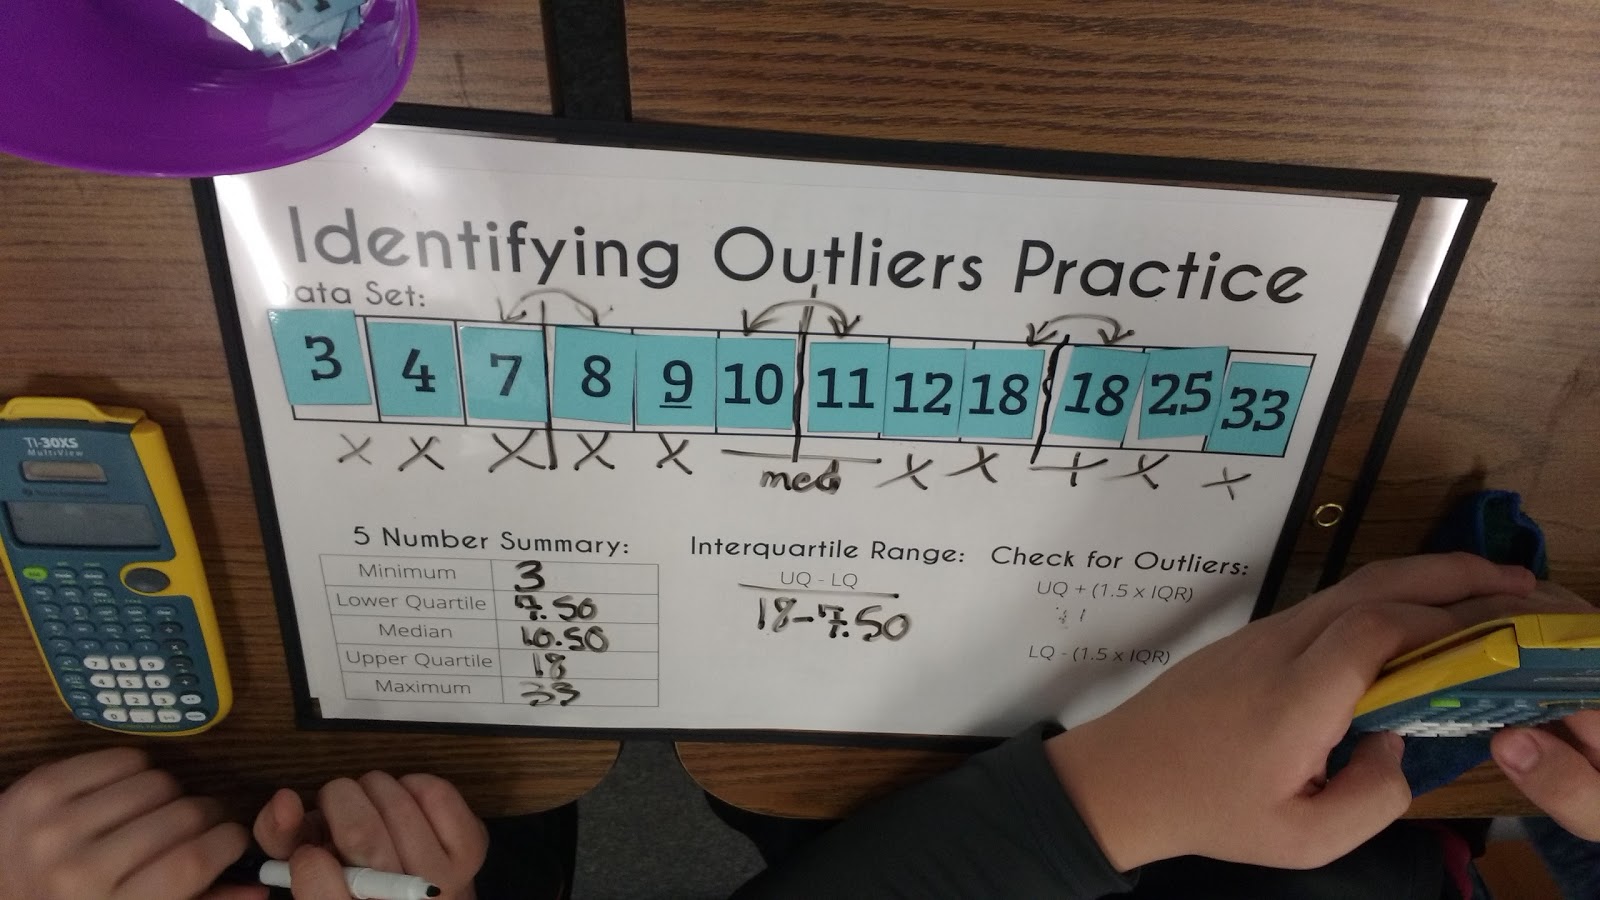
I love how much collaboration I can see with my students in these pictures!
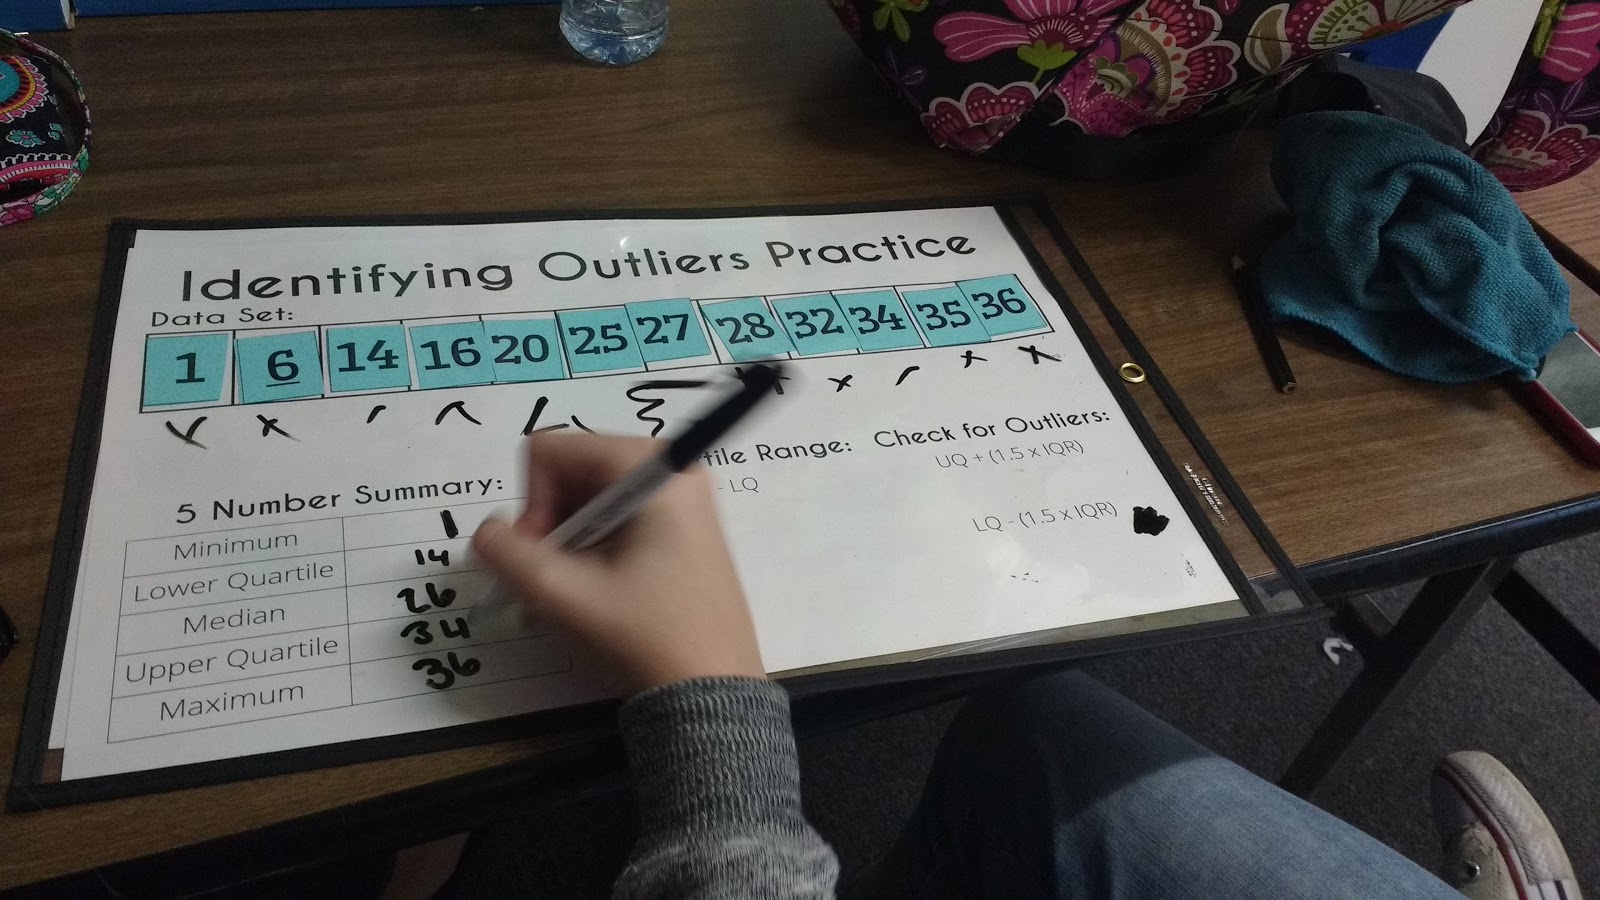
There are a few changes I would like to make in the future to this activity.
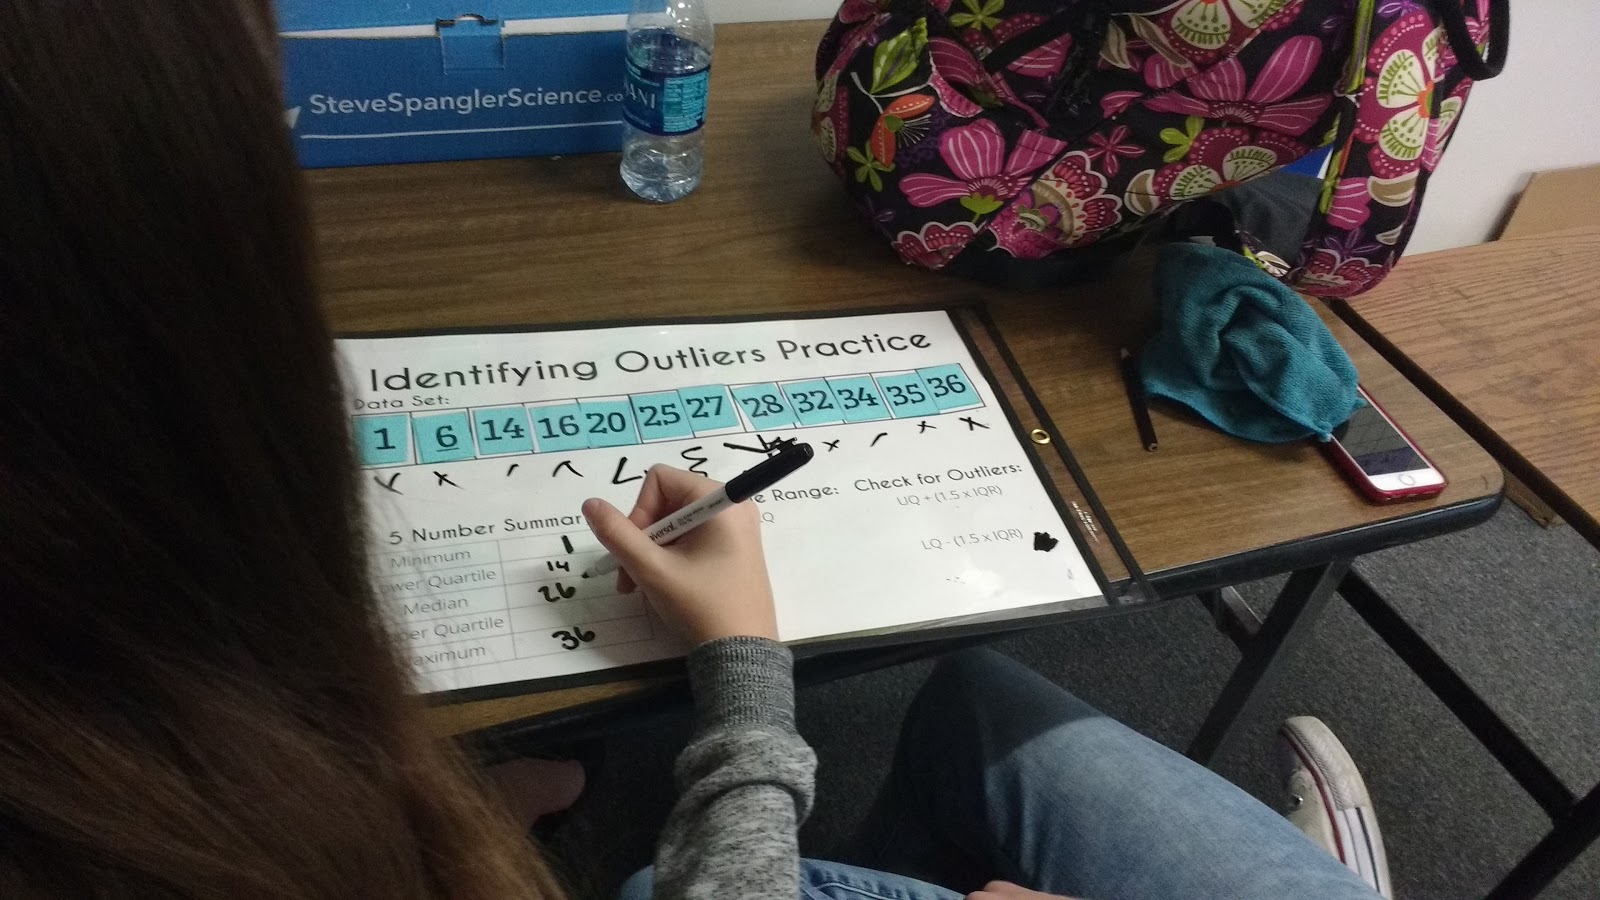
After students draw their data values and before they begin doing any calculations, I would like to have my students make a prediction re: outliers.
Then, after they finish all of their calculations, I would like them to write a sentence explaining why or why not the data contains outliers. My students really struggled with writing a sentence to justify their outliers on their quizzes. I need to start practicing that earlier!
Additionally, I would like to create a set of “challenge cards” for students to work through. For example, each card would tell them how many cards to choose from the bucket. Students might randomly pick cards, or they might pick specific cards to try and achieve a specific thing.
Files for Identifying Outliers Activity
Click here to SAVE the file to your device.
Random Data Cards 1-36 (PDF)
1874 saves – 266.79 KB

Love This! We're knee deep in box plots, so I need to do something similar…. this just launched my next activity. Thank you!!
Awesome! I look forward to seeing how others adapt it further. 🙂
I definitely want to use this work mat next year! And I love how they can manipulate the data to put it in order. But, how did you get so lucky that your kids don't have to take an end of course exam?! Ours is next week!
The State of Oklahoma recently updated their testing requirements to align with the bare minimum dictated by the federal government. It has certainly taken a lot of stress away from teaching Algebra 1!
Where or how can I get my hands on those plastic "white boards". I really would like to buy some.
thanks
Search for "shop ticket holders" on Amazon!