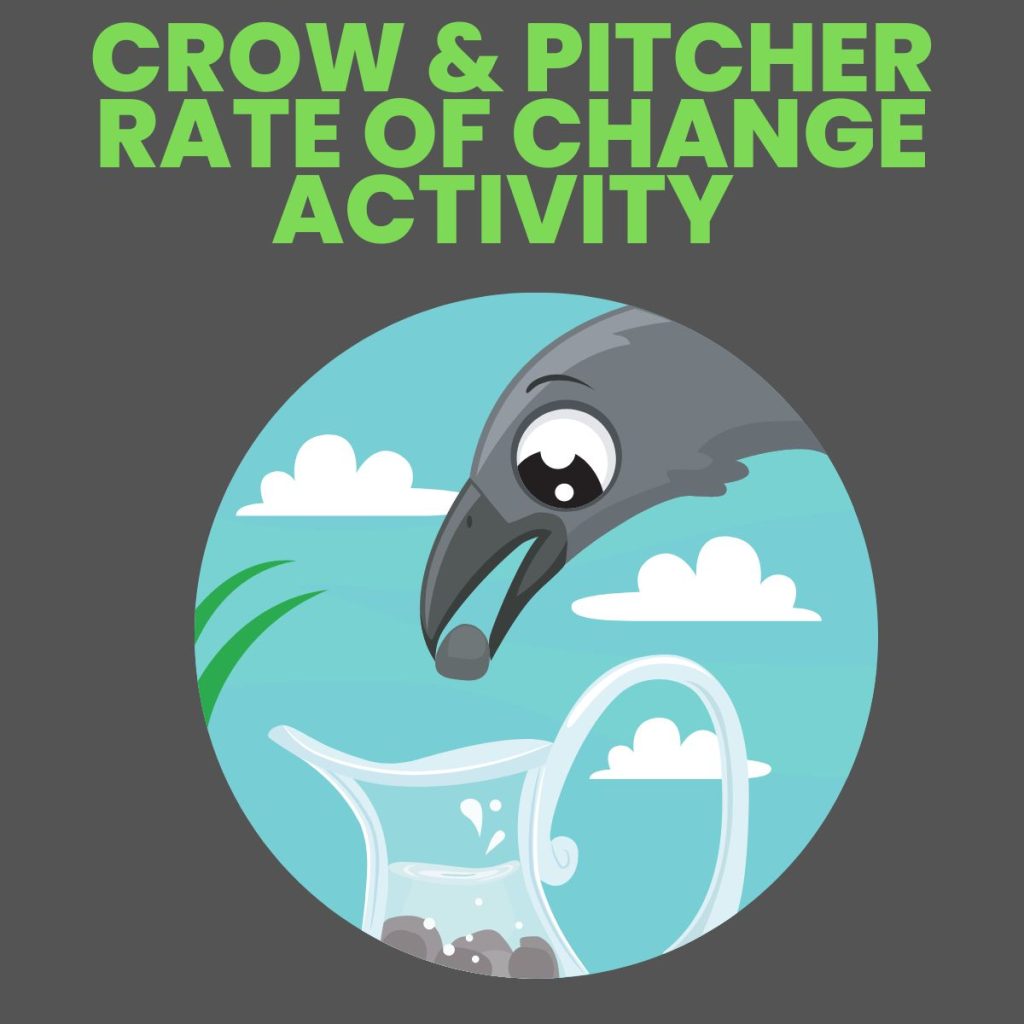
Crow and the Pitcher Activity for Introducing Rate of Change
This crow and the pitcher activity for introducing the concept of rate of change was a huge hit with my Algebra 1 students. My math students loved getting out the science lab materials to do a lab activity since they usually only see the labs I have set up for my physical science students.
The other day, someone asked me how my physical science class was going. I replied that it was going well and was definitely an interesting adventure.
Then, I told them that the most exciting thing that has come out of me teaching science is that it has changed the way I teach math.
Here’s a recent set-up for an Algebra 1 lesson. You definitely wouldn’t have seen this happen in my classroom before this year.
Proof: a trig student walked in and said something about how we must have done a lab in physical science. They were shocked when I said it was actually an Algebra 1 lab!
The biggest thing that has helped this transformation is having science equipment in my classroom. I guess I could have always borrowed some from the science lab in the past, but the thought never really occurred to me.
I need to say a HUGE thanks to OERB for filling my classroom with free science lab equipment.
The goal of this activity was to help my students visualize what rate of change looks like in real life. We did this activity as our very first introduction to rate of change.
This followed directly after our exploration of independent vs. dependent variables. This lesson is based on NCTM Illumination’s Crow and the Pitcher lesson.
I had slightly different goals for my students than the NCTM lesson had, so I took their lesson and revamped it to fit what I was looking for.
I began class by asking my students if they had ever heard of Aesop’s fables. Almost every single one of them said they had never heard of Aesop or his fables before.
But, when I asked them if they had heard of the tortoise and the hare, light bulbs started going off. We discussed what the moral of the story was about. Then, I told them the story of the crow and the pitcher.
If you’re not familiar with the story, NCTM has a nice printable version here.
I found out that several of my students did already know the story because they were eager to jump to the ending before I was!
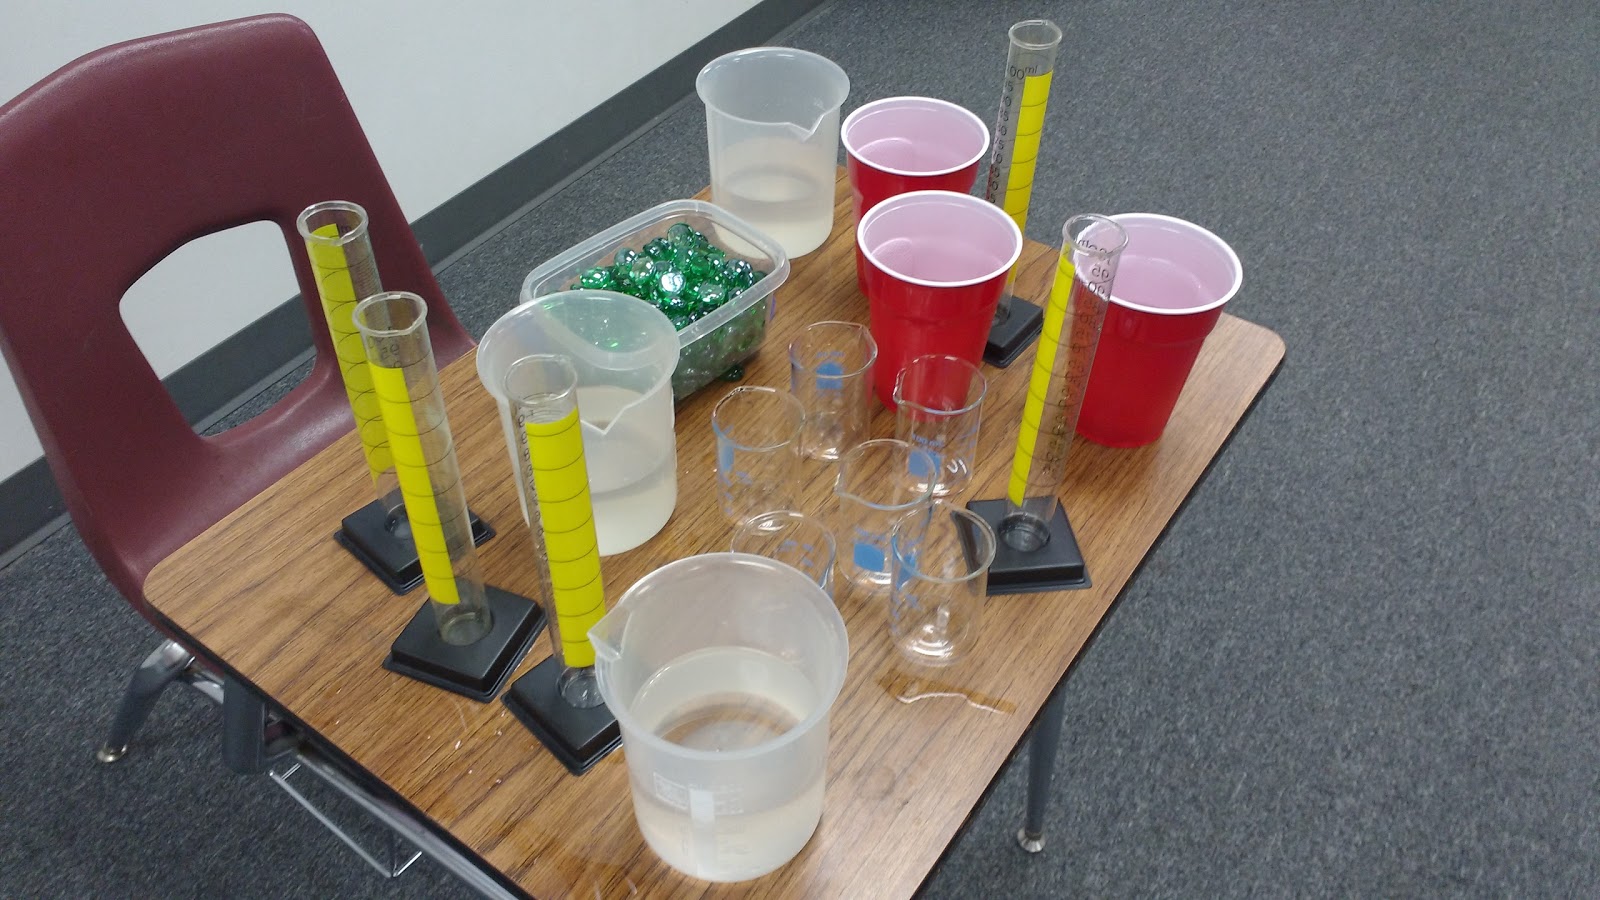
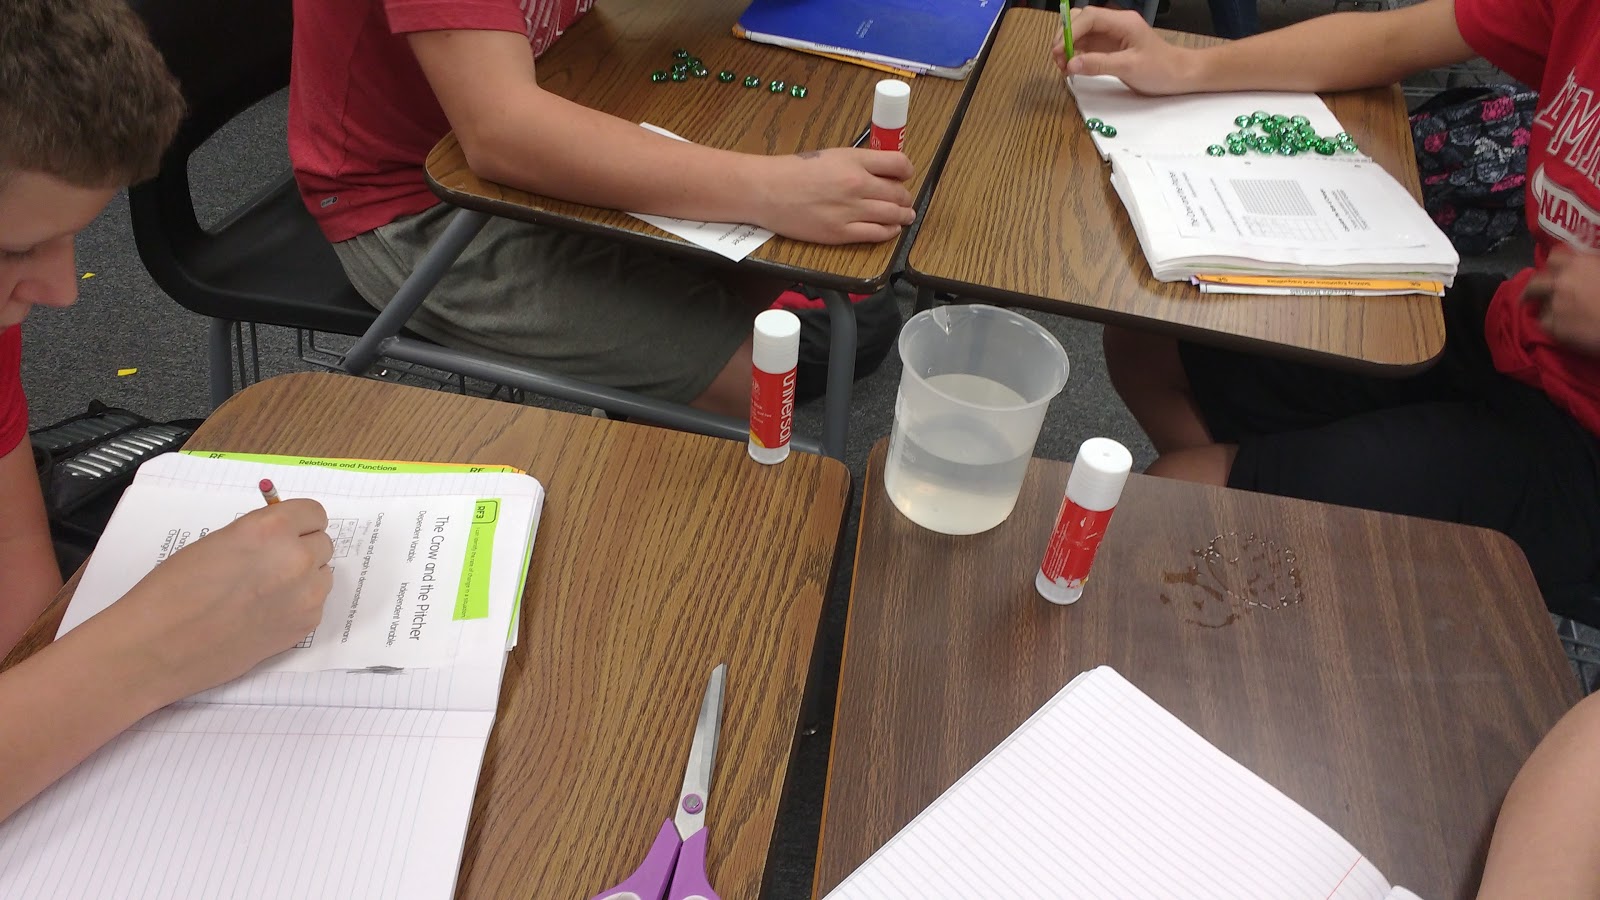
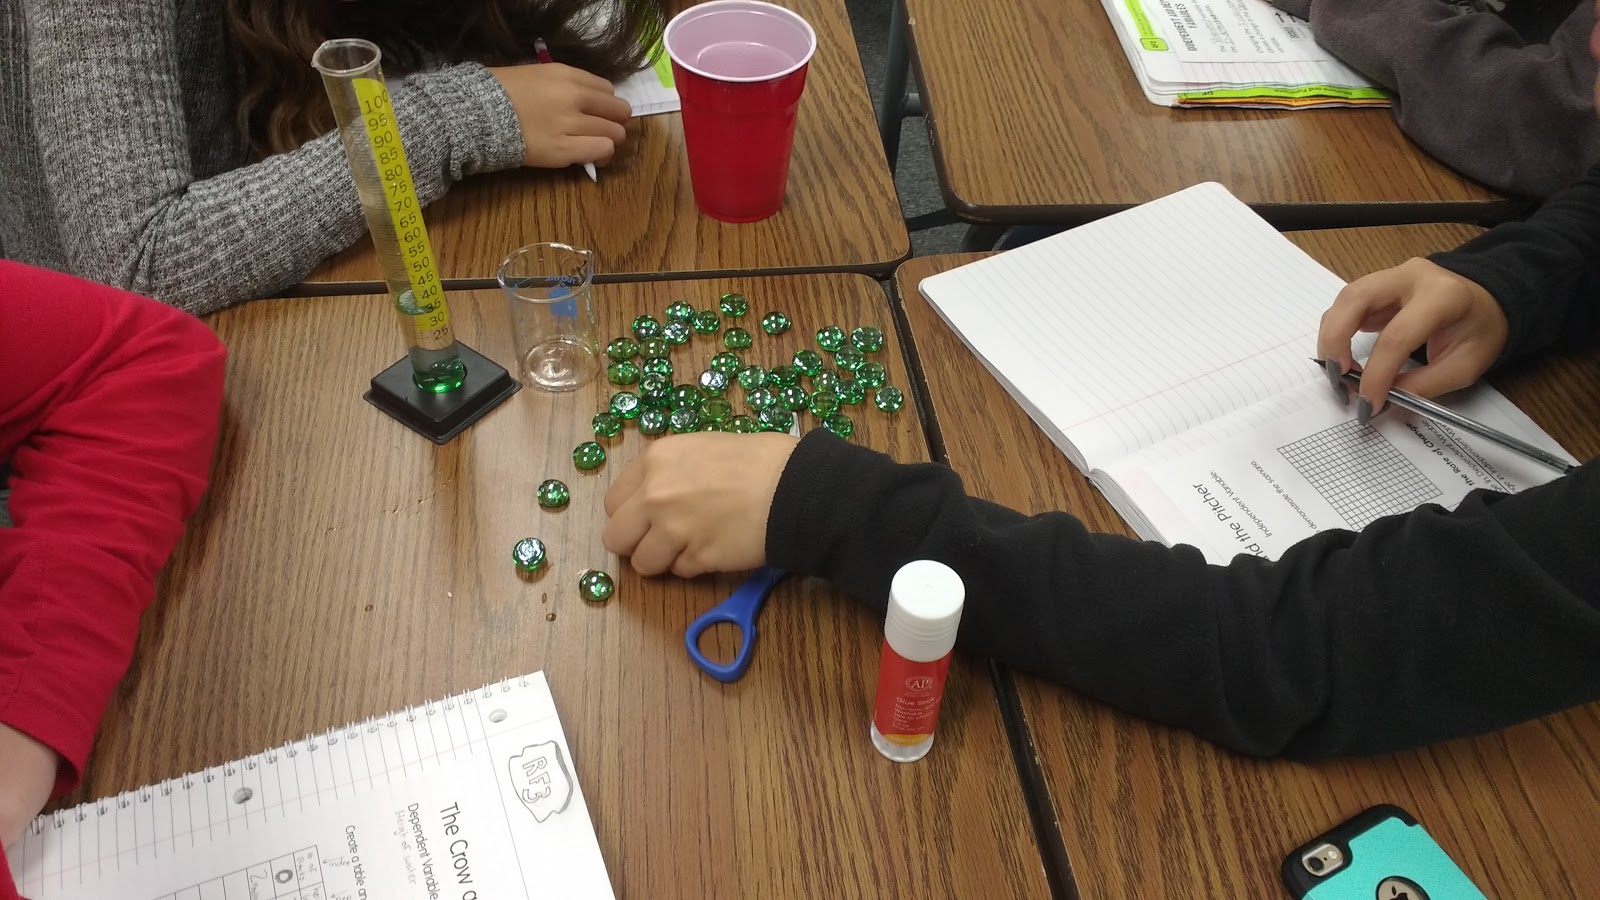
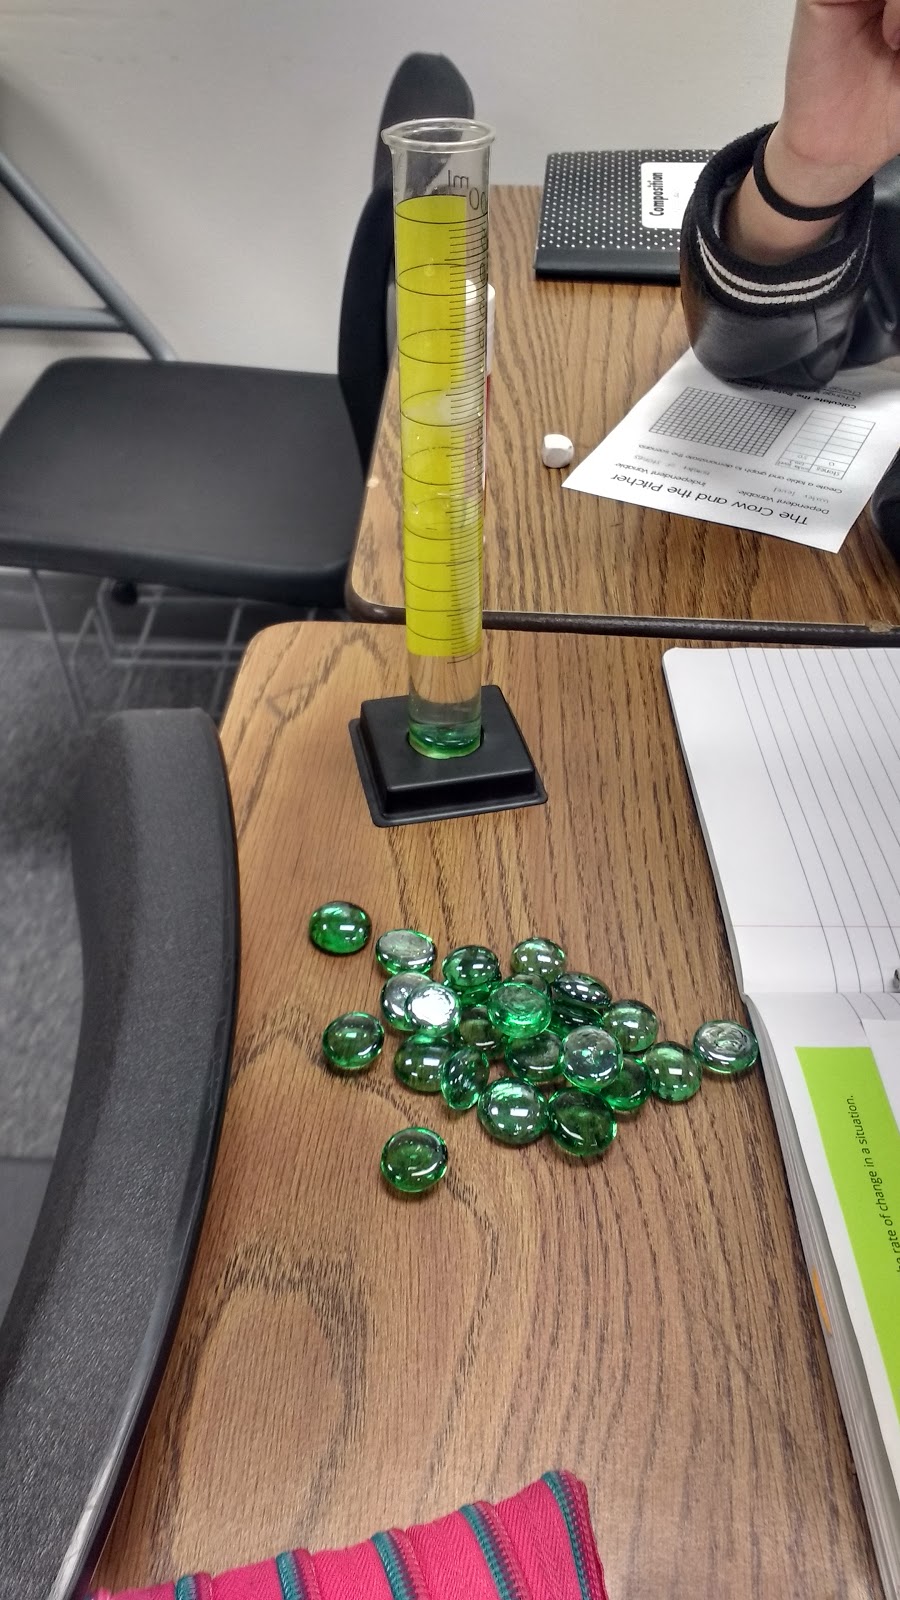
I asked my students to work in groups of 2 or 3 for this activity. Groups of 2 work best, but I didn’t have enough graduated cylinders to have all of my students work in groups of 2.
I did find out that my grant for measuring tools got funded, so I’ll soon have lots more graduated cylinders and beakers in my classroom!!!
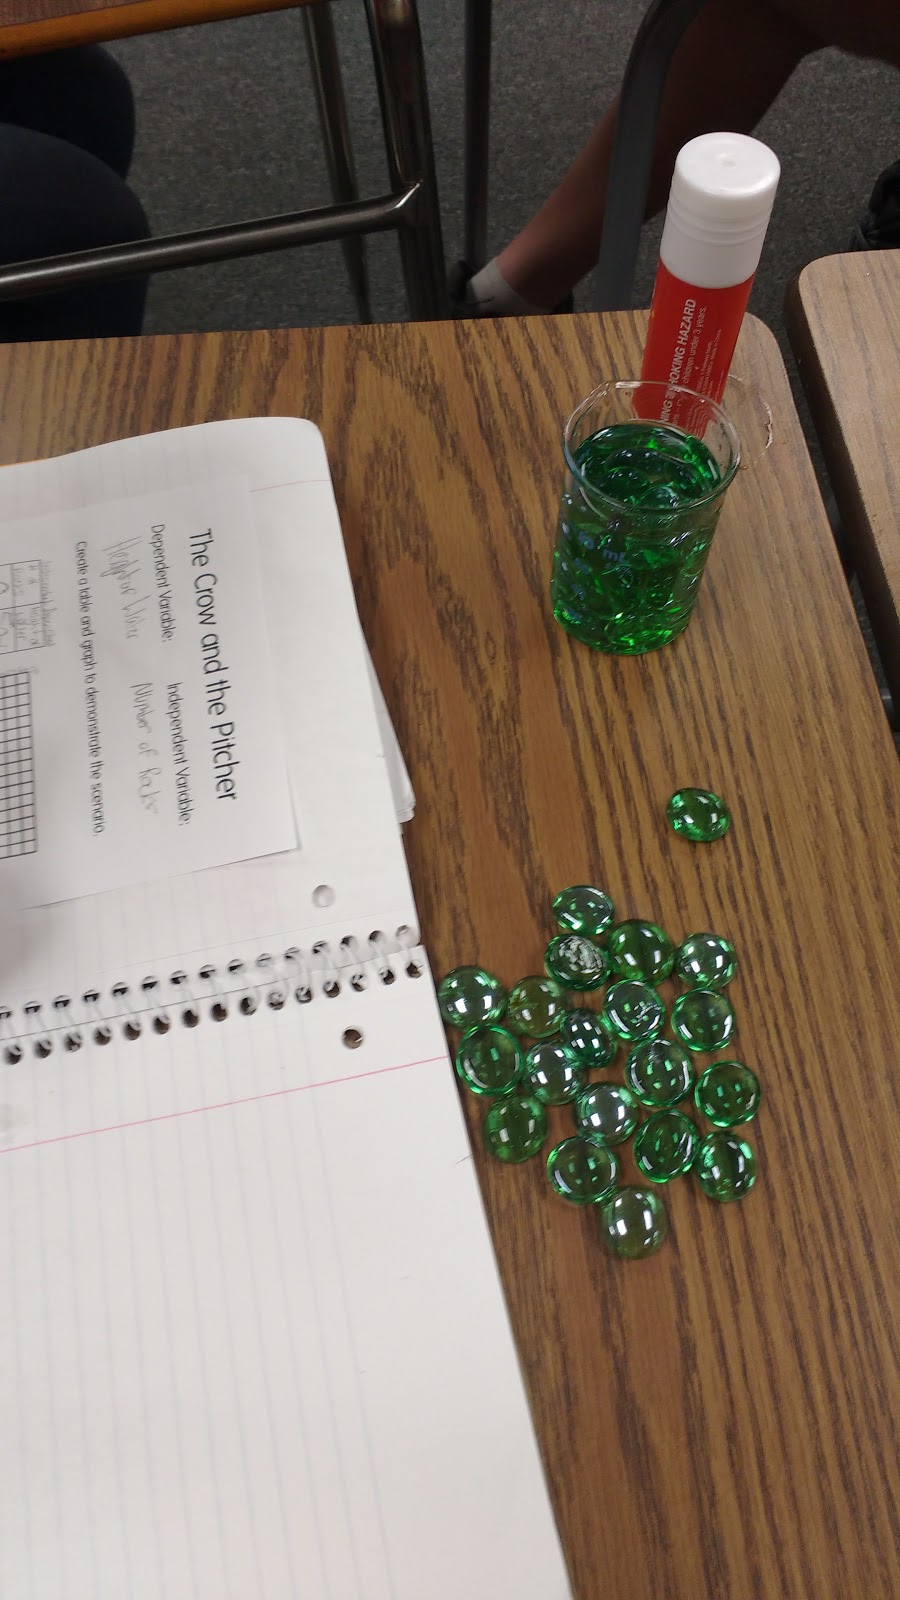
Special thanks to my husband for loaning us the glass stones we used for this activity. He may not realize he did so, but he did loan them to me for the mini metric olympics activity.
I just haven’t returned them yet. 😉 The best/cheapest place to buy these stones is in the craft section at Dollar Tree.
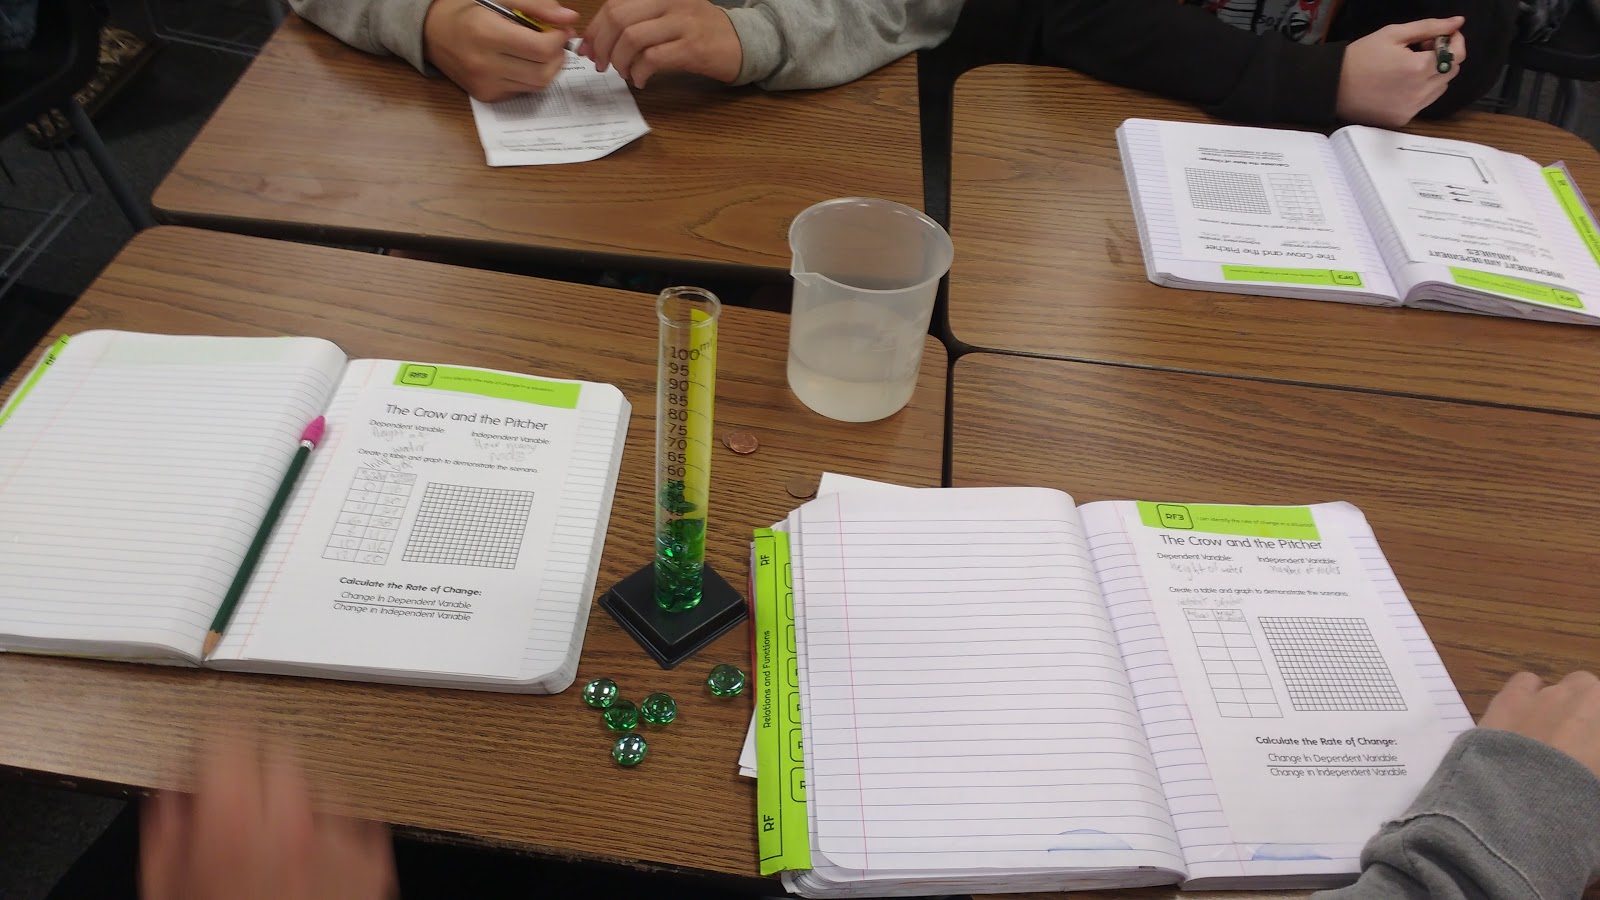
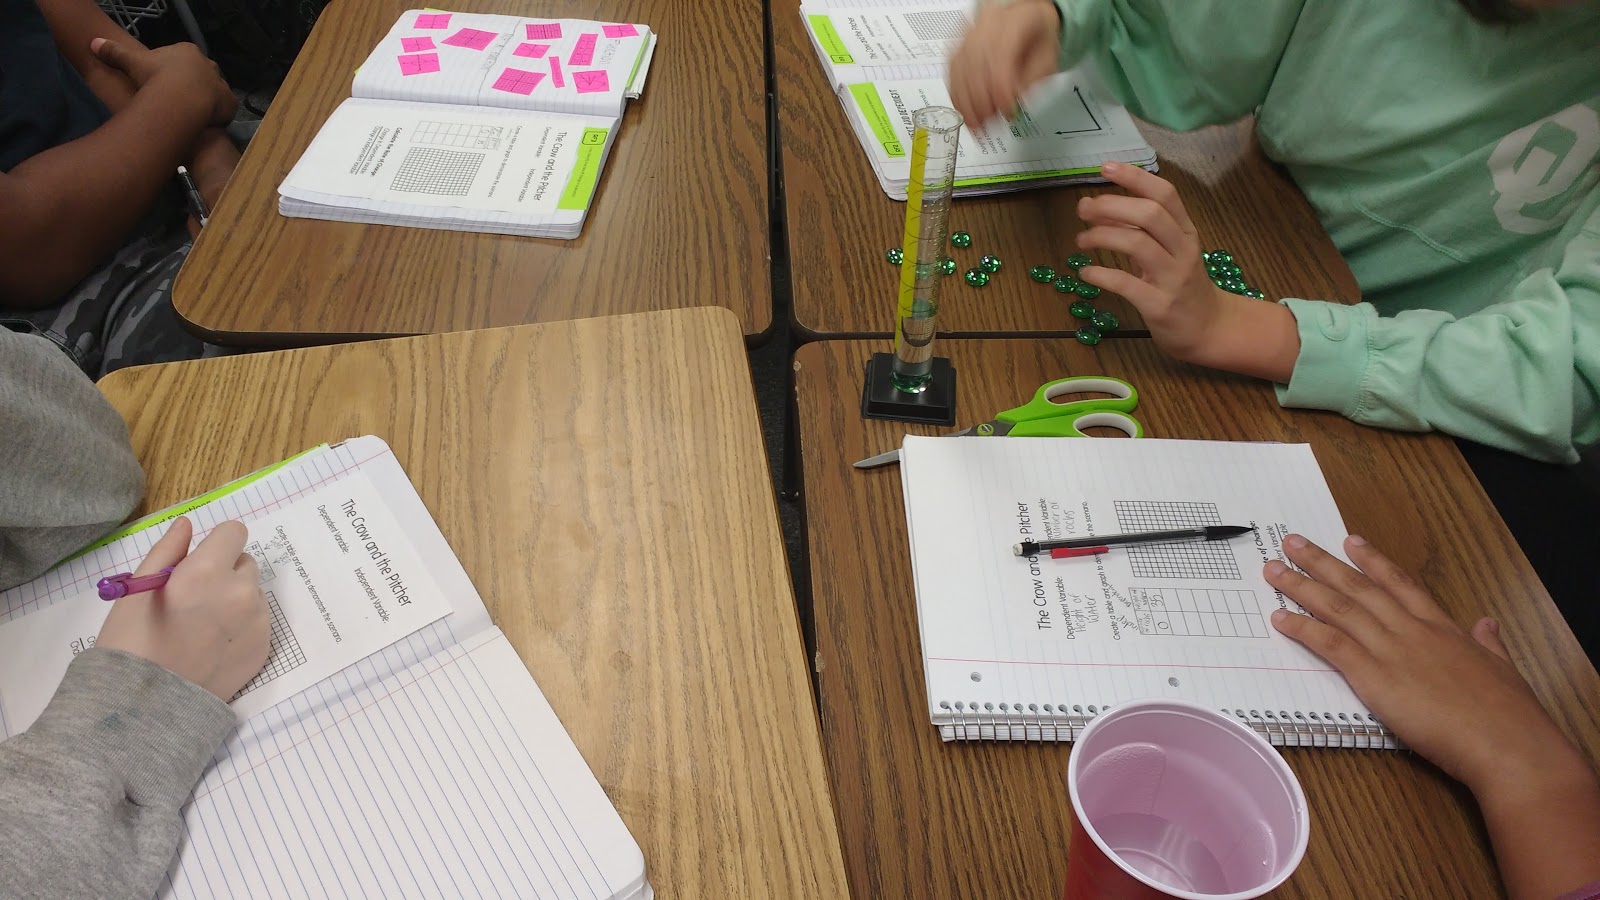
Students were given this recording sheet:
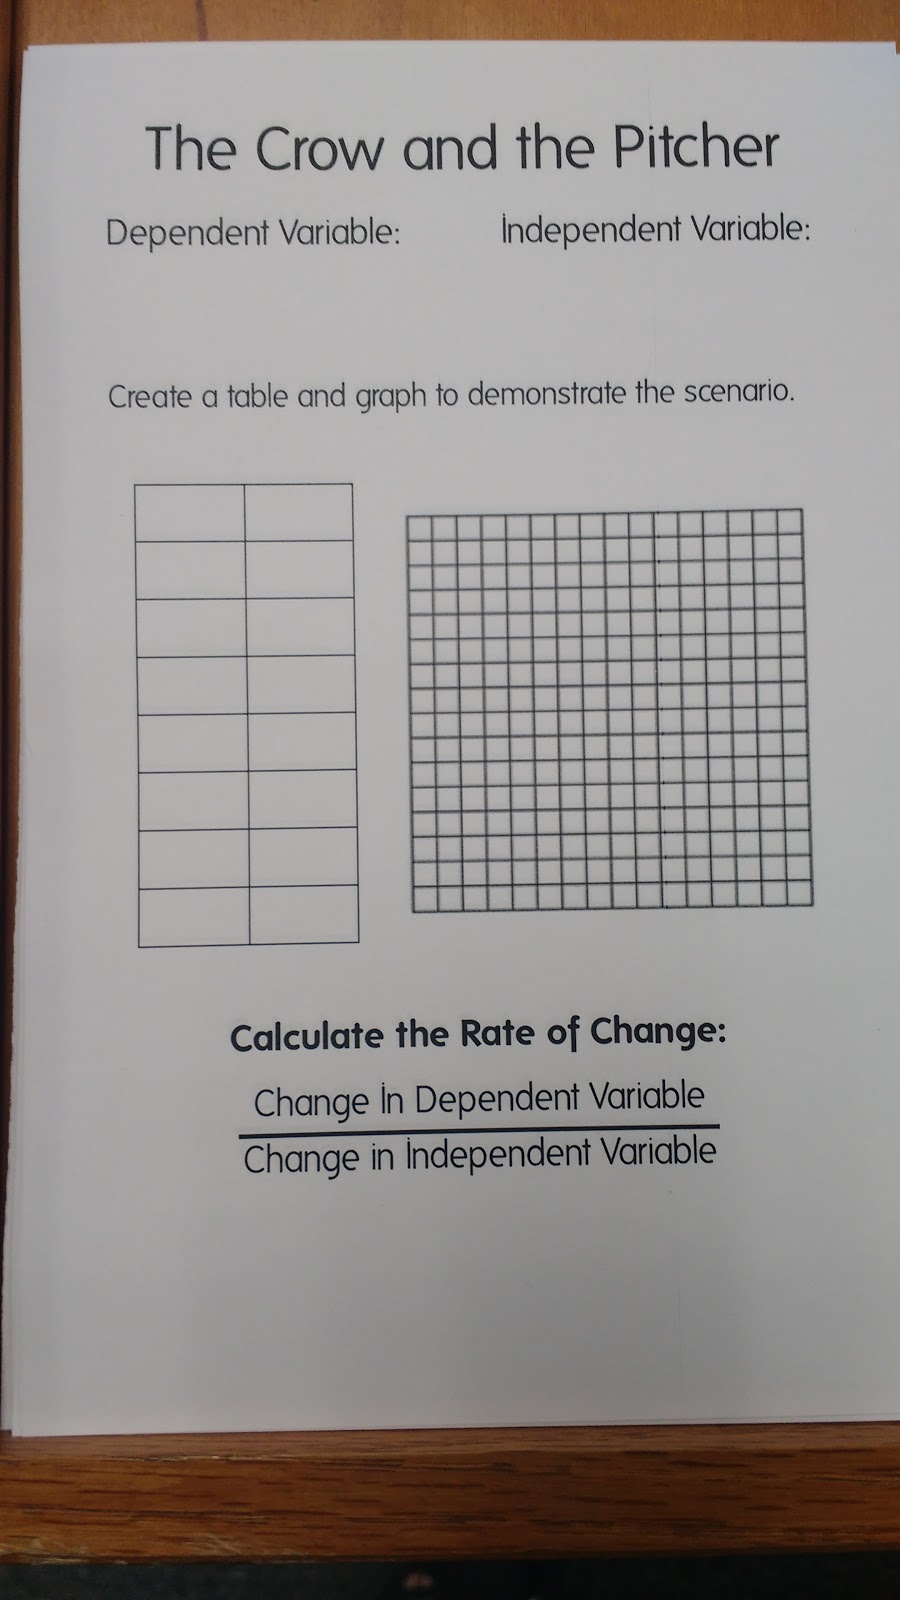
We had a lively discussion about what the dependent and independent variable would be in this situation. Eventually, we settled on height of water (in mL) as the dependent variable and number of stones as the independent variable.
I instructed them that the independent variable should always go first in the table. So, we put the headings on our table.
It took a bit for my students to realize that we should probably start with 0 stones. In retrospect, I’m not sure if I should have intentionally sent them down this path.
Maybe I should have let them start with 1 stone like many of them suggested.
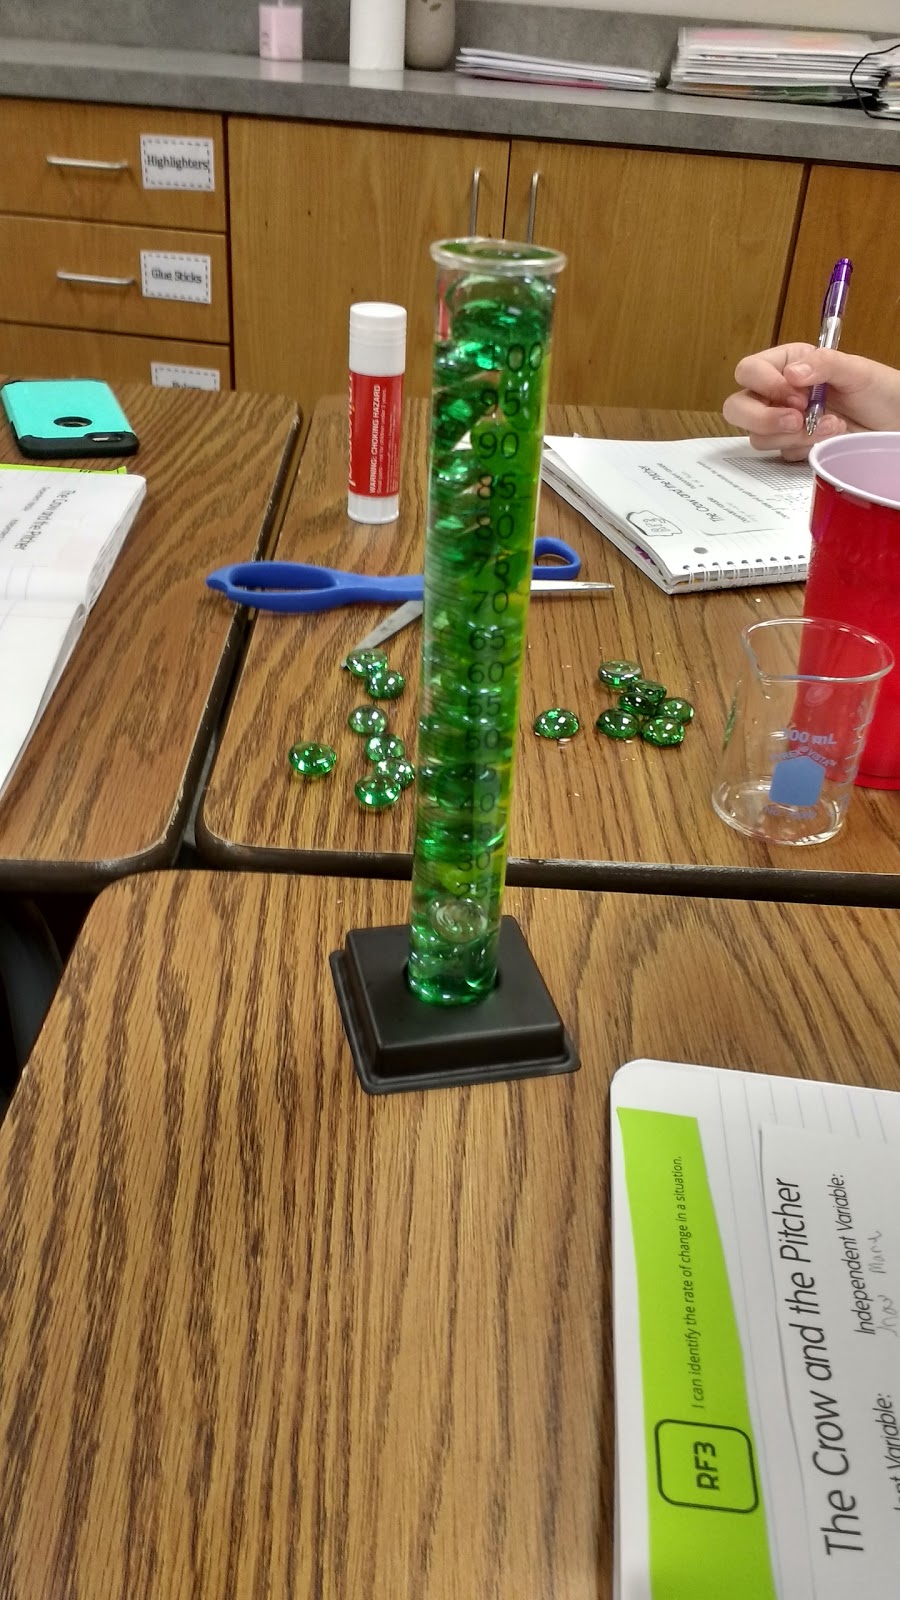
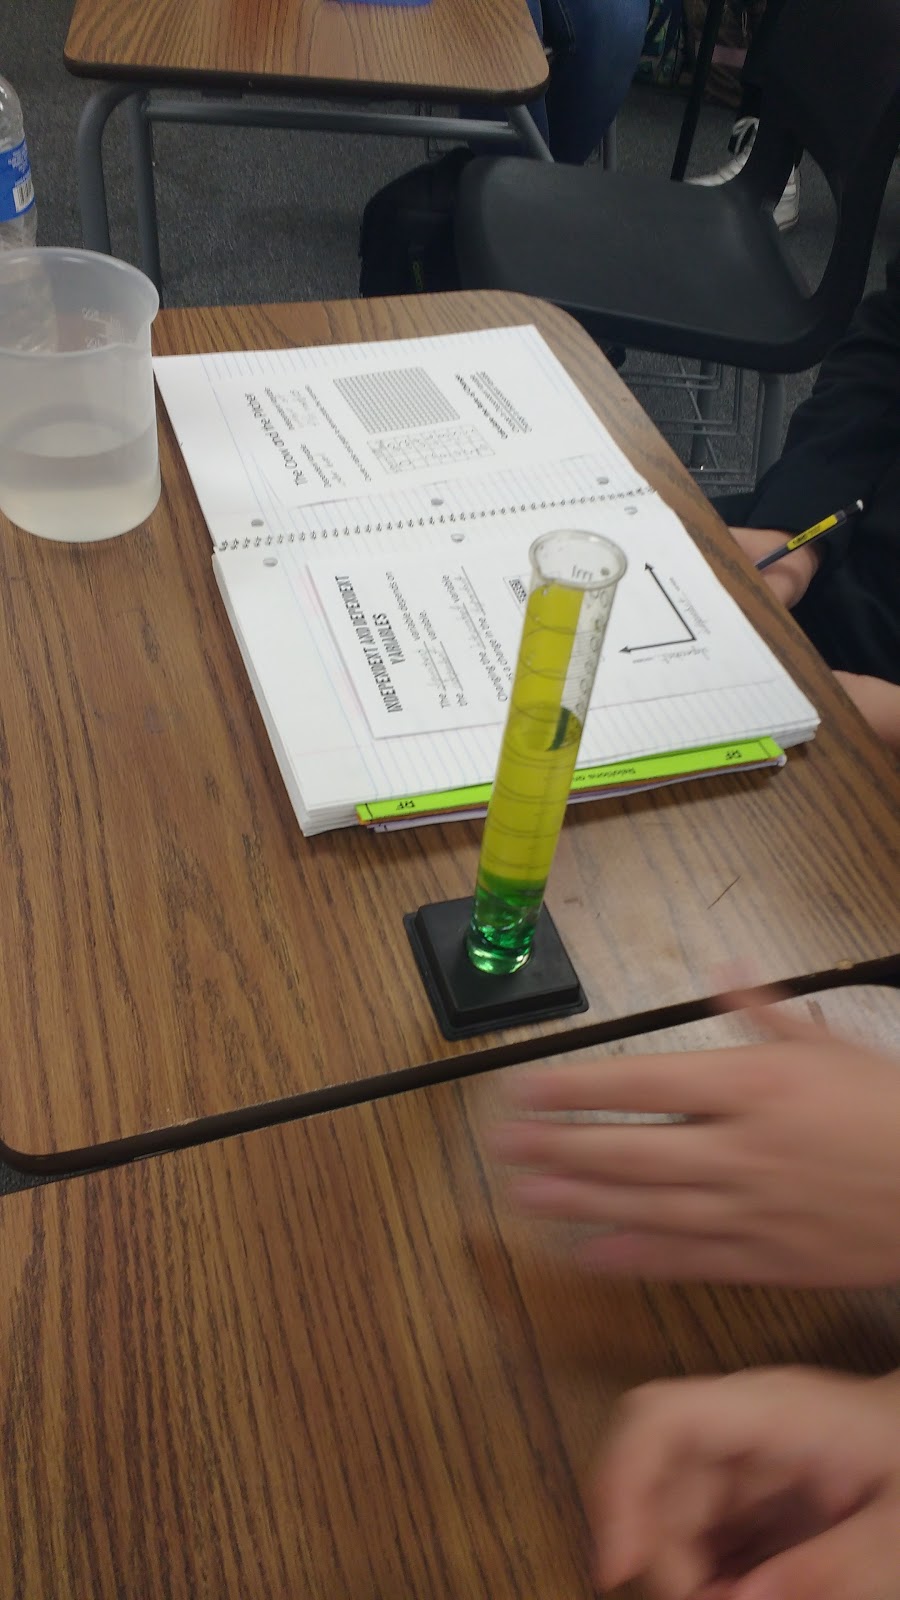
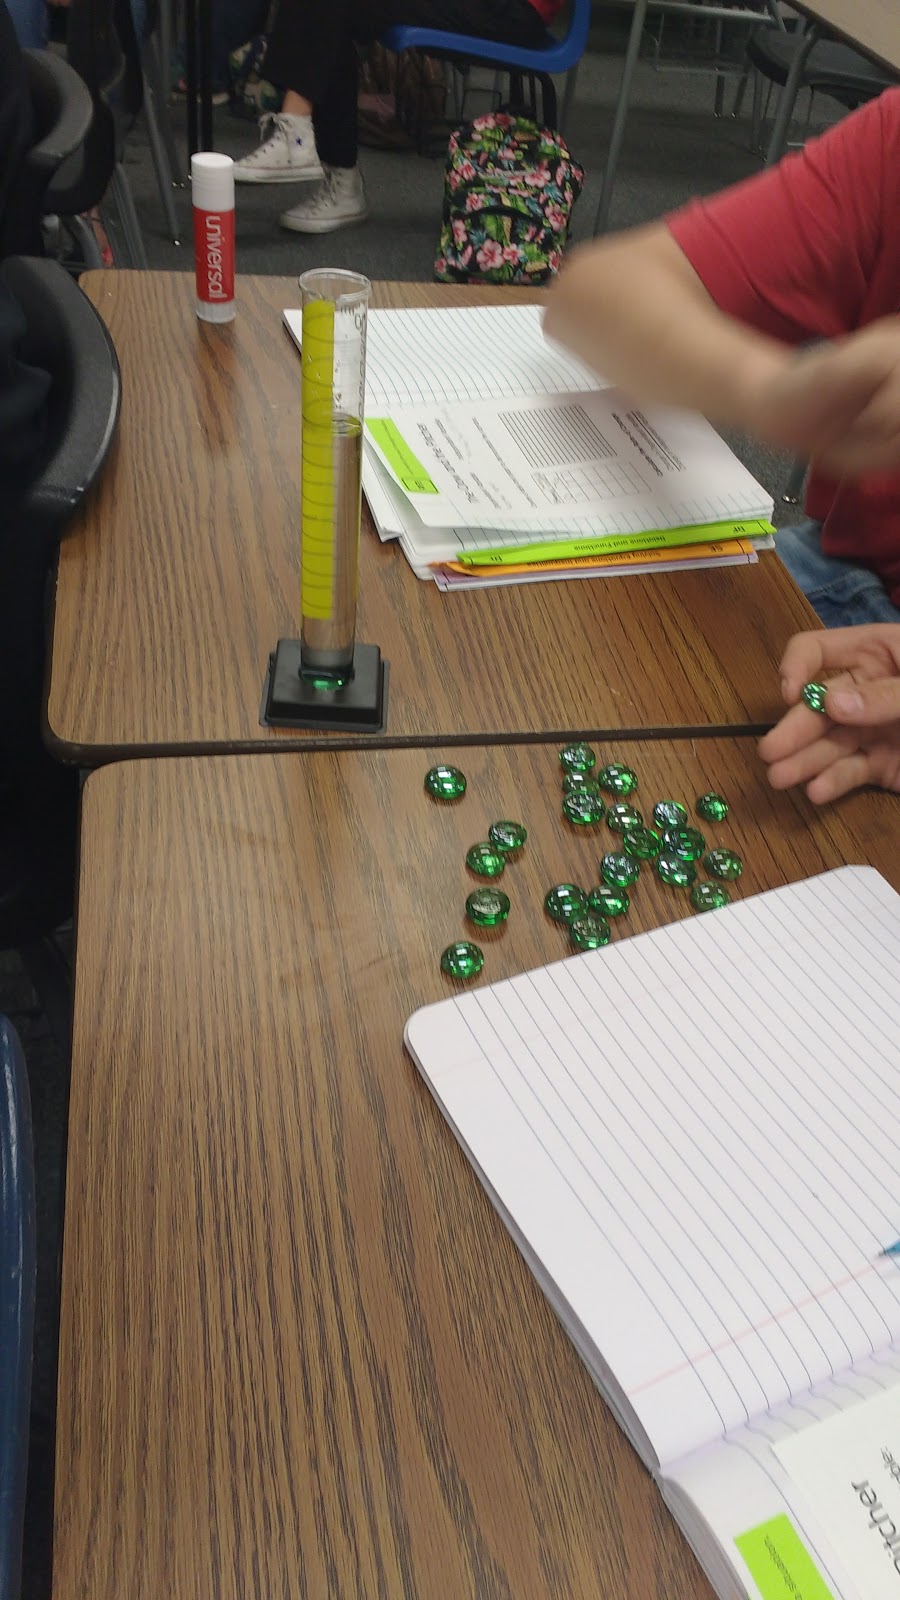
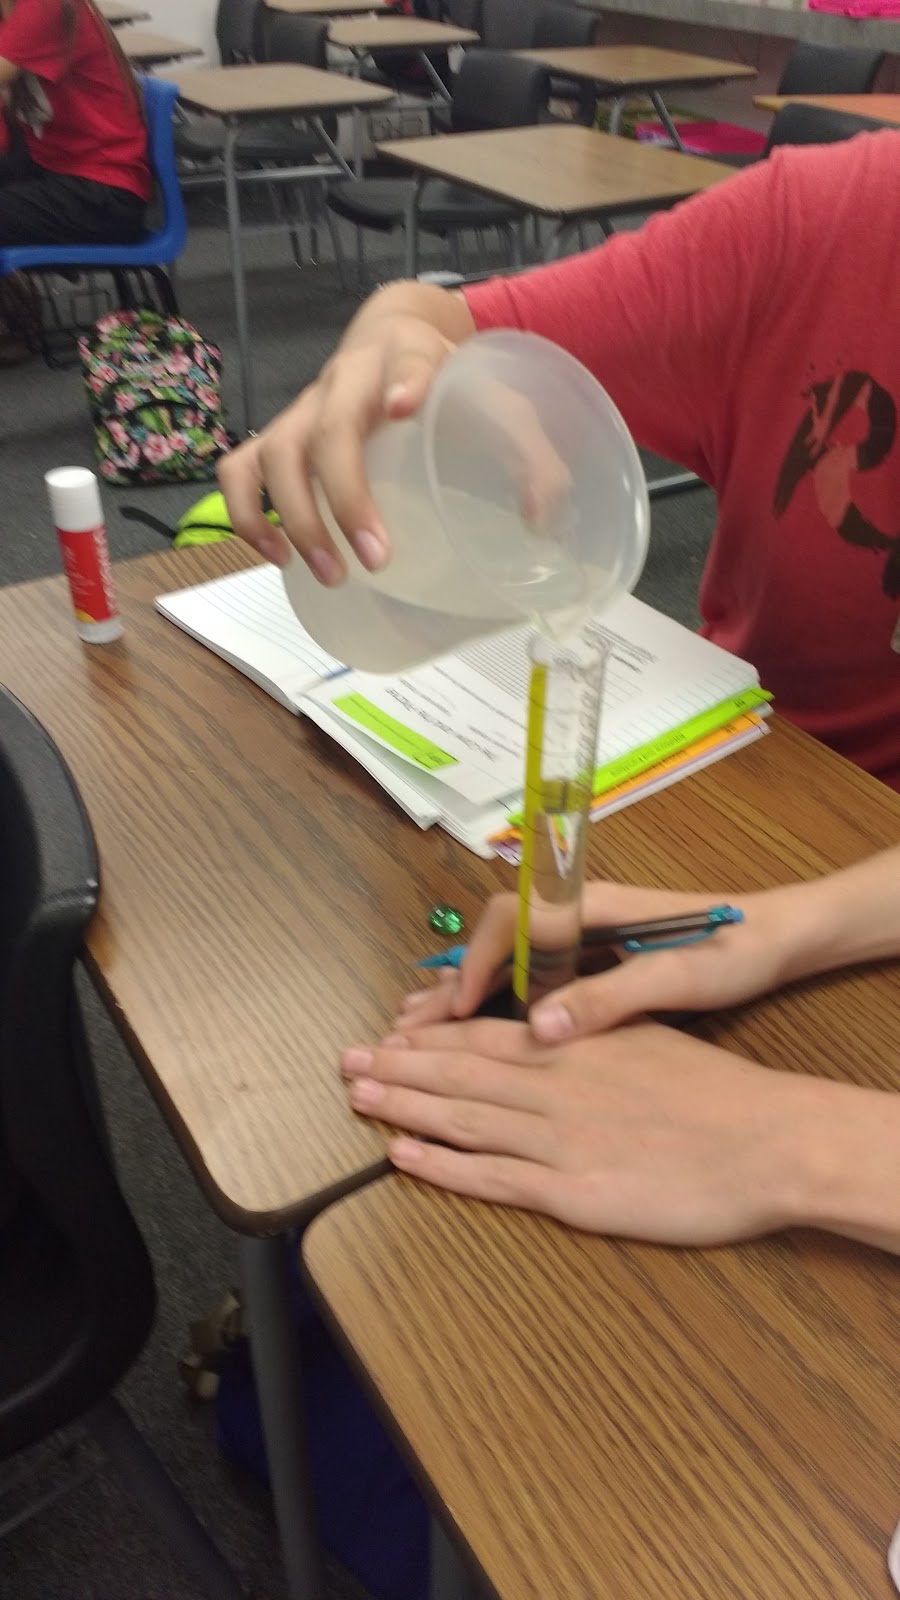
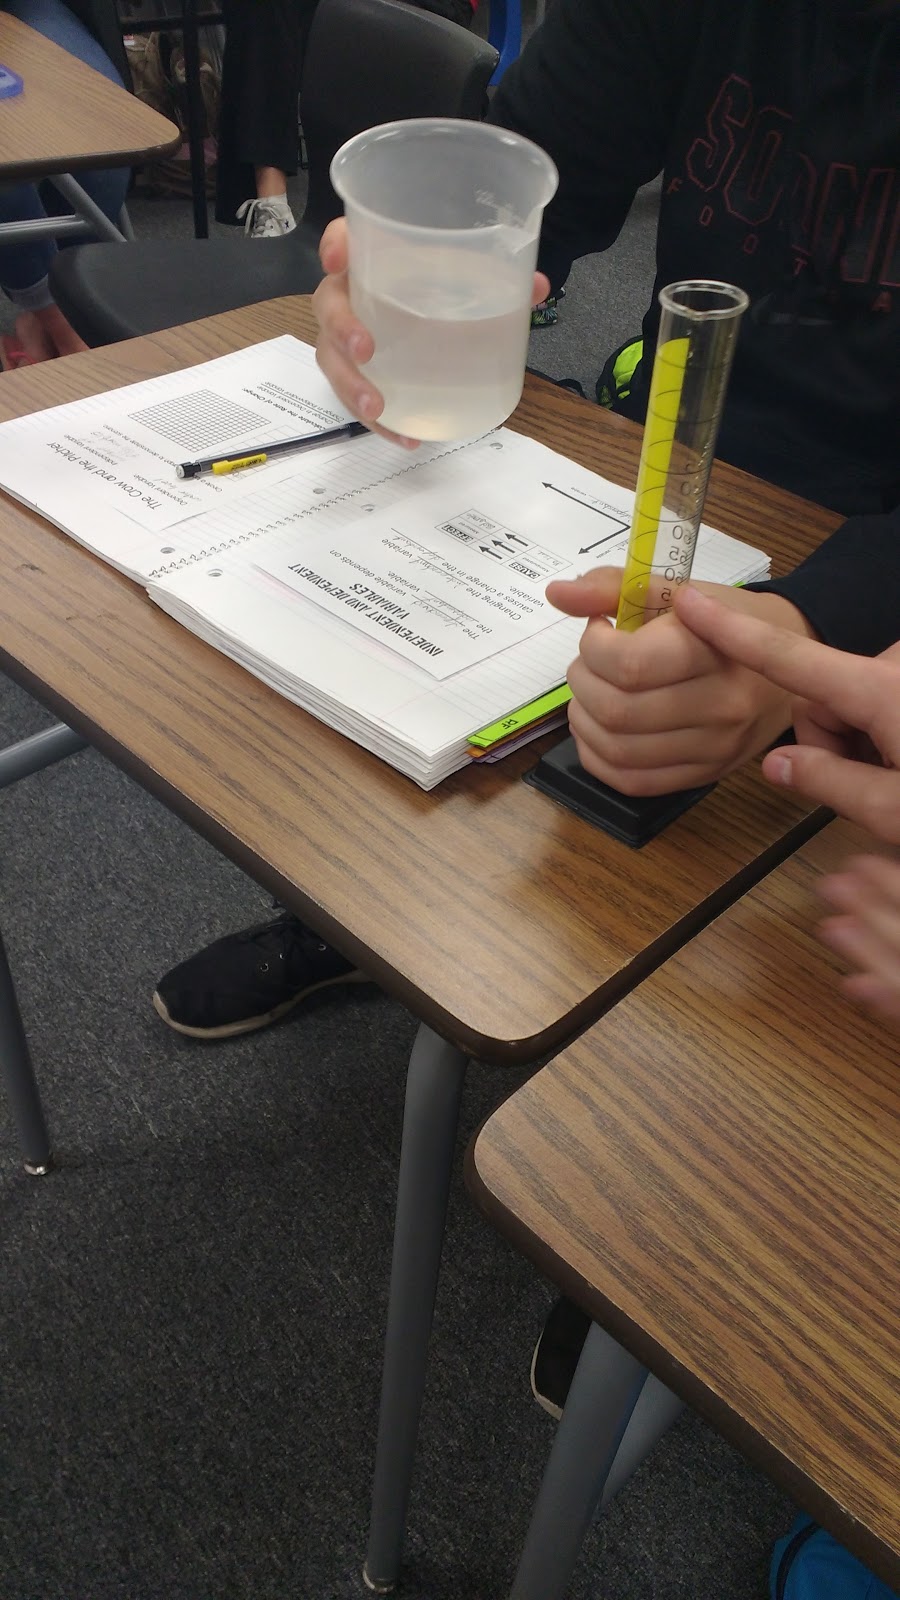
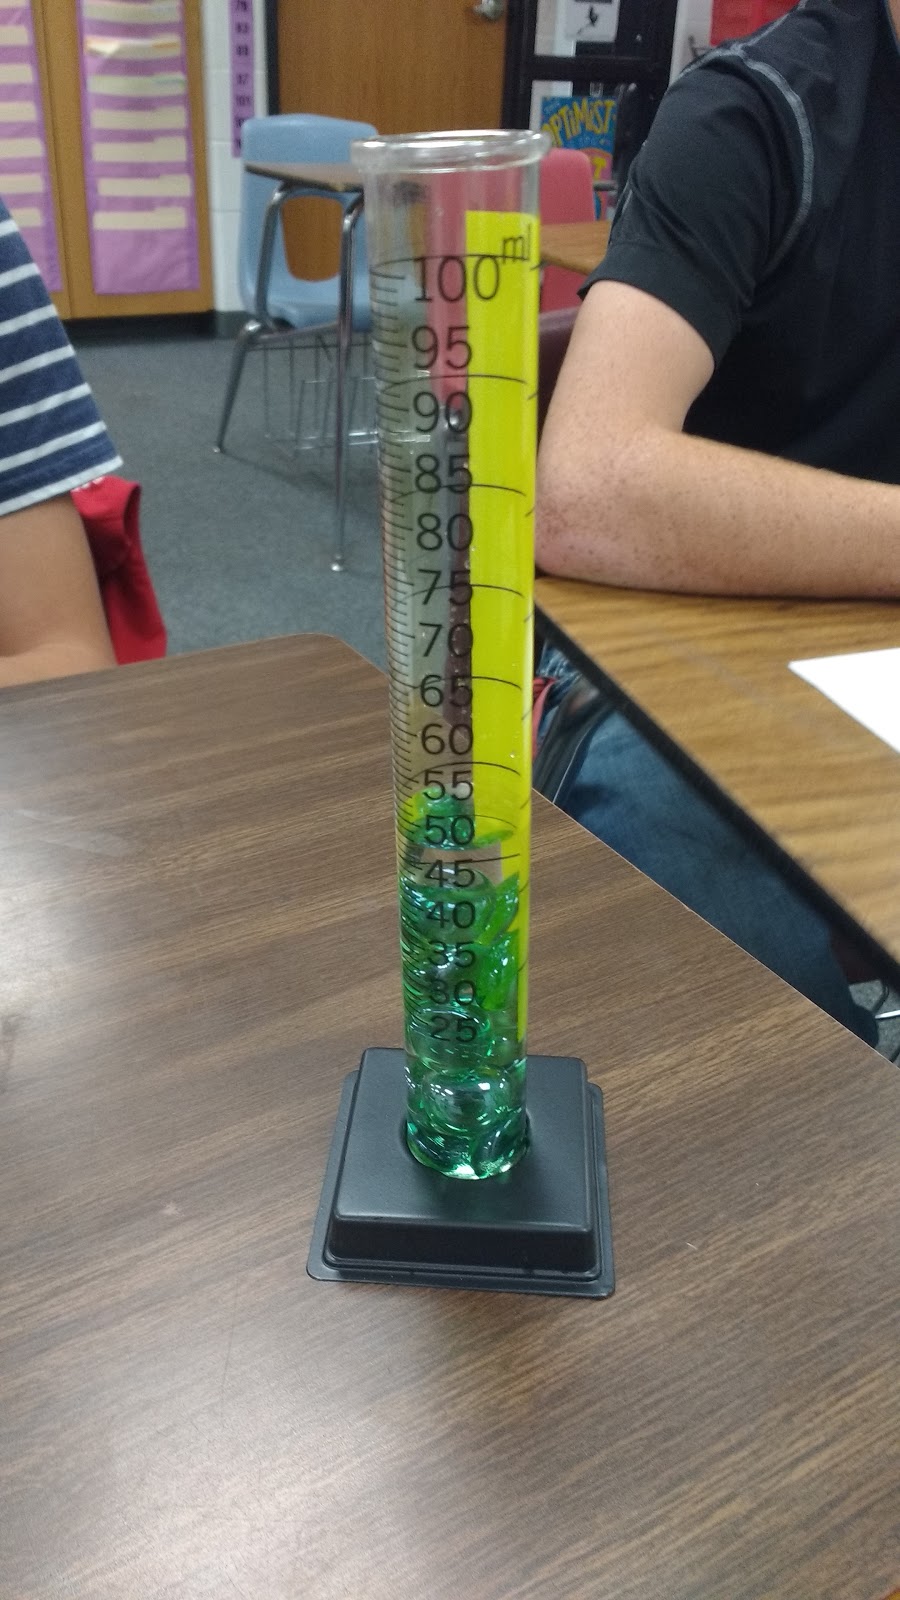
Each group chose their own volume of water to start with. Some groups used 100 mL graduated cylinders. Other groups used 100 mL glass beakers.
The beakers only had markings every 20 mL, so this made data collection a bit trickier. You have to work with what you’ve got, though!
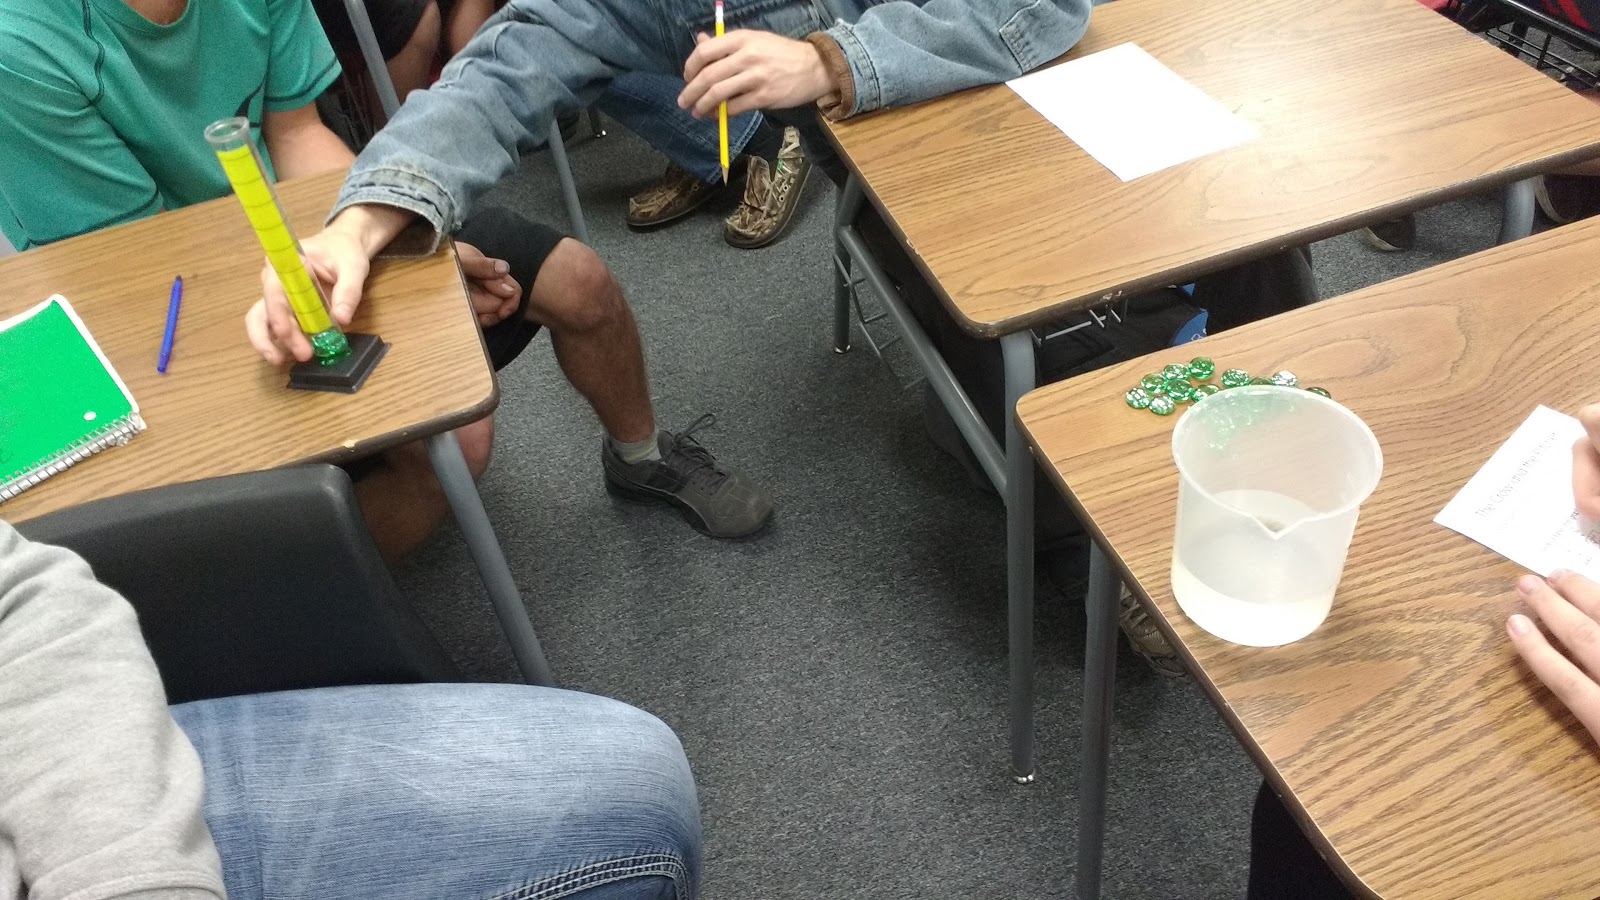
As they dropped each stone in the beaker or graduated cylinder, they added a data point to their table. Some students chose to add stones one at a time.
Other students chose to add multiple stones at a time. I let them do it however they chose in the hopes that it
Eventually, they either ran out of lines in the table, or adding additional stones kept the water level from rising any more.
At this point, we discussed how to take our table and turn it into a graph.
The only guidance I gave students was that the independent variable is graphed on the x-axis and the dependent variable is graphed on the y-axis.
There was lots of discussion between students about how they should number the x-axis and y-axis. Different students had to do this differently because some used a much greater number of stones than other students!
As students began graphing their results, many realized that the points made a line!
The main goal of this activity was to introduce students to the concept of rate of change.
I defined rate of change as the change in the dependent variable divided by the change in the independent variable. I showed students how they could draw arrows from one line of the table to the other to help them calculate the change in each variable.
Some students found in their group that the rate of change was 2 mL/stone. Other students found rates of change that varied from 1 mL/stone to 3 mL/stone.
We had a discussion as a class about how all of these rates of change could be true. Students pointed out that the stones we were using were NOT uniform in size.
Thus, we would not all arrive at the same rate of change.
I should have also had students calculate their average rate of change and compare it to the individual rates of change they found. Oh well, I’ll just have to remember to do that next time I teach this lesson!
I blogged about how I teach my students to find the rate of change from a table here.
I think my students really appreciated the hands-on nature of this lesson.
Love this activity. I did a version in Algebra 1 with marbles and one big cylinder, but I think that each pair of kids having their own cylinder is a much better option. I also like that your stones were not perfectly consistent. The marbles I used did have a nice, clean result, but I think that calculating average rate of change is a useful extension, without adding too many obstacles for students. You can see my reflections on this lesson here: http://17goldenfish.com/2015/12/05/the-thirsty-crow/ I also made a video while we were doing this, in case I find myself without the supplies on hand. Thanks, as always, for sharing!
You ROCK! Thank you very much for sharing.
i TEACH 2ND GRADE AND WE ARE READING THE FABLE FOR A DIFFERENT REASON: SEQUENCING. MY STUDENTS WILL CONDUCT YOUR ACTIVITY AND RECORD THEIR RESULTS AS A WRITING ASSIGNMENT. THANKS FOR SHARING.
Hi,
I think you went about this very well. It really ties in with slope-intercept form and creating tables and graphs from the given information. I think suggesting starting with 0 stones is a great way to talk about their "y-intercept" which is also called the starting point. This gives them a place to start with their graphs and will help them see the rate of change from the beginning. Excellent work and will be using this in my Algebra class