IQR vs Standard Deviation Card Sort Activity
My stats students had just finished up learning to find IQR by hand and by calculator and standard deviation by hand (I know – I’m evil!) and by calculator. It was now time to discuss when each is more appropriate to report.
I quickly decided to make a card sort for my students to complete.
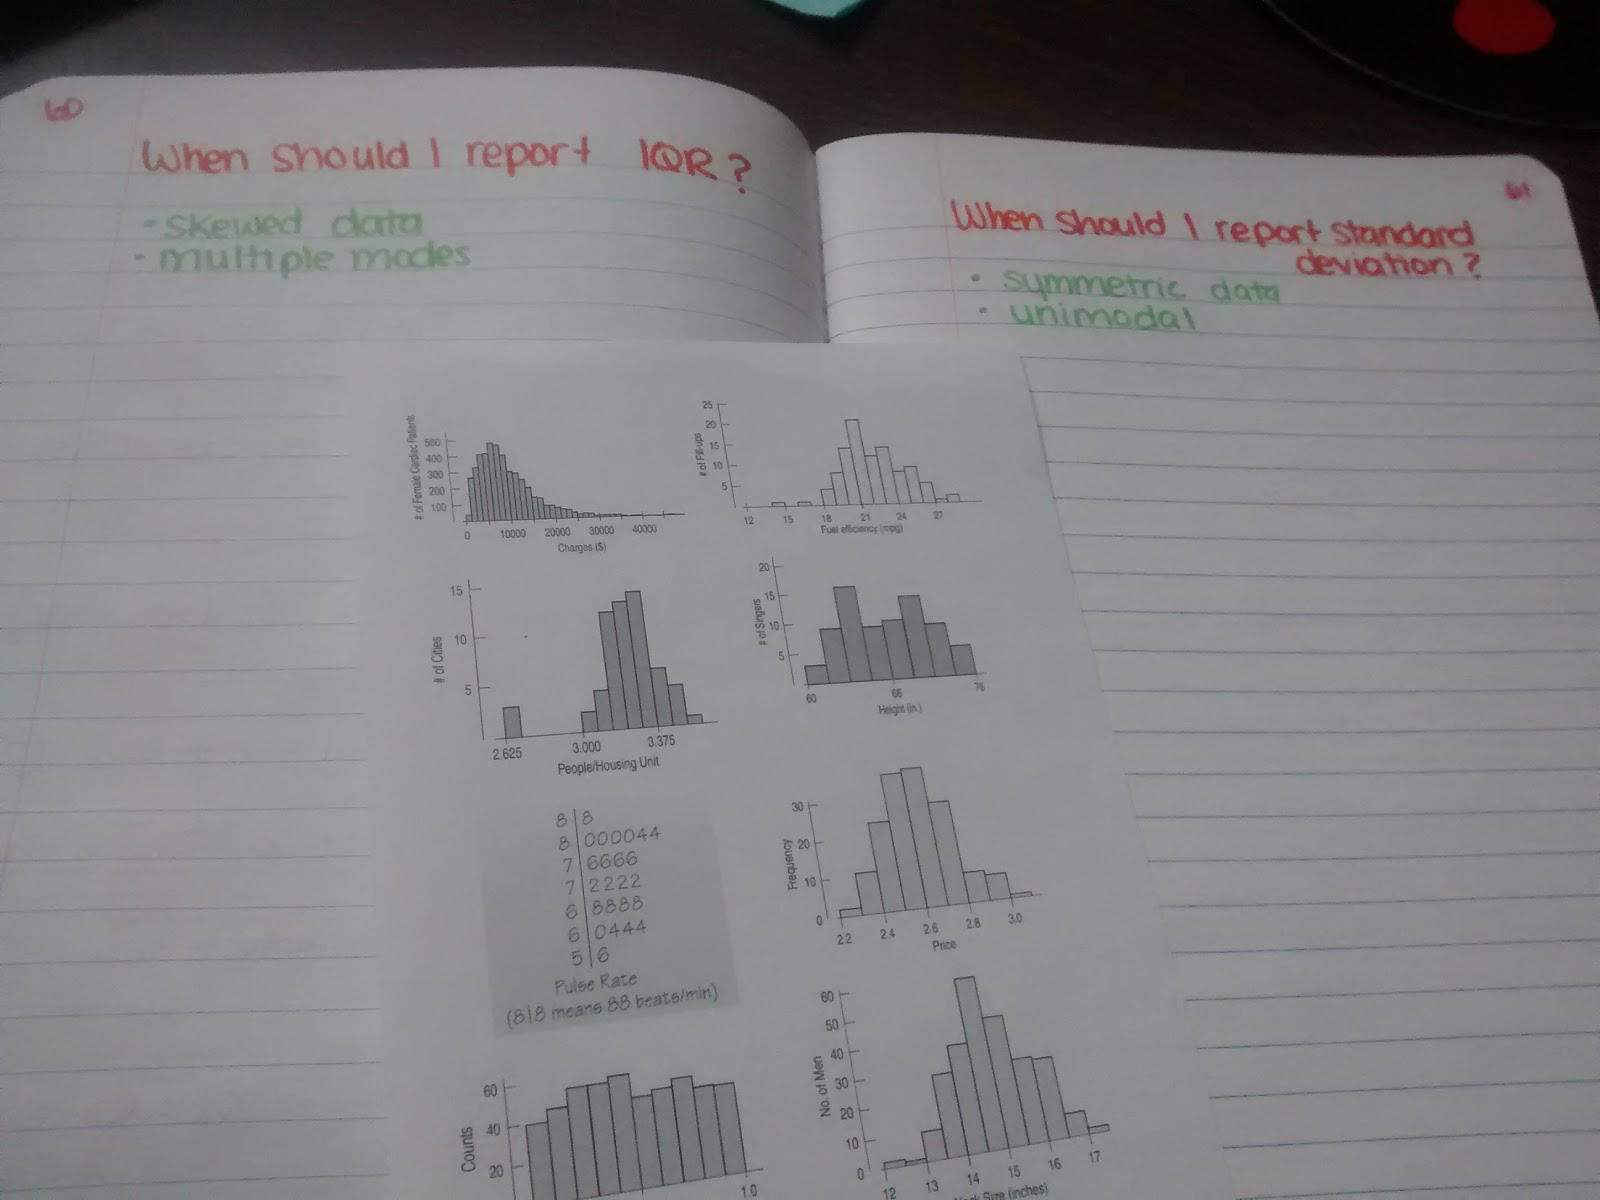
I don’t think I can post the file since the images are taken from Stats Modeling the World.
And, if I’m honest, I’m not entirely sure I have them sorted perfectly. Teaching stats definitely puts me outside my comfort zone. Anything that’s not algebra is outside of my comfort zone.
This is my fourth year teaching algebra 5 out of 6 periods a day. Algebra and I are good friends. Stats is just a visitor that stops in for an hour a day every other year. We’ve still got a long way to go to become well acquainted!
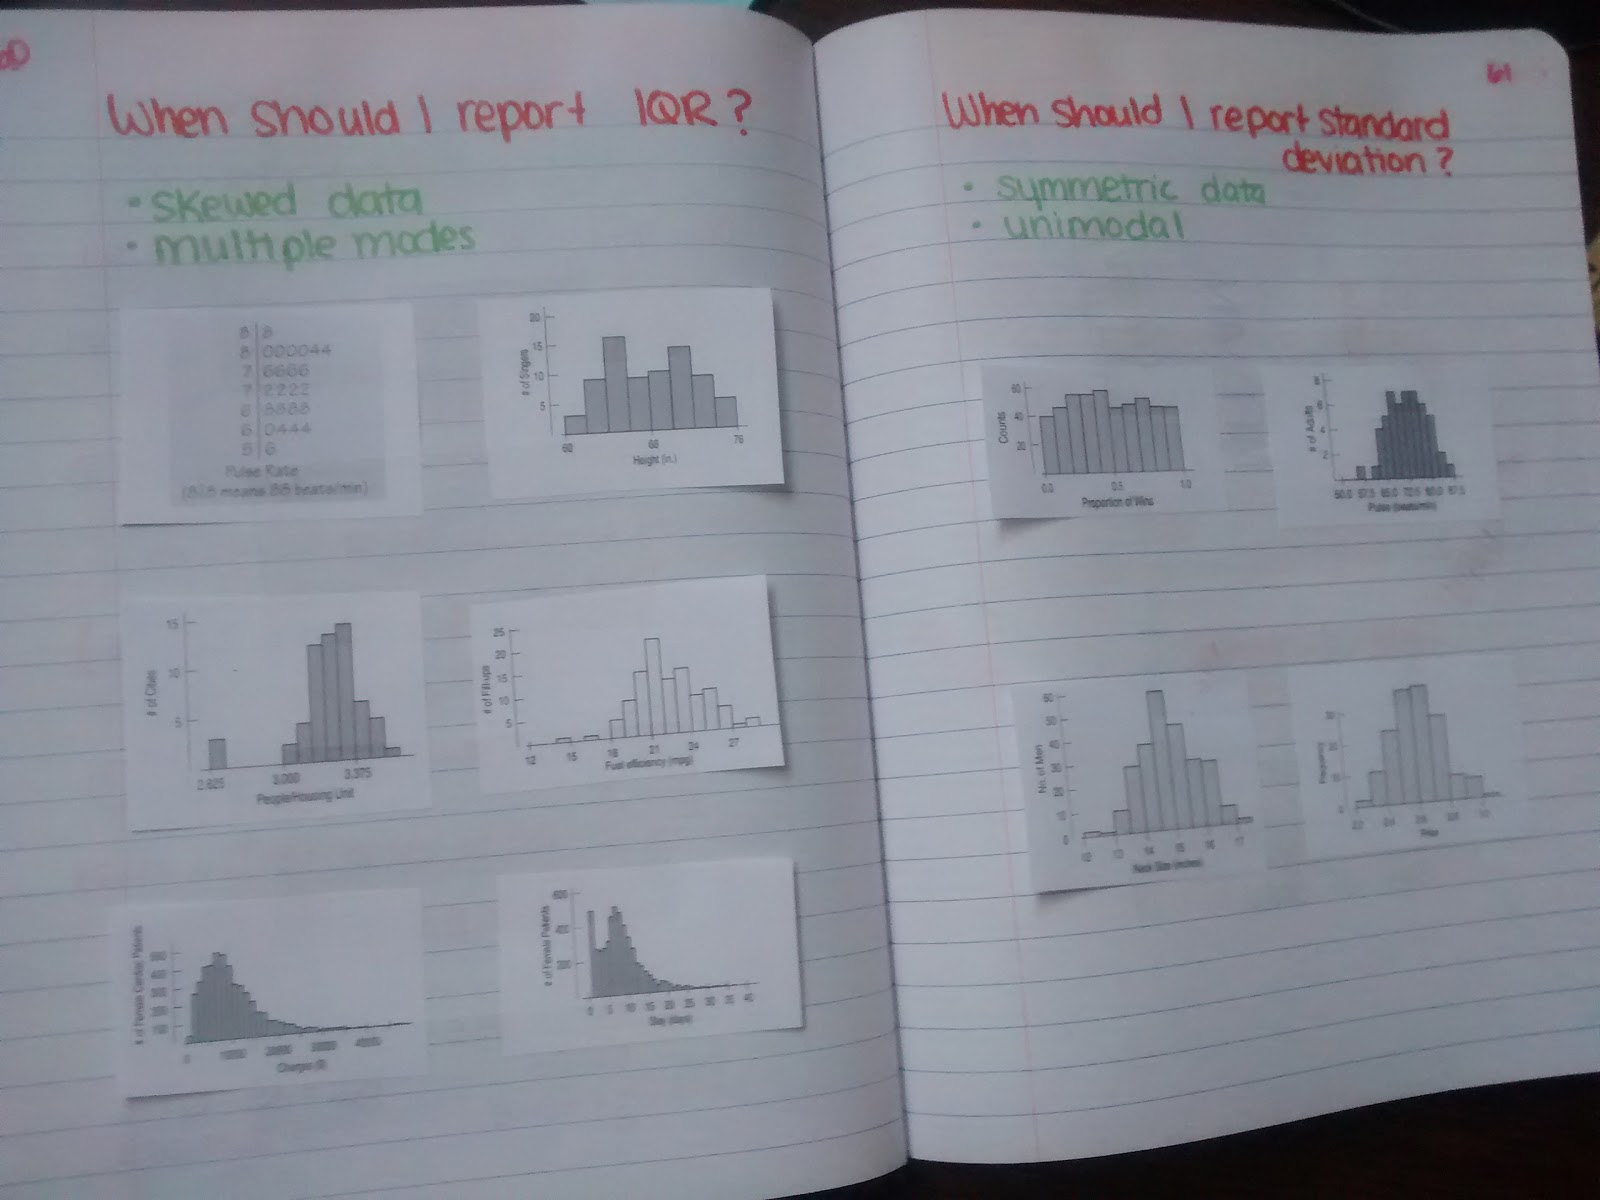
It was awesome to eavesdrop on my students’ conversations as they worked to sort these graphs. I have a special place in my heart for card sorts. <3

It's my first year teaching AP Stats. I use The Practice of Statistics but have copies of the book you use as well as others for resources. I'm about to start linear regressions since I have to get through the entire book by mid April in preparation for the test May 12. We didn't start until Sept 1 unlike other schools that start in August.
I'm not sure if I could handle the time crunch of an AP class! Hope this year is going well for you!