Candy Grab Lab for Linear Regression
This blog post contains Amazon affiliate links. As an Amazon Associate, I earn a small commission from qualifying purchases.
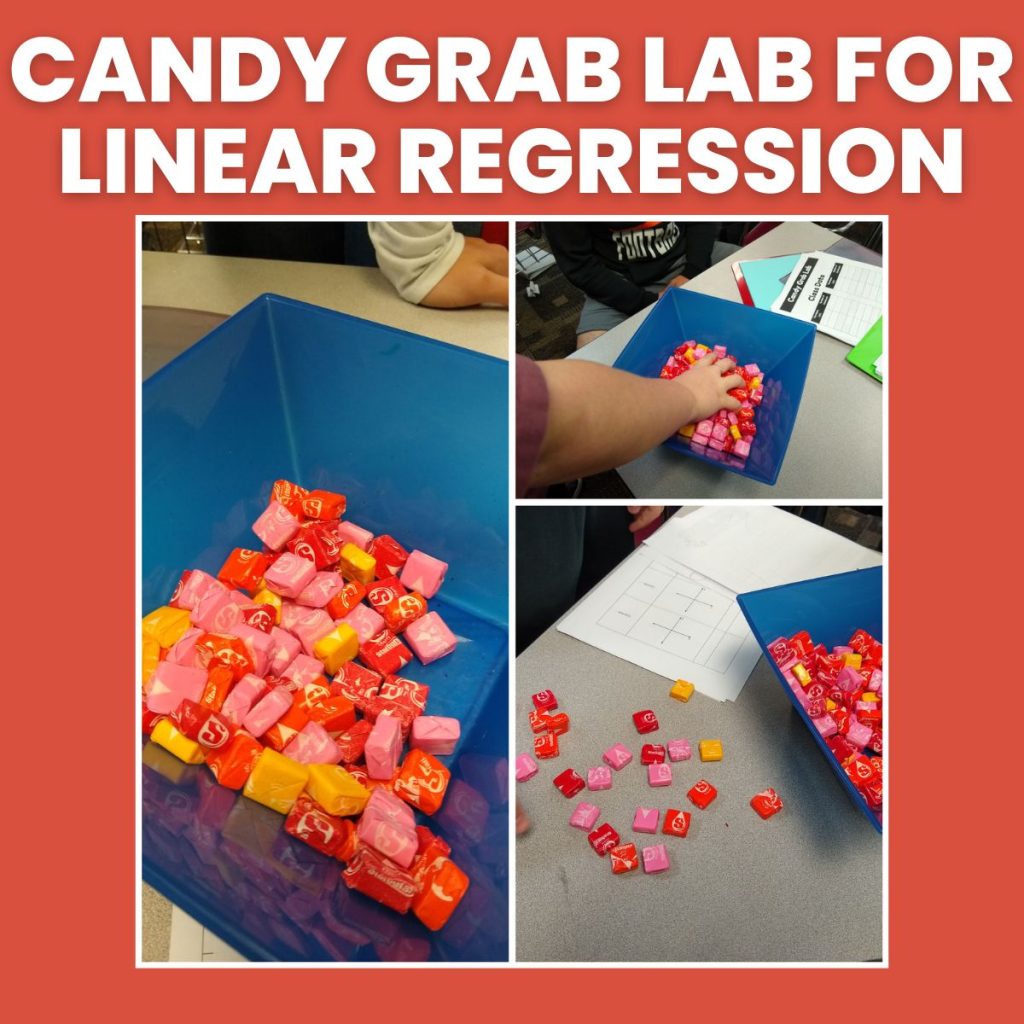
This Candy Grab Lab is one of my favorite ways to introduce students to the process of linear regression. In this activity, students determine if there is a mathematical relationship between a person’s handspan and the amount of candy they can grab at one time.
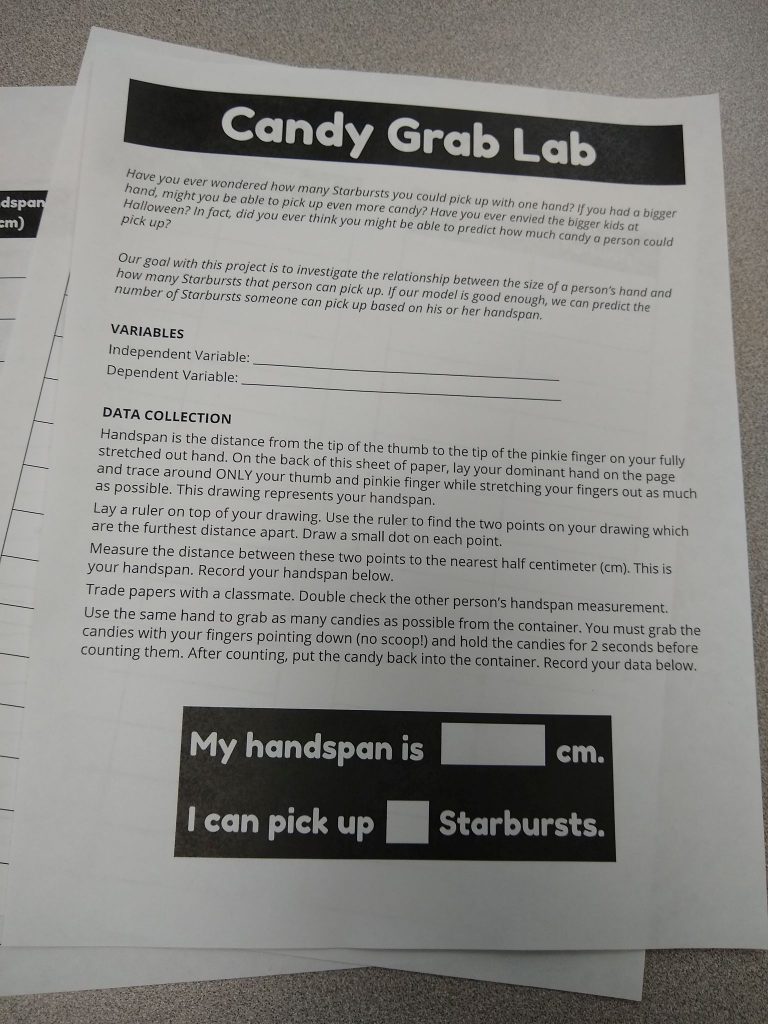
The first page of the Candy Grab Lab introduces students to students.
Have you ever wondered how many Starbursts you could pick up with one hand? If you had a bigger hand, might you be able to pick up even more candy? Have you ever envied the bigger kids at Halloween? In fact, did you ever think you might be able to predict how much candy a person could pick up?
Our goal with this project is to investigate the relationship between the size of a person’s hand and how many Starbursts that person can pick up. If our model is good enough, we can predict the number of Starbursts someone can pick up based on his or her handspan.
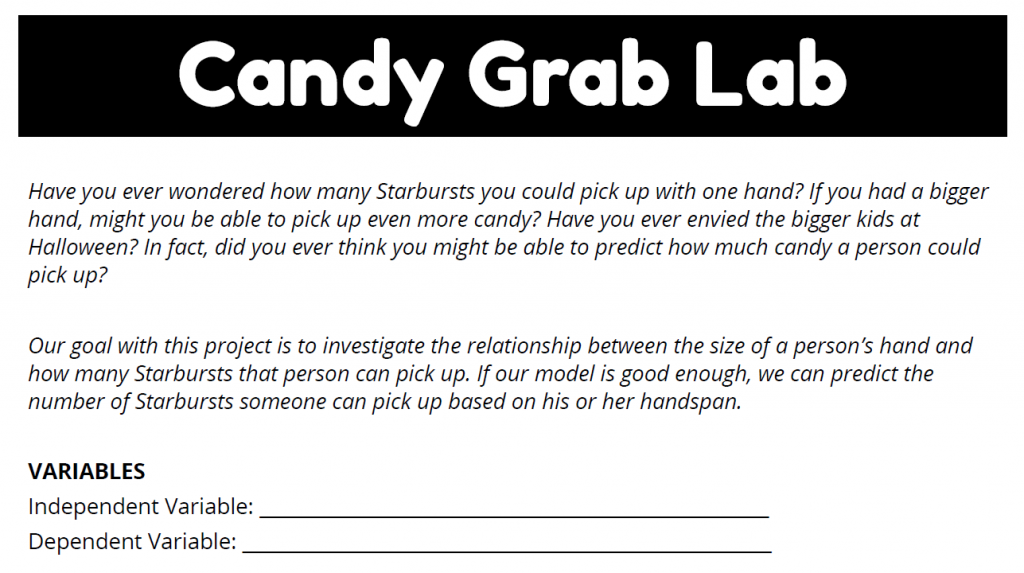
After introducing the scenario, students had to determine the independent and dependent variables in the scenario.
I gave my students some data collection guidelines to help them (hopefully) end up with reliable data. First, I defined handspan. Handspan is the distance from the tip of the thumb to the tip of the pinkie finger on your fully stretched out hand.
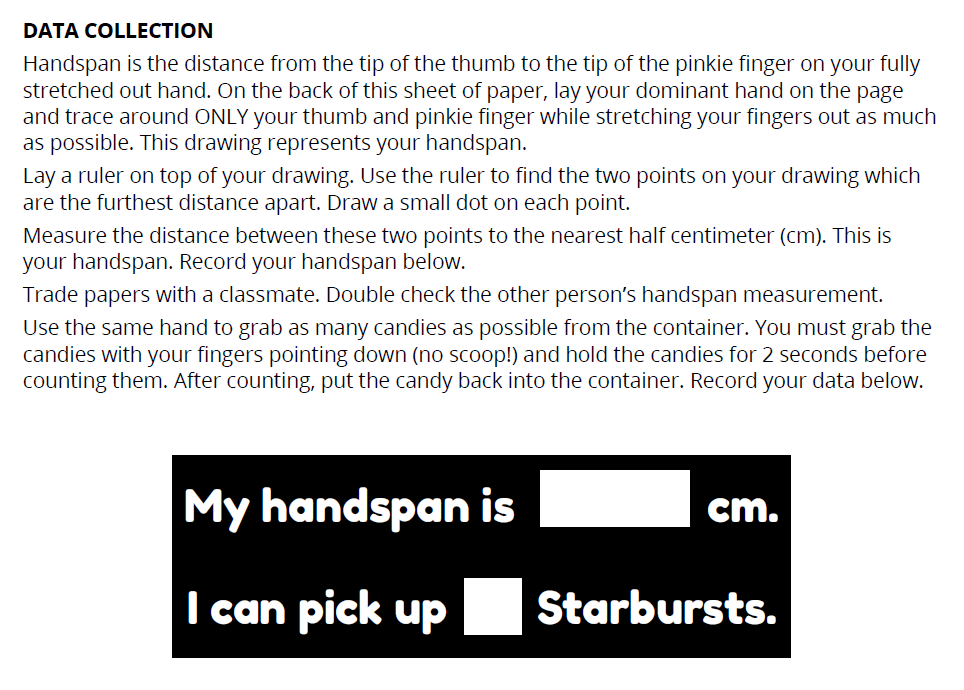
I had students flip their paper over and trace around their thumb and pinkie finger while stretching their fingers out as much as possible. They were able to measure this to determine their handspan.
I gave them specific instructions for measuring their handspan:
Lay a ruler on top of your drawing. Use the ruler to find the two points on your drawing which are the furthest distance apart. Draw a small dot on each point.
Measure the distance between these two points to the nearest half centimeter (cm). This is your handspan. Record your handspan below.
Trade papers with a classmate. Double check the other person’s handspan measurement.
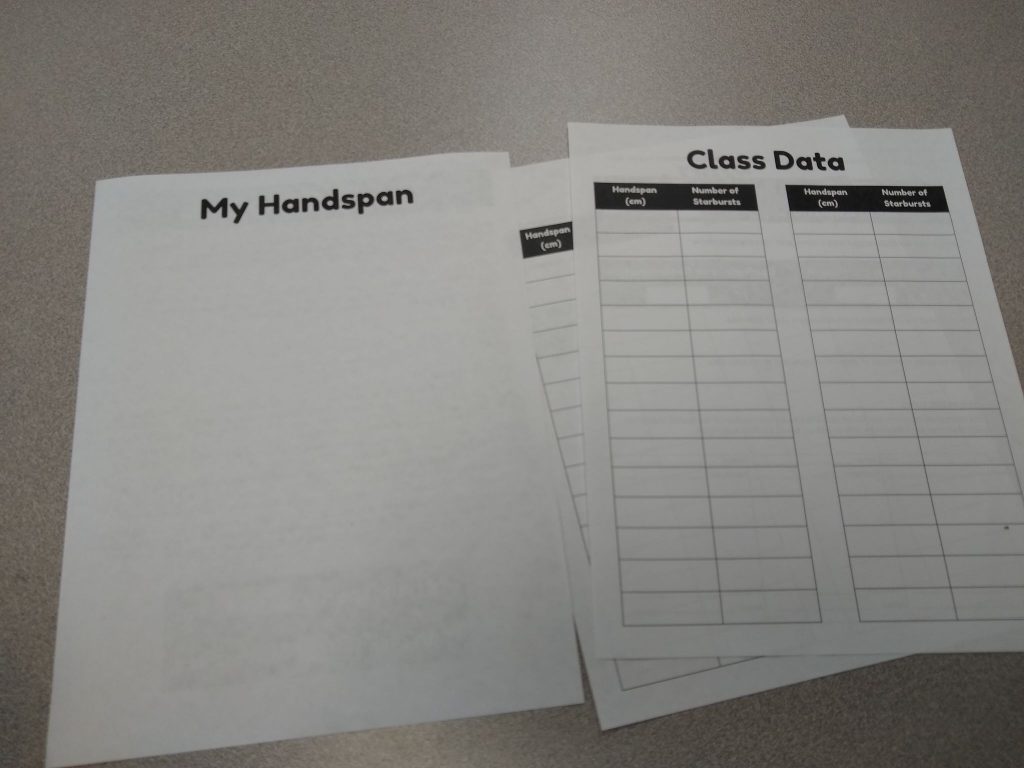
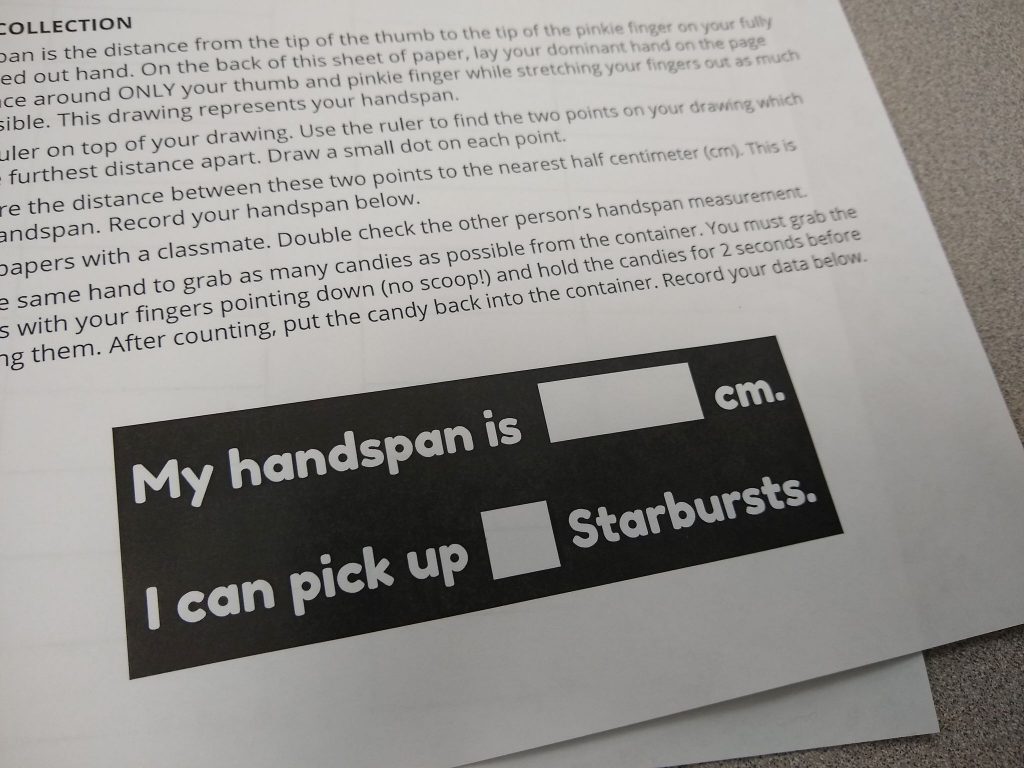
I gave students a specific place to record their handspan so they wouldn’t forget. There was also a place for students to write the number of Starbursts they were able to pick up with their dominant hand.
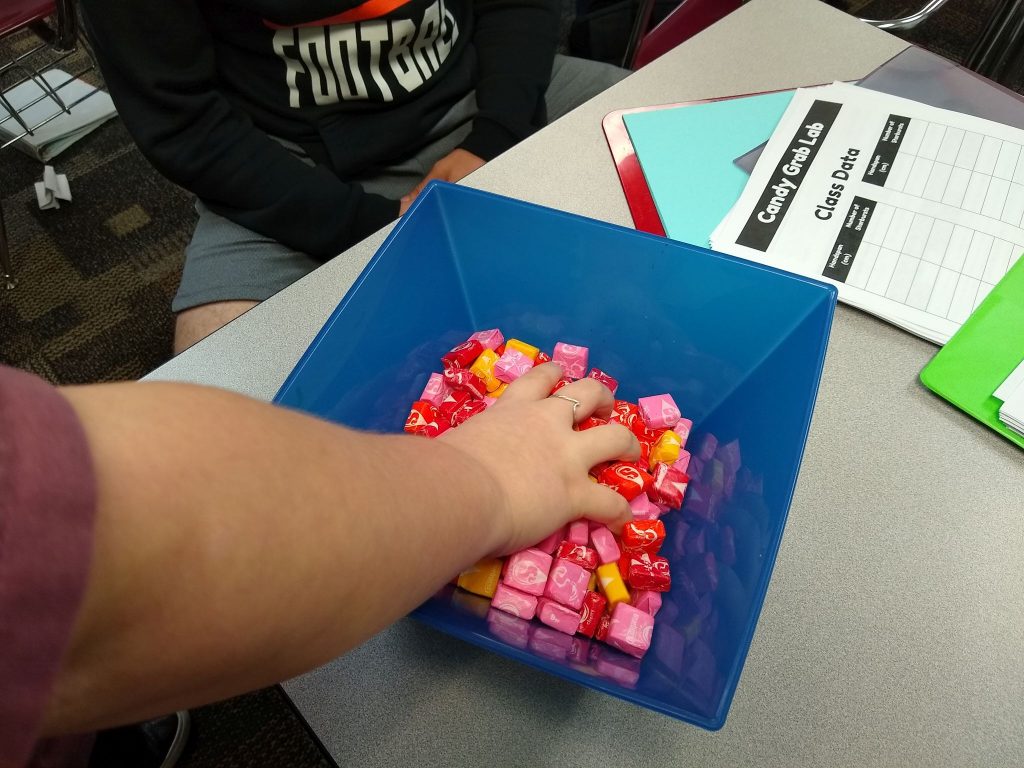
Now, it’s time for the candy grab! I placed a bag of Starbursts in a large bowl. Again, I gave them instructions for the candy grab:
Use the same hand to grab as many candies as possible from the container. You must grab the candies with your fingers pointing down (no scoop!) and hold the candies for 2 seconds before counting them. After counting, put the candy back into the container.
After everyone had had a turn grabbing the candy (the most time consuming part of this activity), I had students go around the room and tell the class their handspan and the number of starbursts they were able to pick up. Students recorded this on the class data sheet.
If you wanted to do this activity over multiple days, you could collect a single set of class data and give it to the class the next day. Alternatively, you could have students submit their data via a google form/spreadsheet. Then, the rest of the class could access the data digitally.
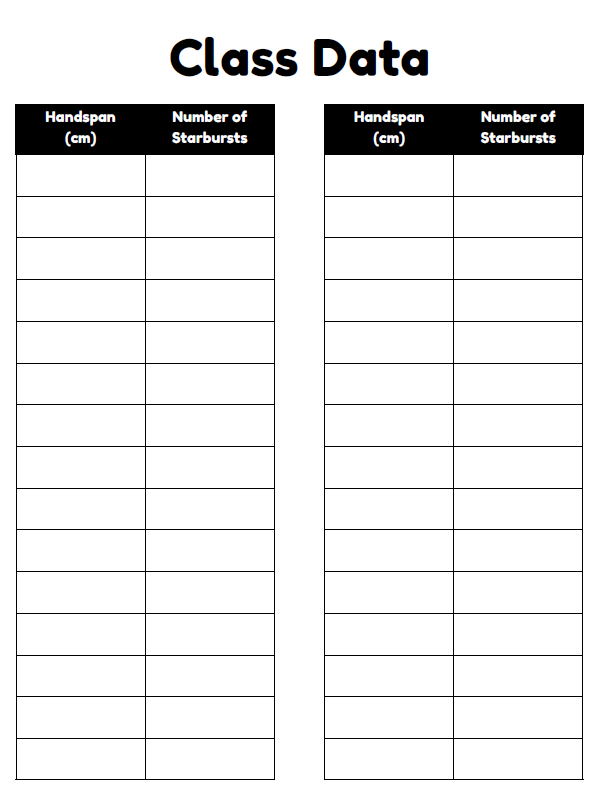
Once students had the class set of data, it was time to perform linear regression using their chosen technology (TI-84 or Desmos).
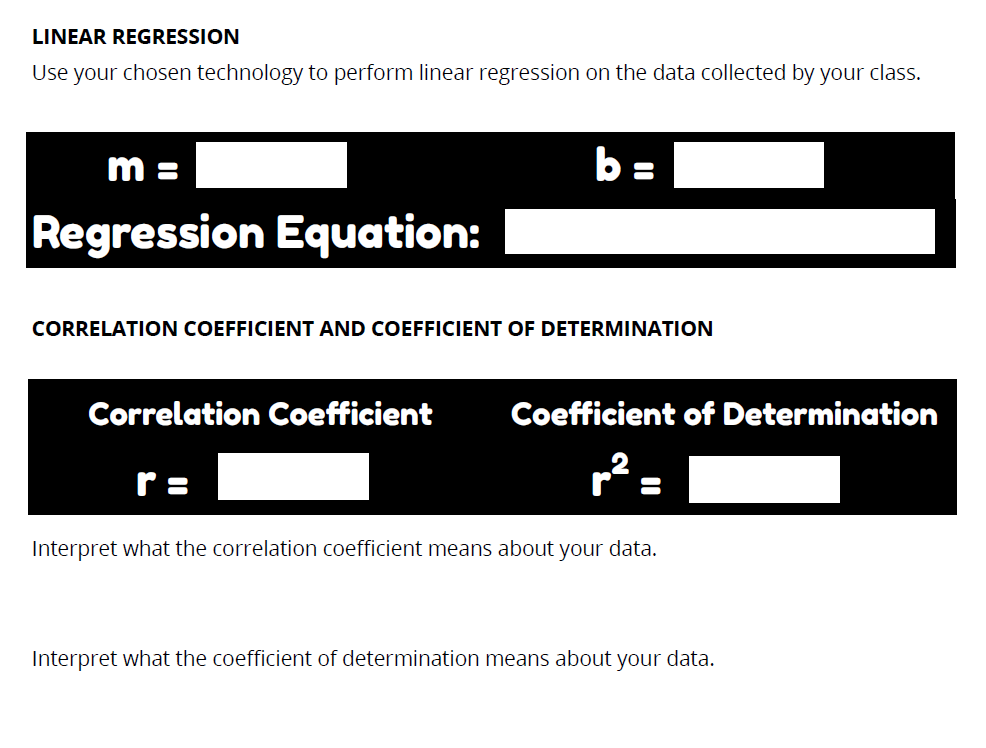
I also had them record the correlation coefficient and coefficient of determination as well as interpret what each of these numbers signifies about their data.
The making predictions section of the activity is my favorite part. I went around the school and found teachers/school employees who were willing to let me trace their handspan and count how many starbursts they were able to pick up.
I wrote each employee’s name under their handspan and hung each handspan on the dry erase board using magnets.
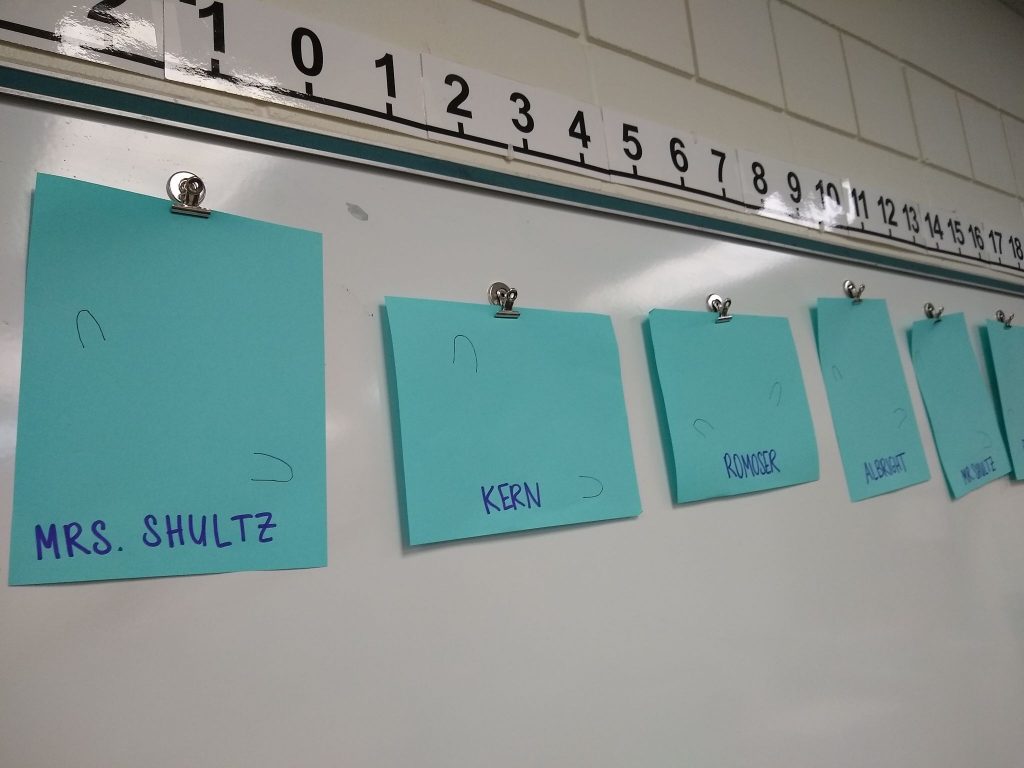
Students had to pick three staff members from the board. They recorded each staff member’s name. Then, they used a ruler to measure that person’s handspan from the tracing that I took.
They used the empty space to use the linear regression equation to predict how many starbursts each chosen staff member would be able to pick up.
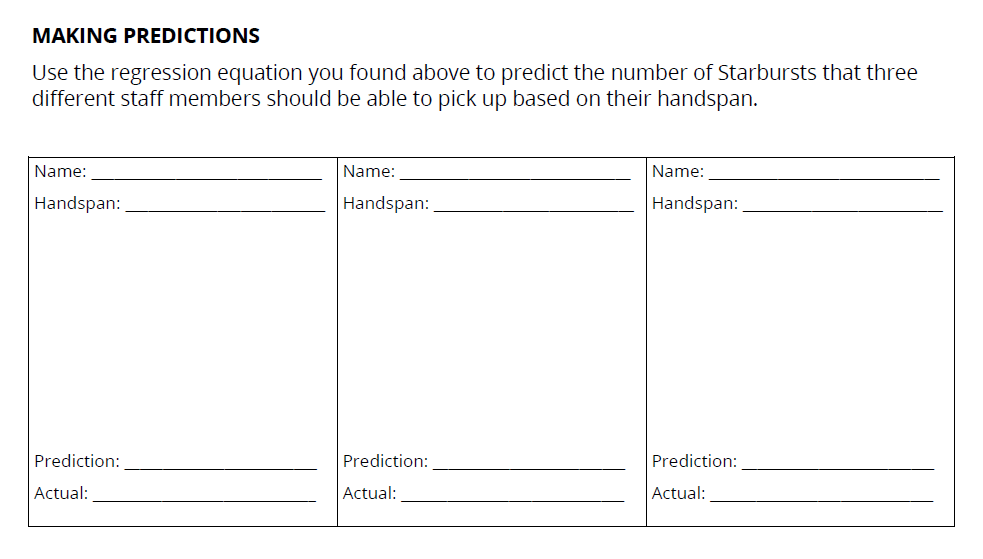
Once students were done making their predictions, they brought their paper to me where I let them look up how many starbursts each person was actually able to pick up.
I wish I had added one last section to this activity where I had students reflect on why or why not their predictions were close to the actual results. I will have to remember that for next time I do this activity!


This is a clever idea for a regression project!
Thanks Will!