Graphing Linear Inequalities Graphic Organizer
I created this graphing linear inequalities graphic organizer for my Algebra 1 students to glue in their interactive notebooks.
I’ve basically thrown the textbook the rest of the way out the window. Last semester, I tried to present Algebra 1 concepts in the same order as the textbook even though my students were not using the textbook.
I didn’t do such a good job of that. The textbook order just didn’t make sense when I looked at what my students needed. After finishing our unit on linear equations, I chose to temporarily skip over linear inequalities and systems of linear equations.
When we returned from Christmas Break, we dove head first into exponents. That unit was followed by polynomials. We graphed absolute value equations. And, my students loved them. Absolute value was followed by linear inequalities.
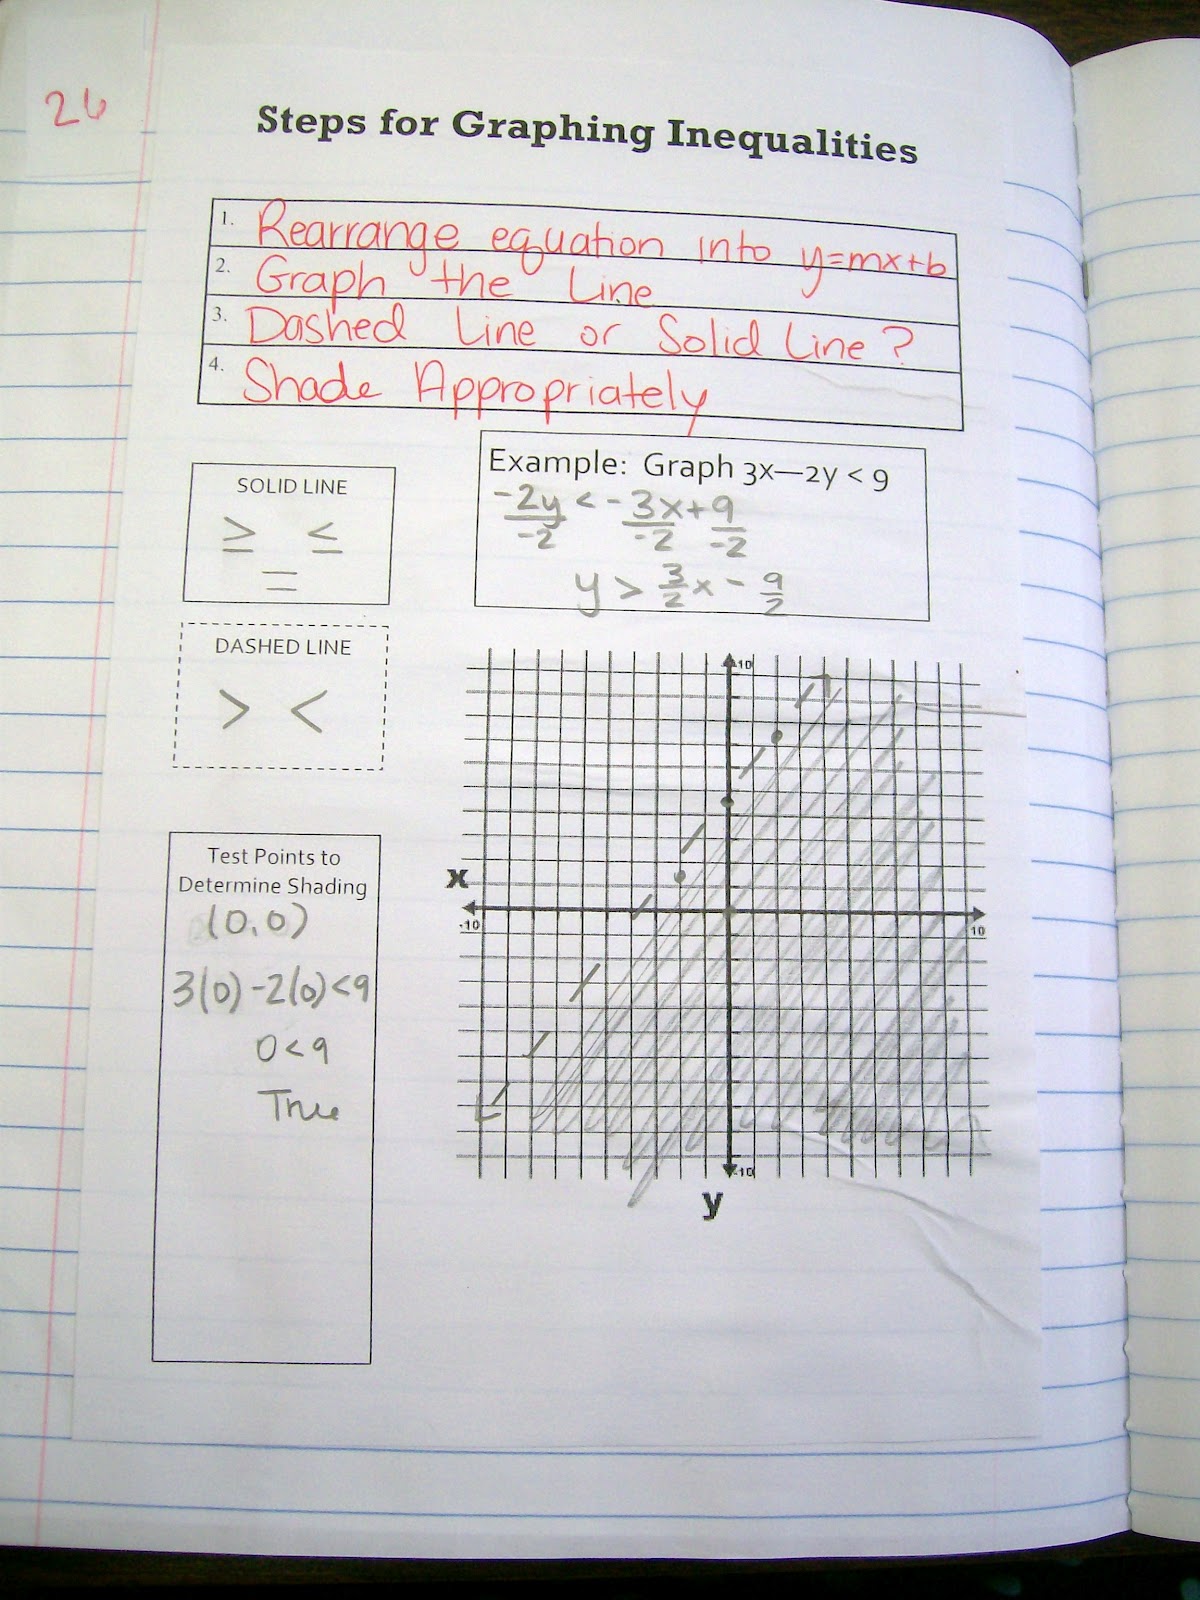
I taught my Algebra 2 students to shade inequalities by testing points. It was a natural way for me to teach it because that is how I remember learning. But, it failed for my students.
I modified my instruction away from testing points, and I like the end result a lot better.
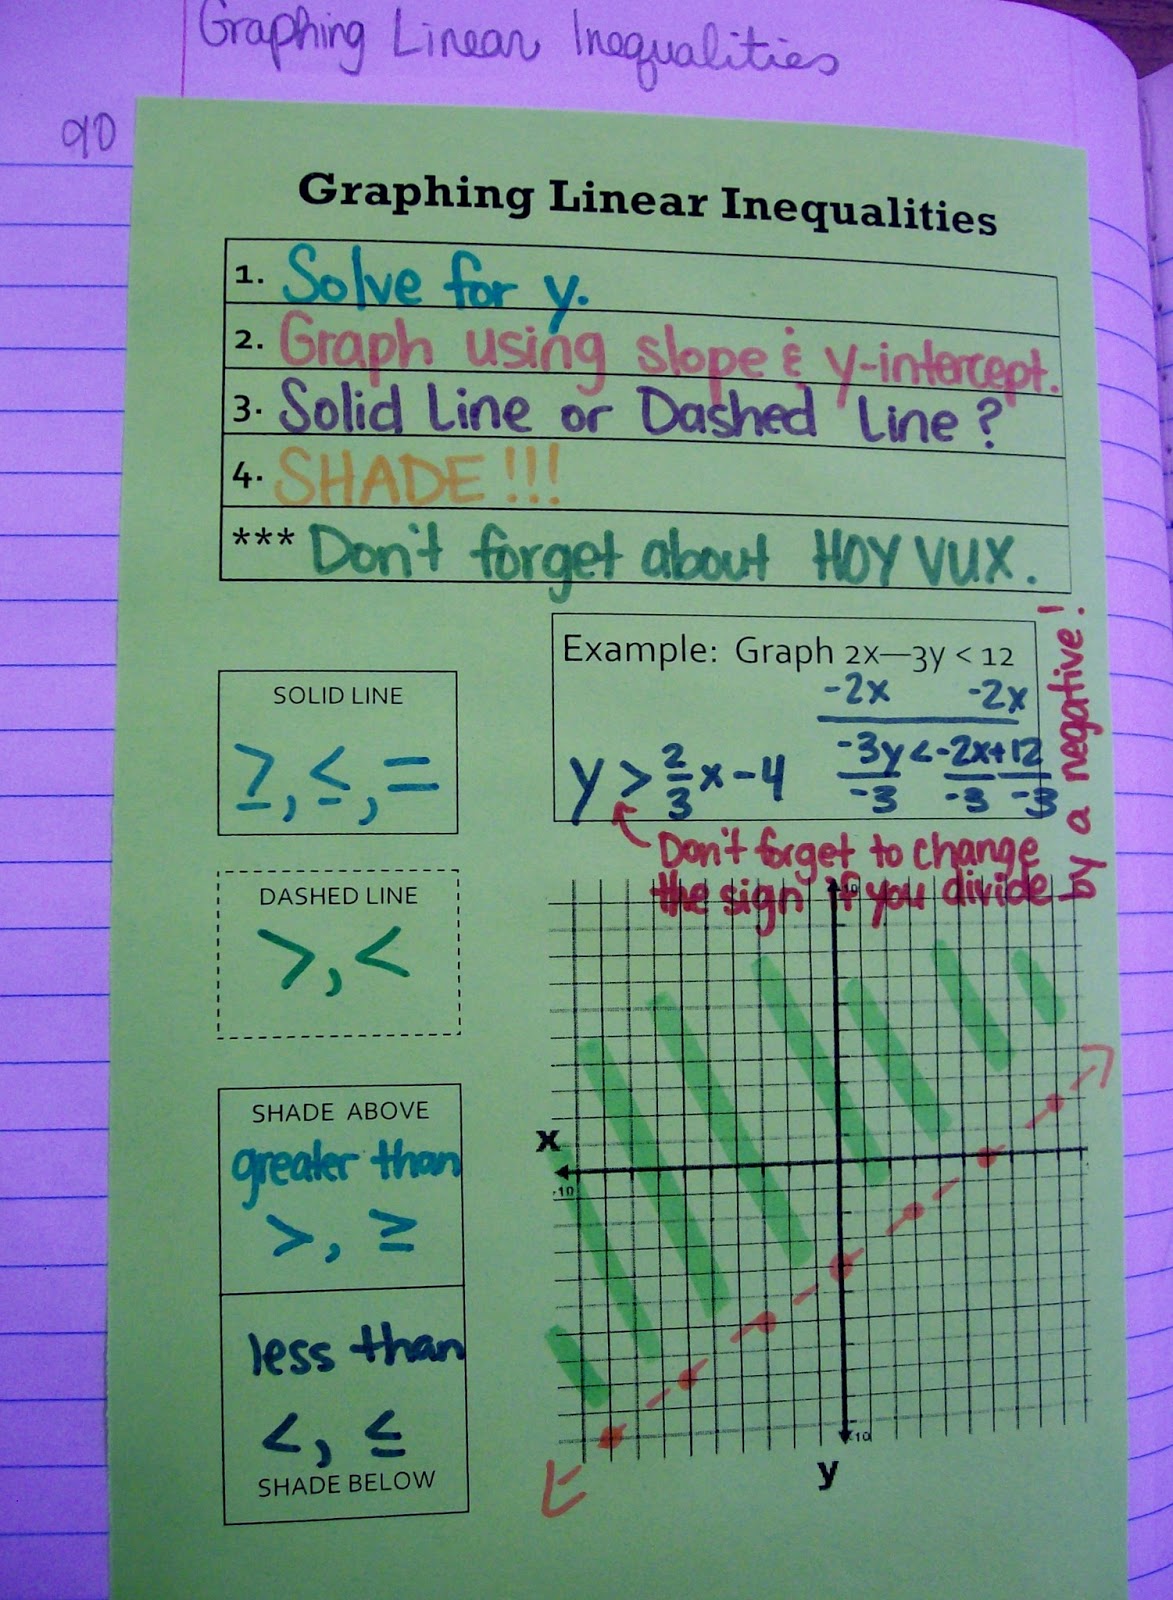
For inequalities that can be solved for y, I taught students to shade their graphs according to the inequality symbol. If the inequality says “y is less than,” that means we want to shade the y-axis where it is “less than” our graph.
This translates to shading the part of the graph that includes the y-axis below the graph.
If the inequality says “y is greater than,” that means we want to shade the y-axis where it is “greater than” our graph.
This translates to shading the part of the graph that includes the y-axis above the graph.
A similar explanation can be used for vertical lines, but I neglected to include it on the graphic organizer that we glued in our interactive notebooks.
I surveyed my students about postponing this unit until several months after finishing our unit on linear equations. I asked them if they whether they liked the placement of this unit or if they would have preferred to have covered this when initially learning to graph linear equations.
I believe the consensus of the class was that they thought it was beneficial that we waited. And, I agree. Postponing this unit allowed me time to spend an entire week on solving literal equations.
This helped beef up our skills to allow us to quickly and accurately convert an equation into slope-intercept form.
Graphing Linear Inequalities Graphic Organizer Files
Alternate Version with Test Points
I created this graphing inequalities graphic organizer for my Algebra 1 students to glue in their interactive notebooks. I had my students test a point on one side of the line in order to determine which way the inequality is shaded.
Updated Version of Graphic Organizer with Test Points
Updated Version with Shade Above/Shade Below Instructions
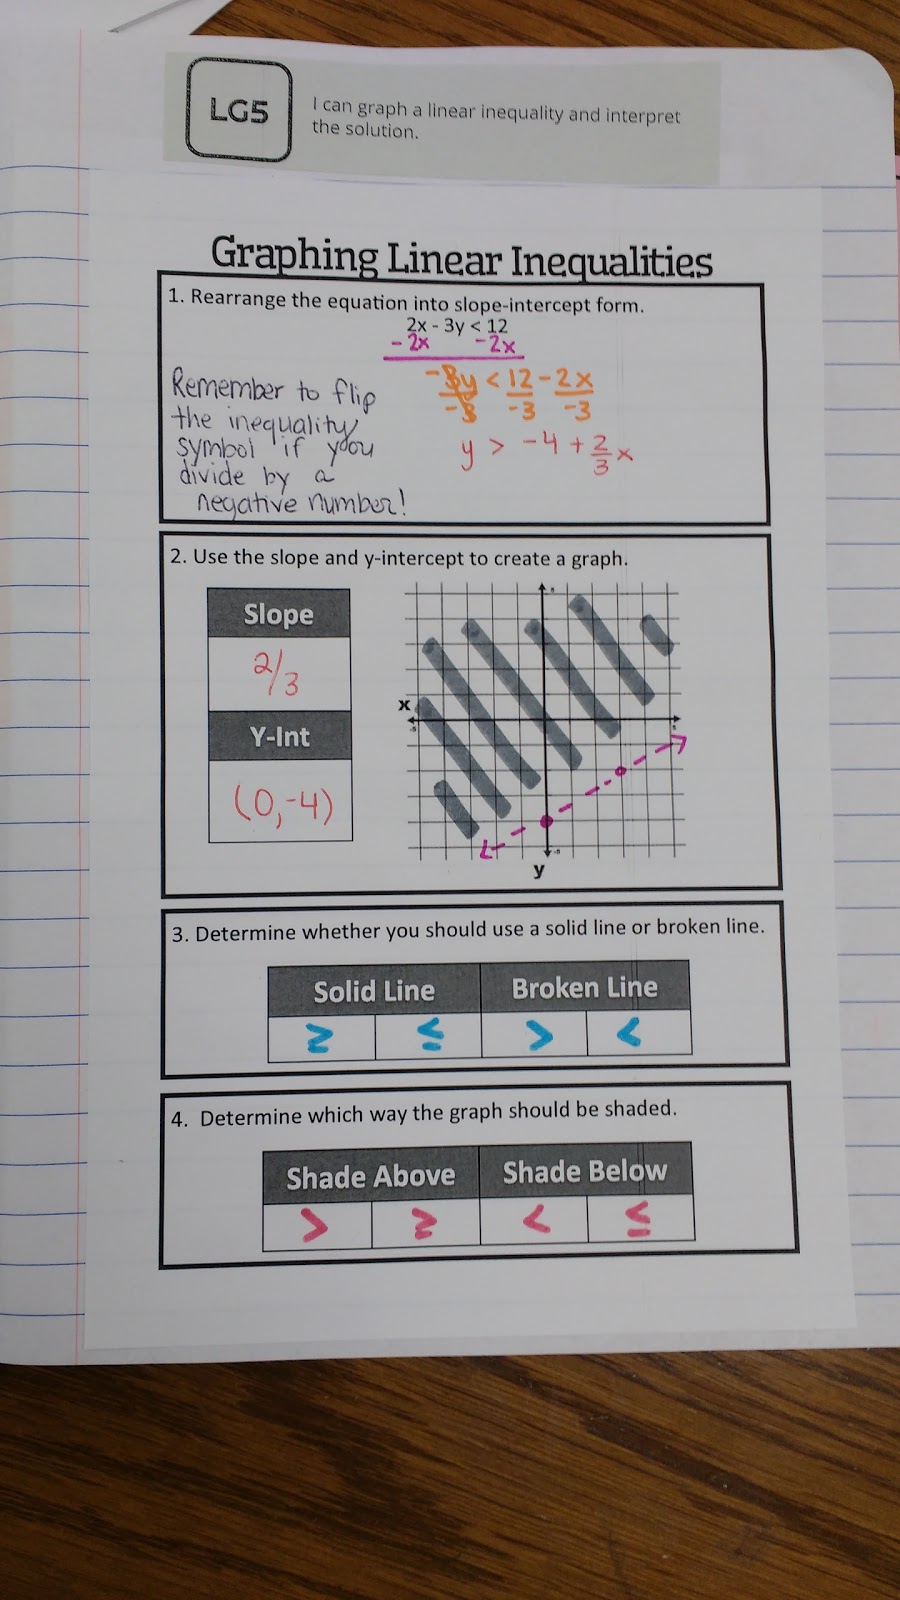
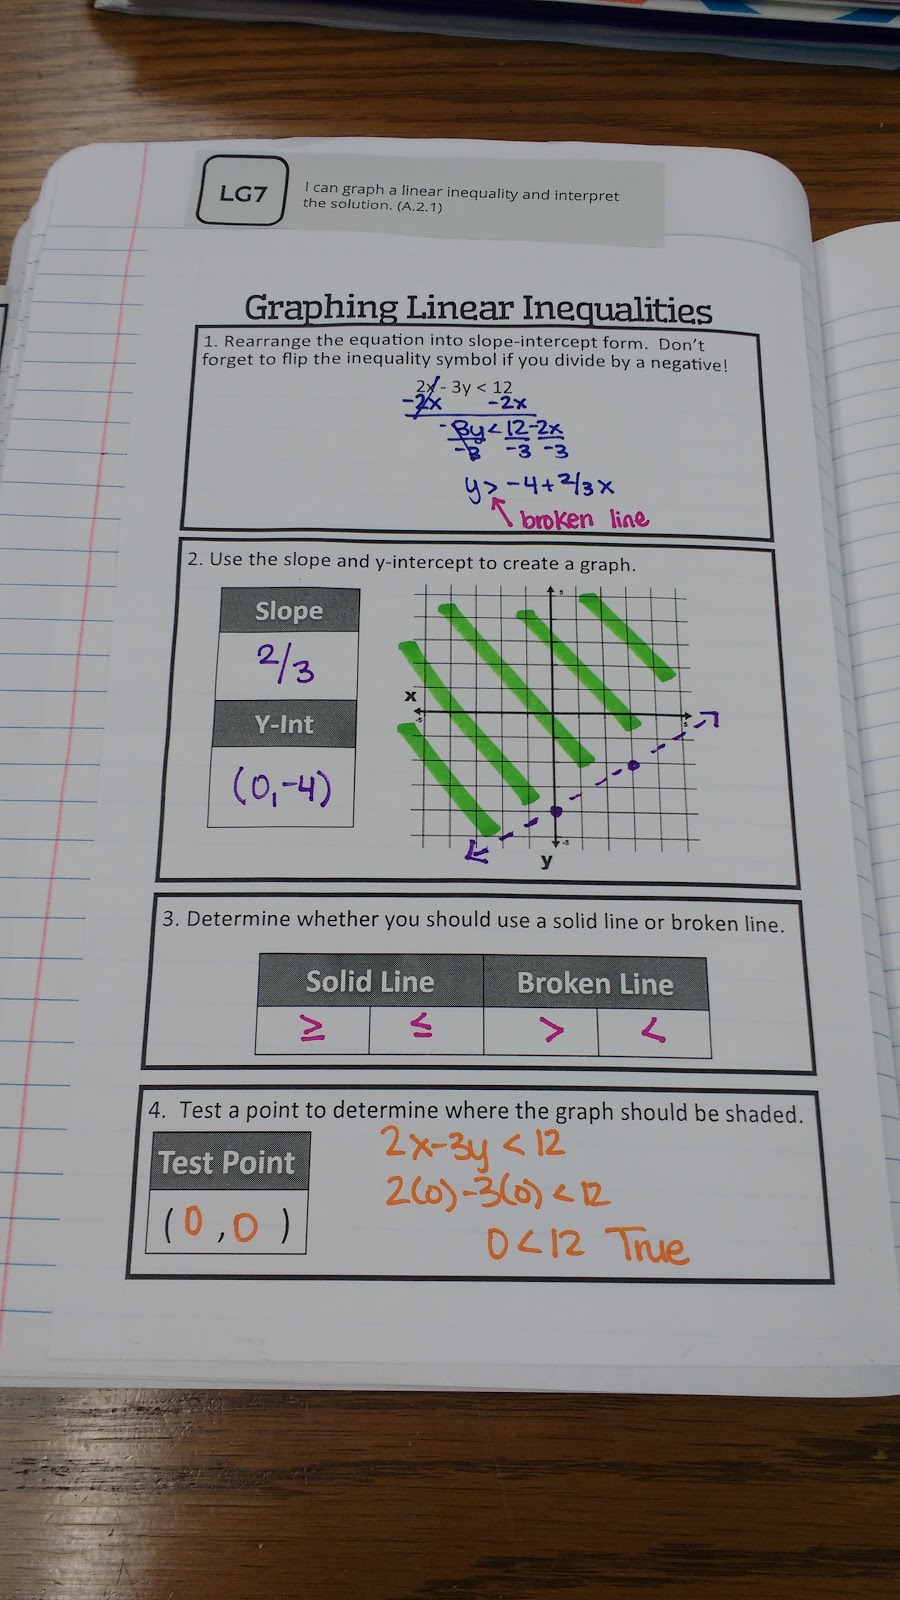
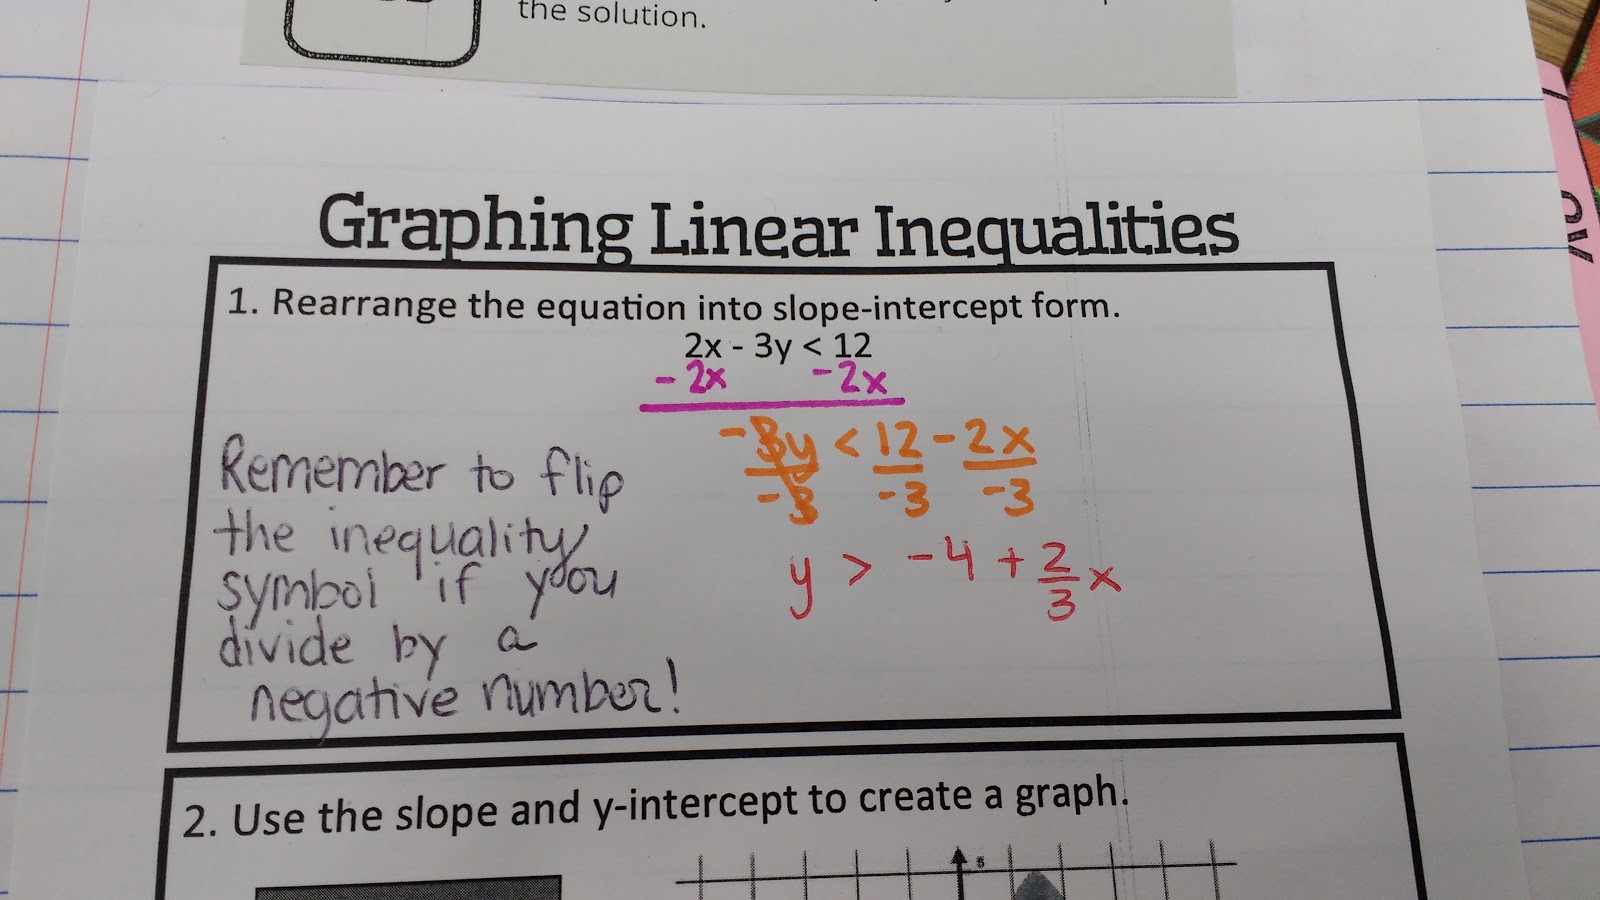
Step 1: Rearrange the equation into slope-intercept form.
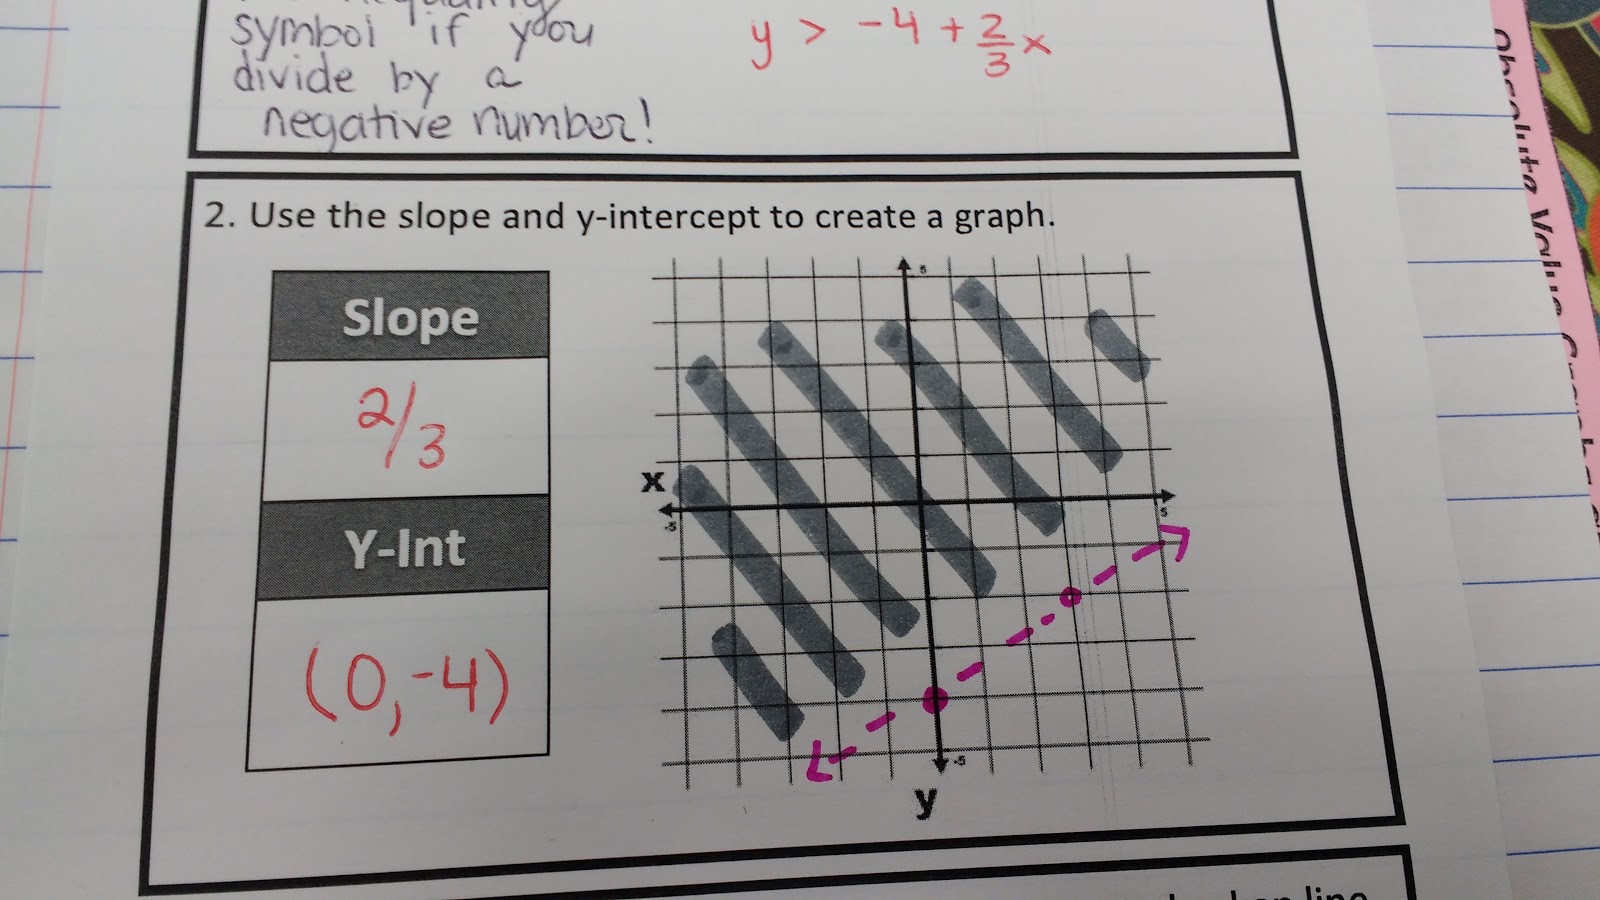
Step 2: Use the slope and y-intercept to create a graph.
Step 3: Determine whether you should use a solid line or broken line.
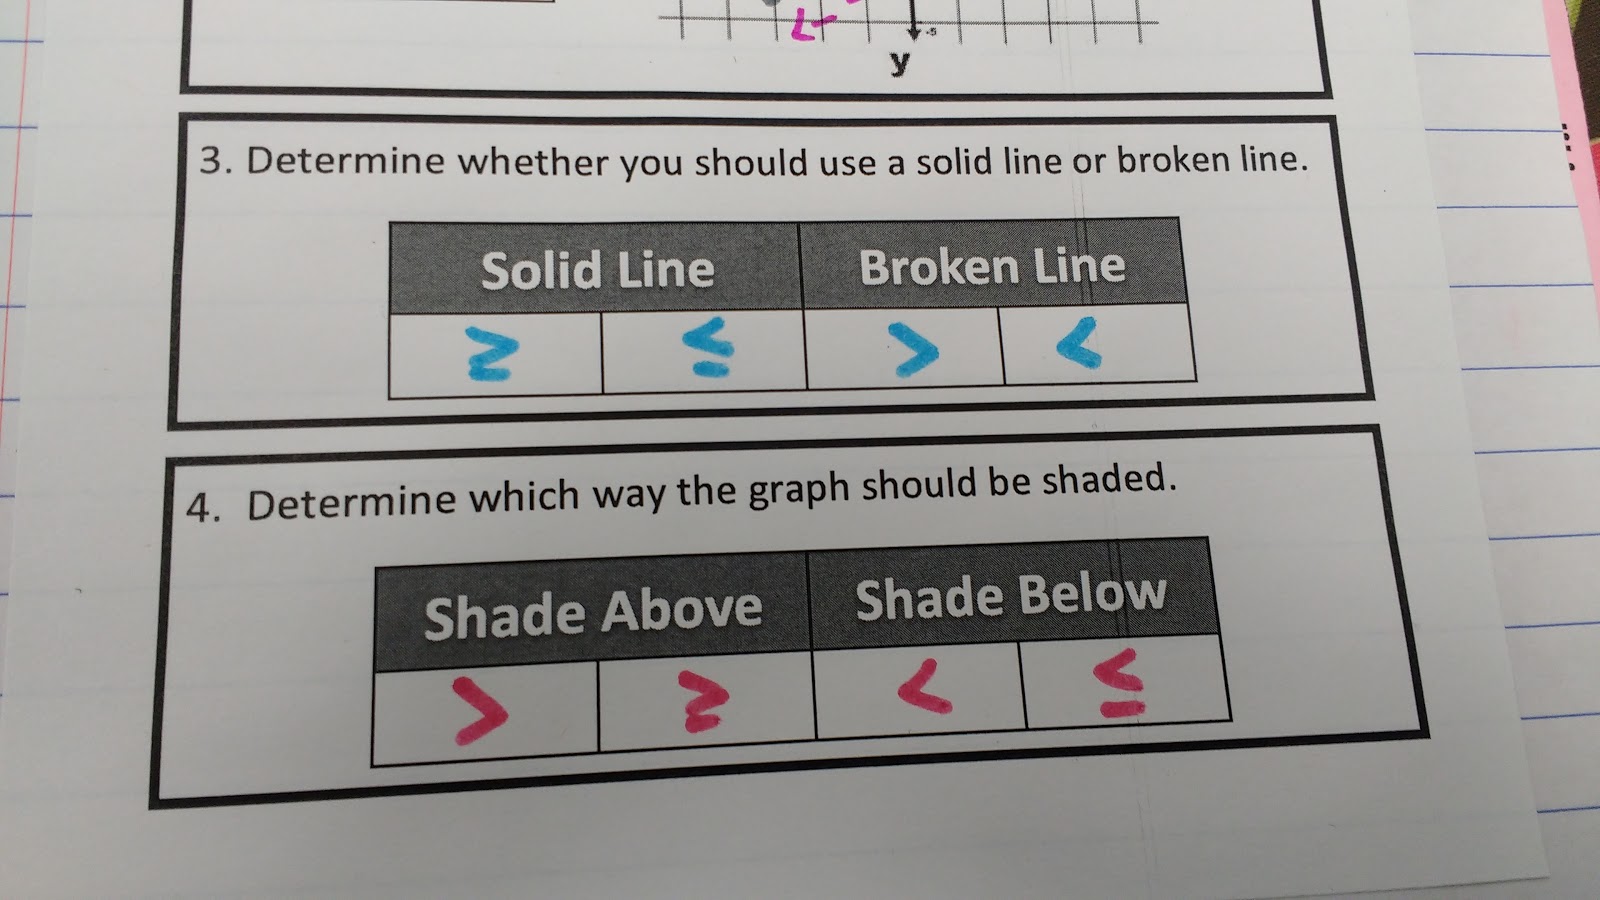
Step 4: Determine which way the graph should be shaded.
Yuk. Why solve for y? How about plugging in 0 for x and solving for y, plugging in 0 for y and solving for x, connecting the two points, then testing (0,0)? It works for any inequality that has an x term, a y term and a constant term, i.e, boundary doesn't pass through the origin and isn't horizontal or vertical.
At least give good students the option. It's fast, simple, accurate.
Because not every equation has whole number intercepts. If they are not whole numbers, graphing by intercepts is not very accurate.
GREAT JOB! I love this. Students need to learn to solve for a variable and this is a great way to teach it. Plugging in 0 for x and then 0 for y will work but they are going to get frustrated if they encounter fractions for answers. Question? What does HOY VUX stand for? I don't think I've used that one.
I just finished this outcome with my students. Thanks for the ideas here. One question: What is HOY VUX?
Great Job! You changed your wrong answers from the last upload of this activity! Yeah, I usually just tell the kids that if Y is great than, shade the top half of the line (above) and if Y is less than shade below the line.
thanks for the share!
Video on HOY VUX http://www.youtube.com/watch?v=3RcHdkTk_X4
Love this! Thank you, Sarah!
Hi, I hope you can help. I love your blog and foldable ideas. However, I see no links to printable templates. Are they off the blog now?
Hello Sarah! I am inspired by your blog! Are you willing to share your foldable templates? Do you have them all together and I can sort through them? Thanks so much!
I really like your interactive notebooks, and I plan to use them in every subject I teach (I have math, French, and special ed certifications.) This summer, I think I will be teaching math in summer school (the kids will be from grades 9-12 and will be earning credits toward Alg I, Alg II, geometry, and trig, depending on what they need to graduate.) Sometimes, I have trouble downloading your templates, and sometimes, I don't. Could you send me the templates for this unit or post a link to someplace where I can get the pdf files? Thanks,
Hi! I'm so excited that you are going to be trying out interactive notebooks!
I always finish linear equations and systems.. then I go back and do inequalities and systems of inequalities… that way they almost have it before we start.
Good idea!
I do the point (0,00 as my test… always
Thank you so much for sharing! I love what you are doing with your ISBN.
I have always taught testing a point (try (0,0) unless it's on the boundary), and I LOVE your idea to use the y-axis! That's a great way to reinforce them knowing which is the y-axis and their greater/less than terminology; awesome idea!