Skip to content
Facebook
X
Instagram
Threads
YouTube
Pinterest
Email
Trending Resource
:
Tape Sudoku
- A New Circular Sudoku Variant
About
Expand
About Me
Puzzles
Expand
All Printable Puzzles
Math Puzzles
Logic Puzzles
Seasonal and Holiday Puzzles
Word Puzzles
Hands-On Puzzles
Mazes
Puzzle Solutions
Answer Key Database
Resources
Expand
Sort by Season or Holiday
Sort by Theme
Sort by Grade Level
Expand
Lower Elementary K-2
Upper Elementary 3-5
Middle School 6-8
High School 9-12
Sort by Math Topic
Expand
Number & Operations
Algebra & Functions
Geometry & Measurement
Statistics & Probability
Trigonometry
Calculus
SEARCH
Search
Facebook
X
Instagram
YouTube
Toggle Menu
SEARCH
Search
Home
»
INBs
»
Graphic Organizers
Graphic Organizers
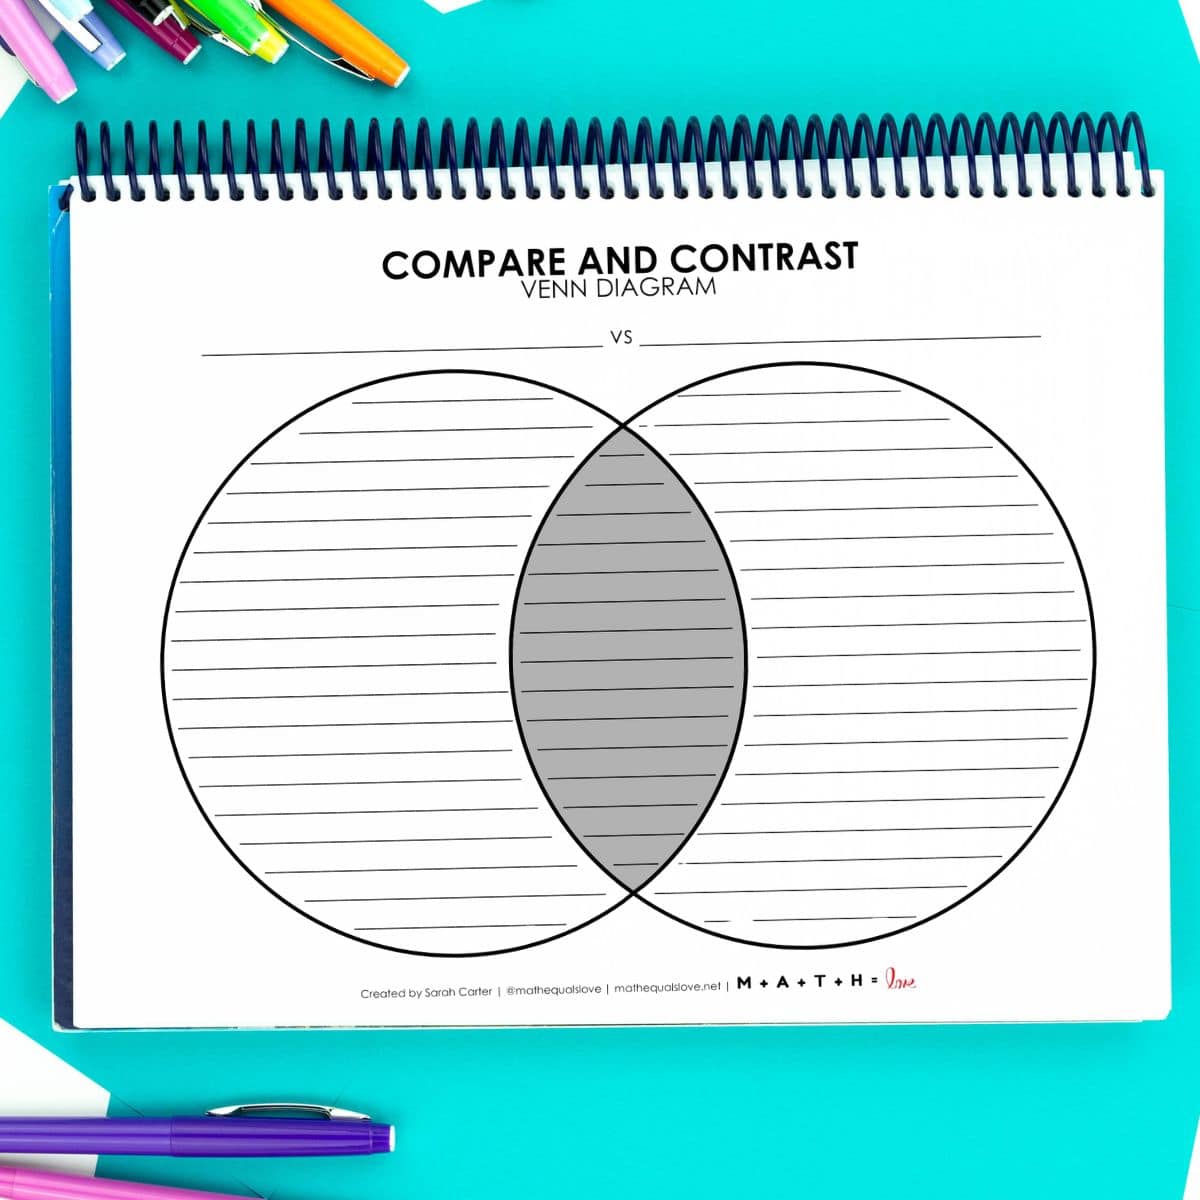
Compare and Contrast Venn Diagram Template
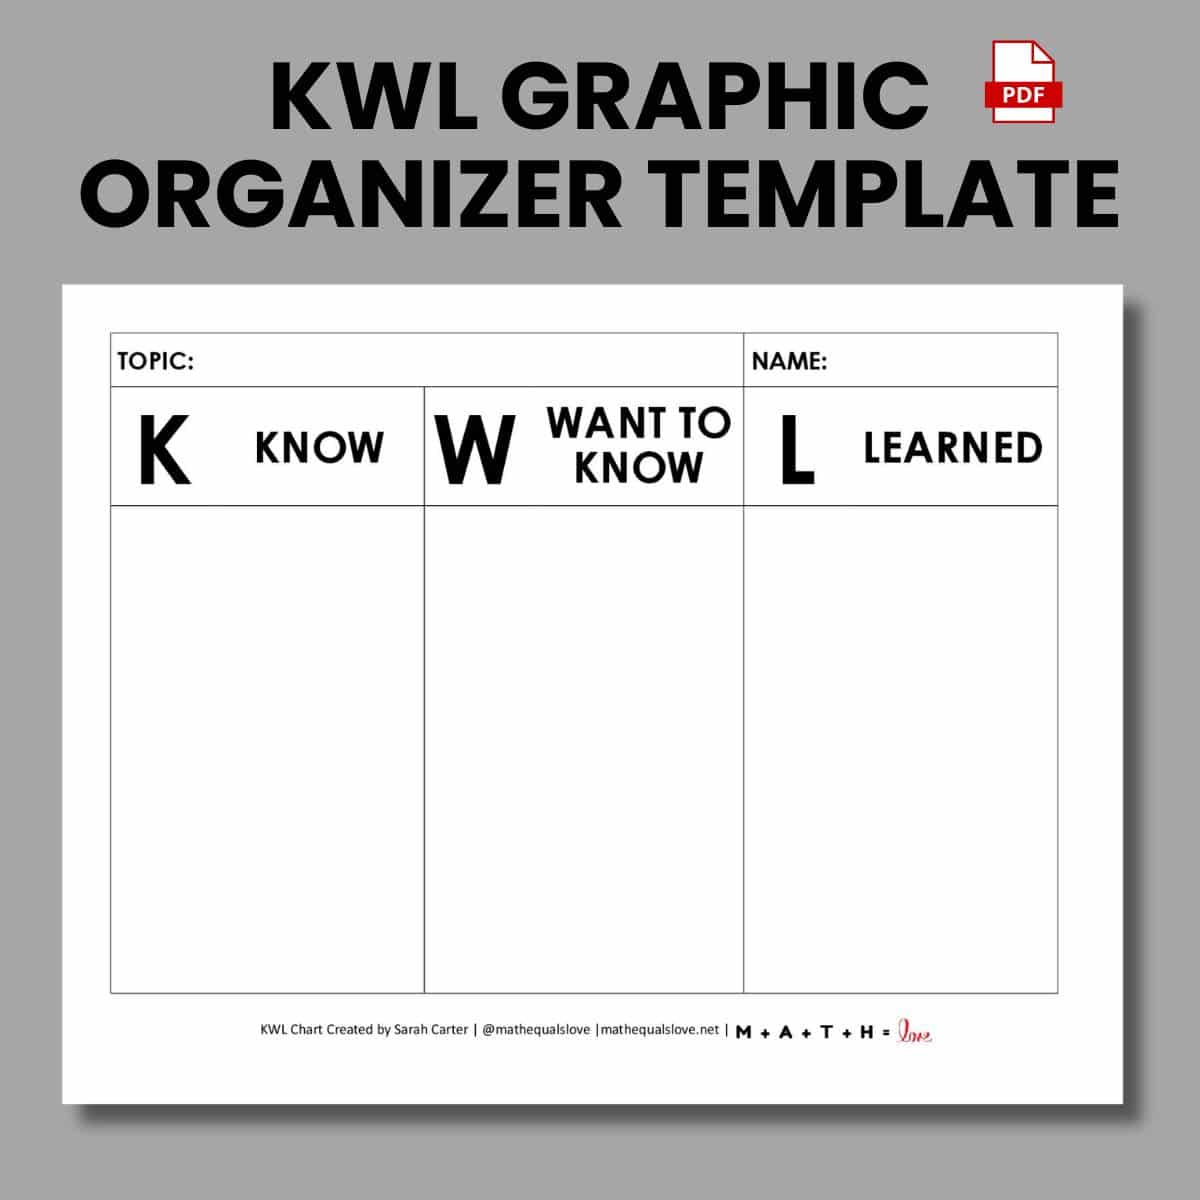
KWL Chart Graphic Organizer Template
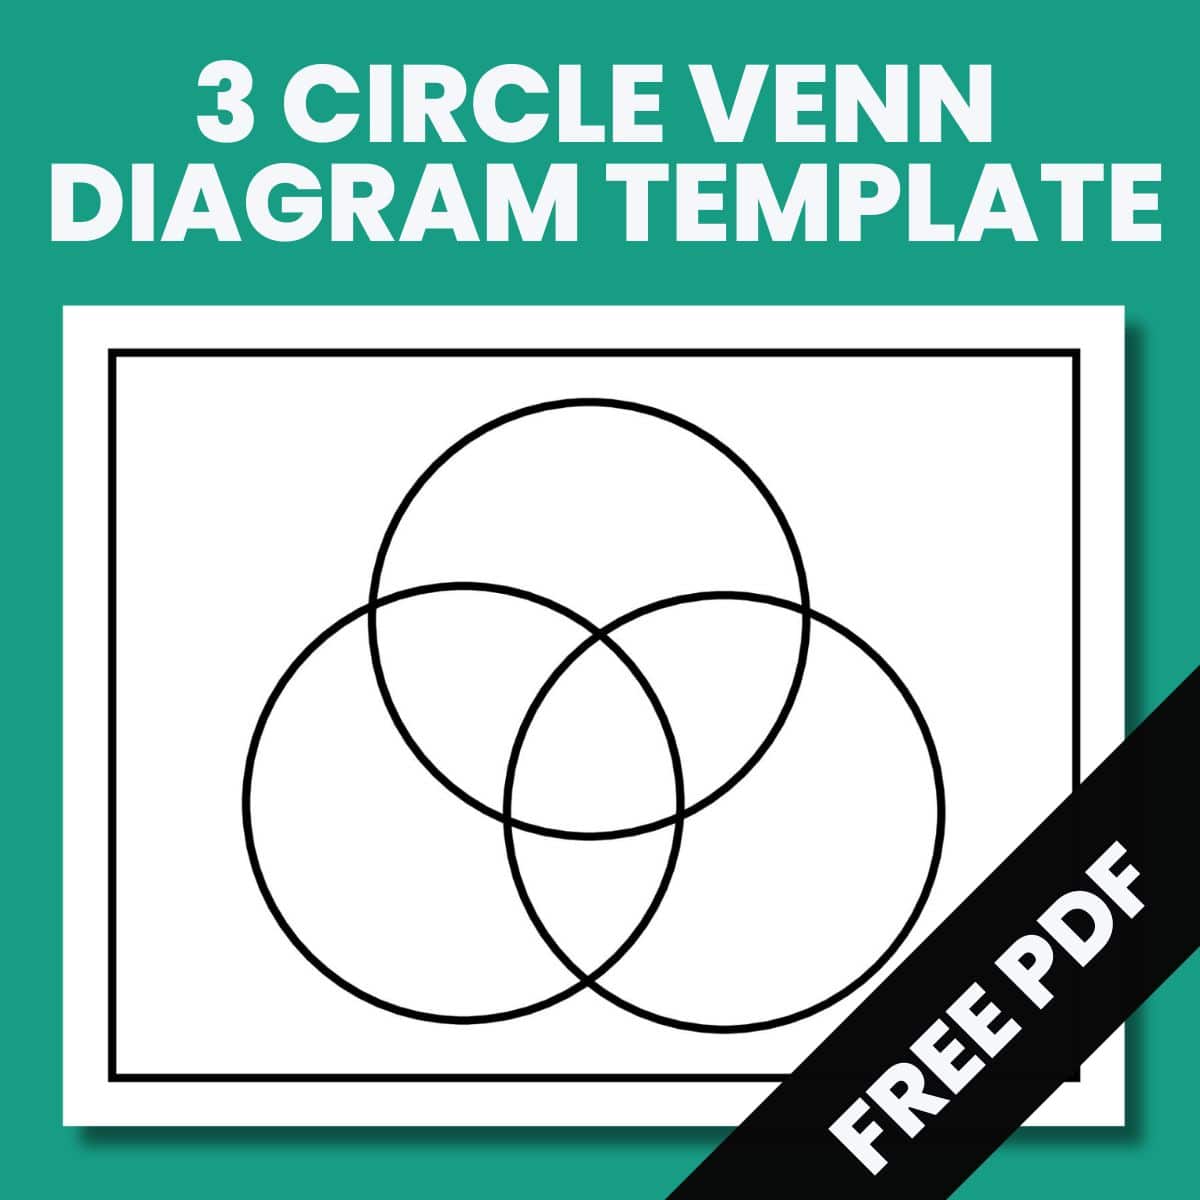
3 Circle Venn Diagram Template
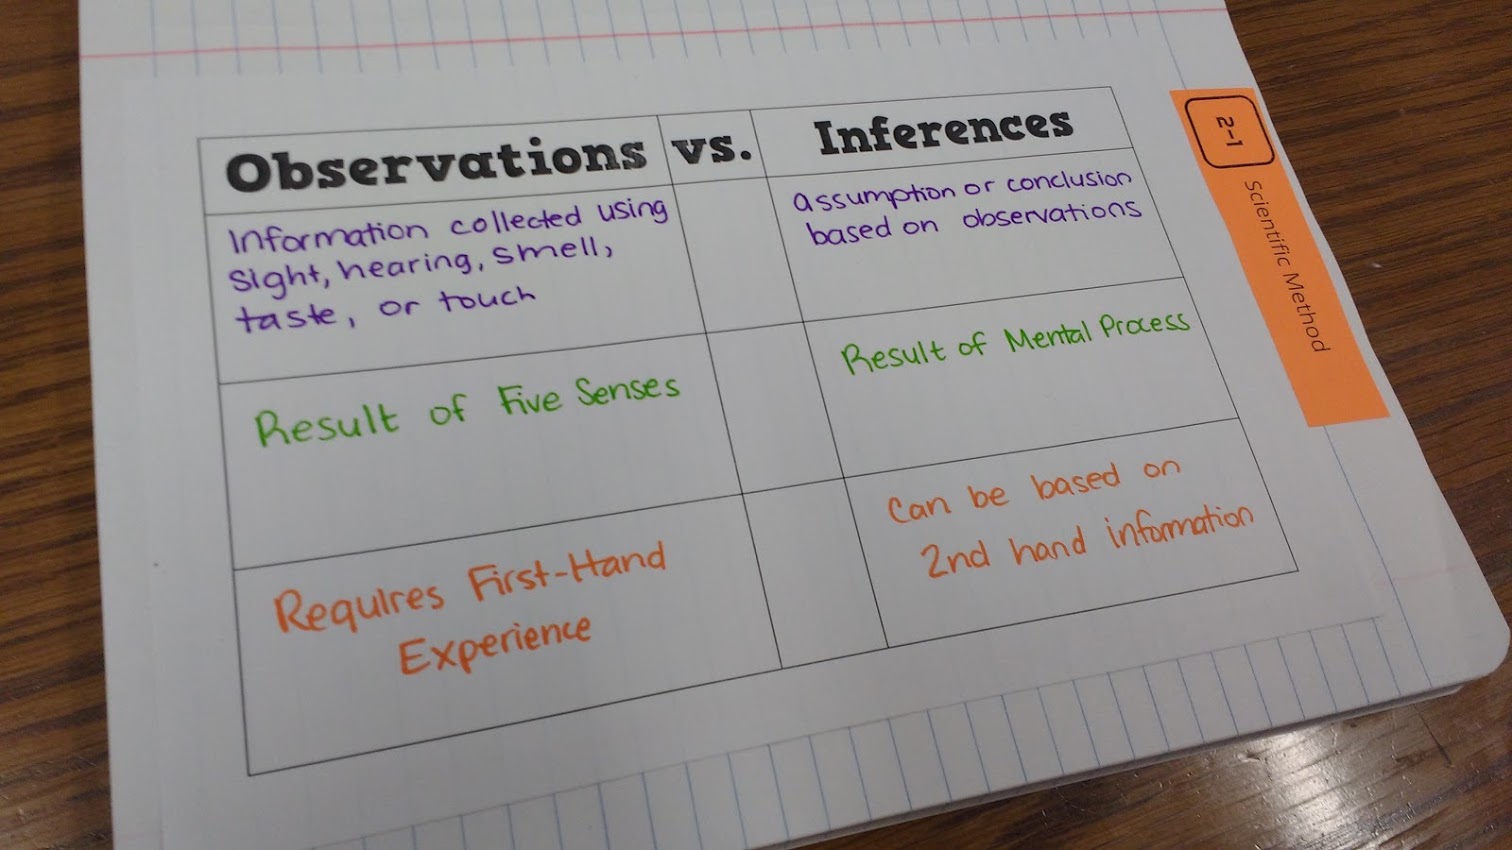
Observations vs Inferences Chart
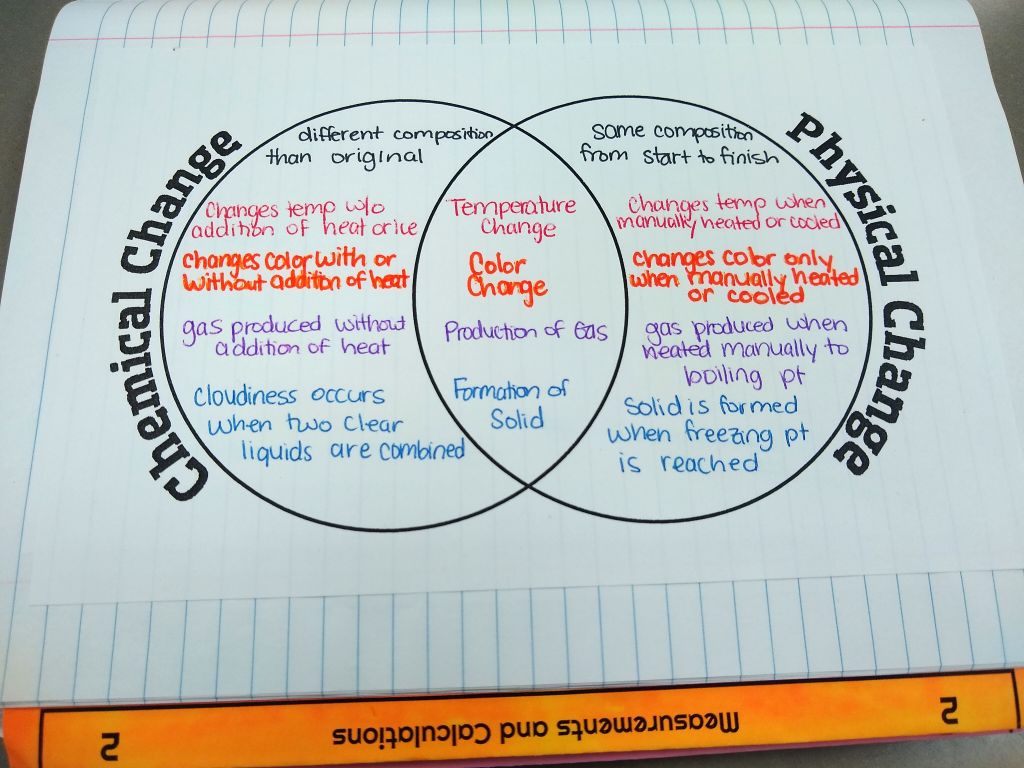
Physical Changes vs Chemical Changes Venn Diagram
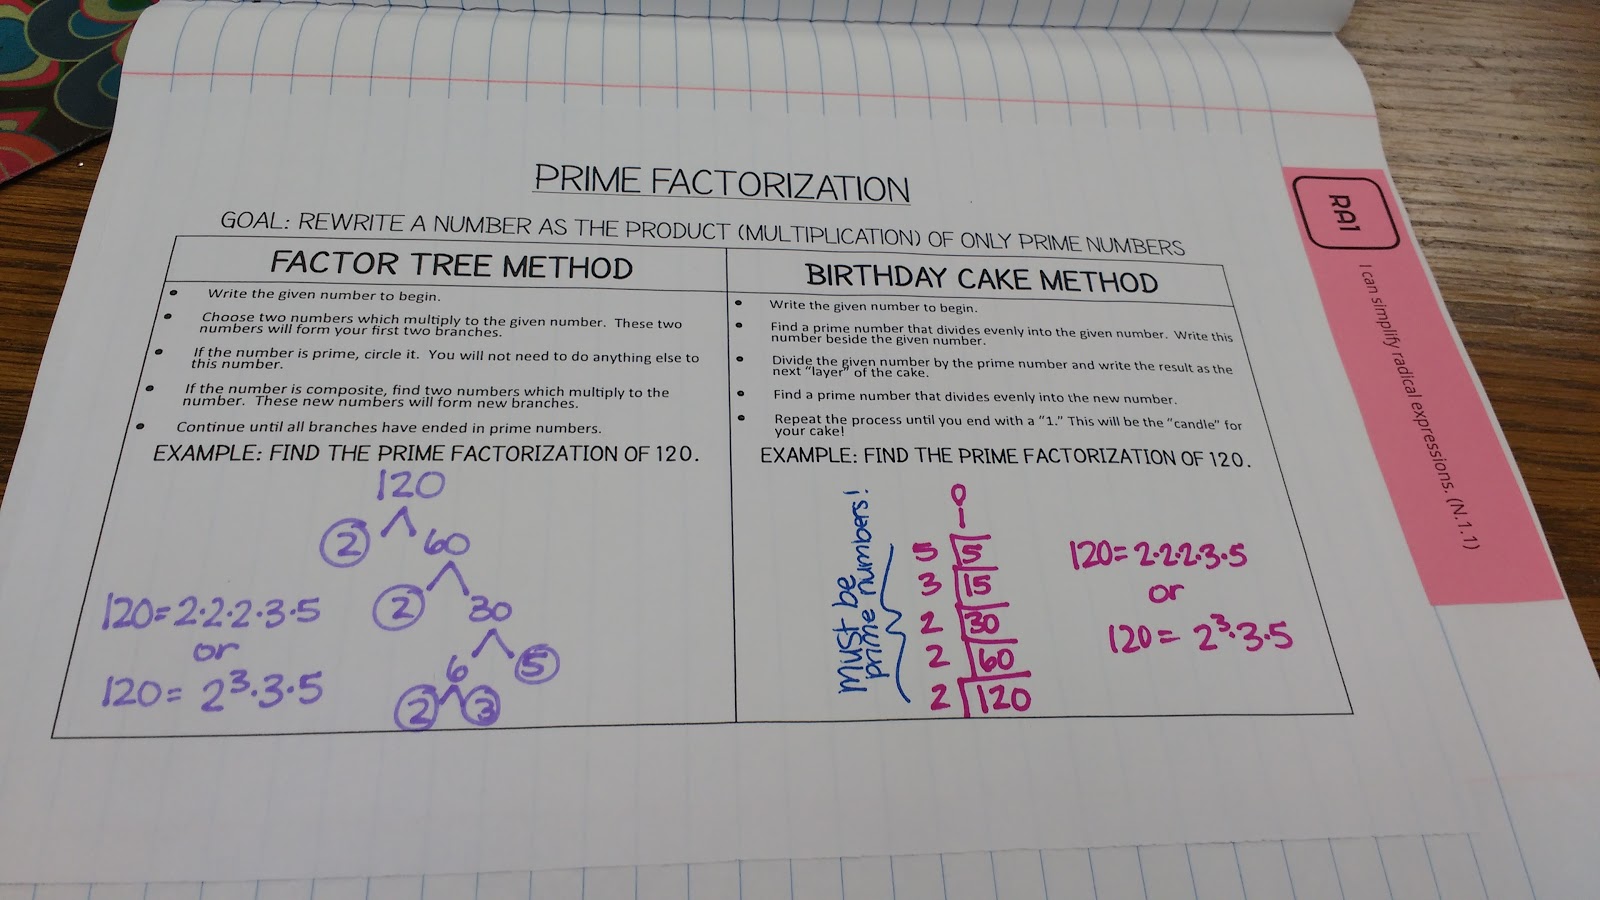
Prime Factorization Graphic Organizer
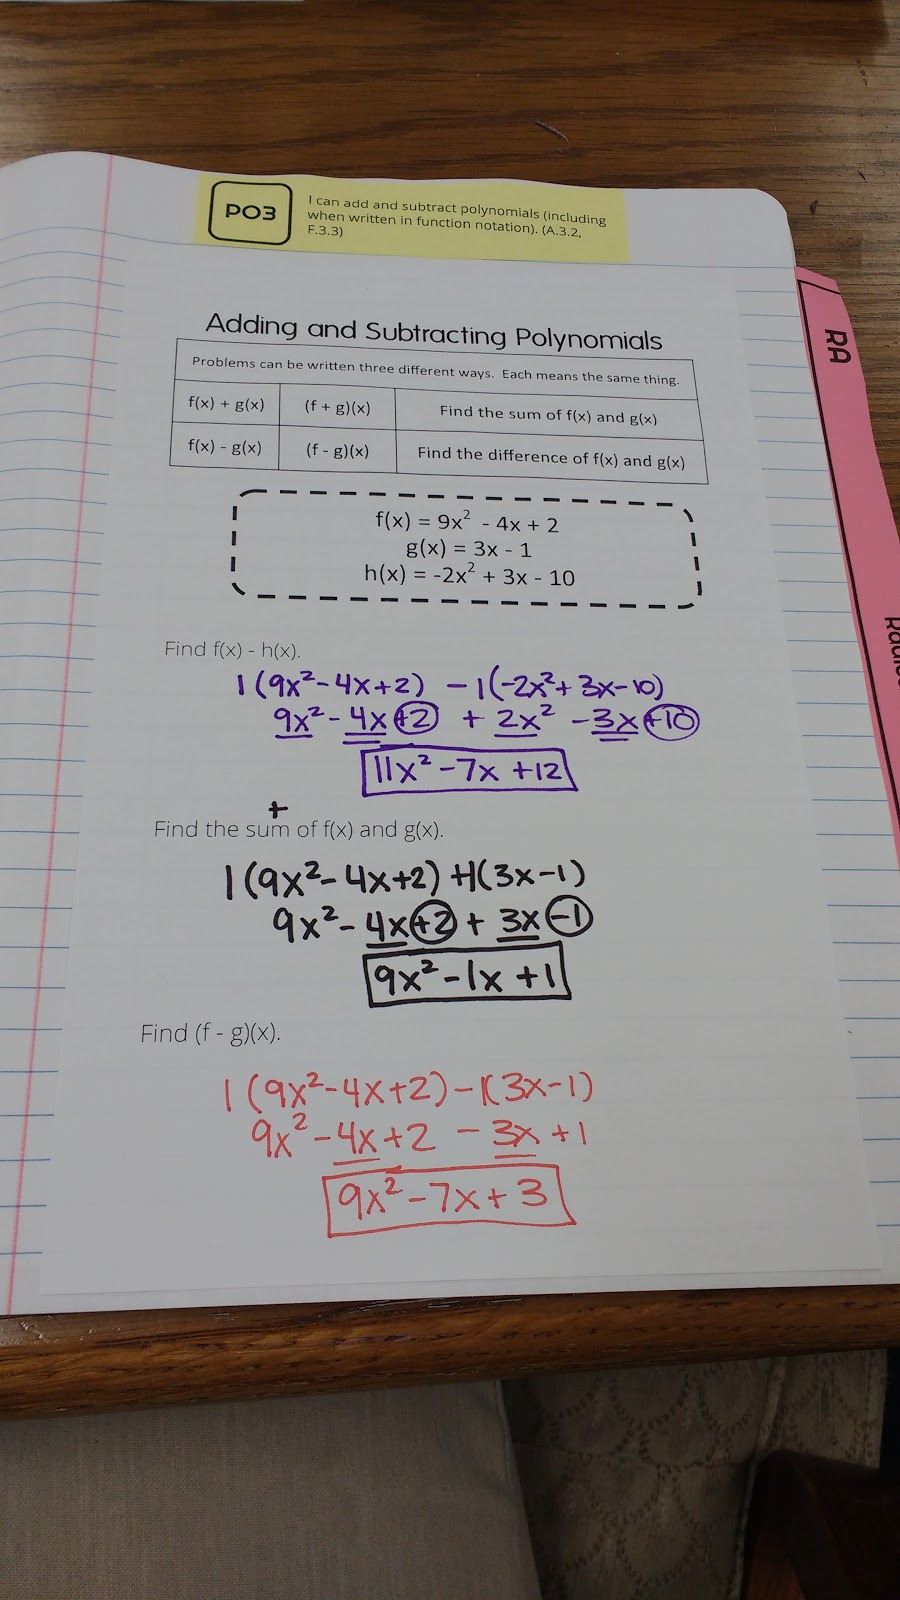
Adding and Subtracting Polynomials Graphic Organizer
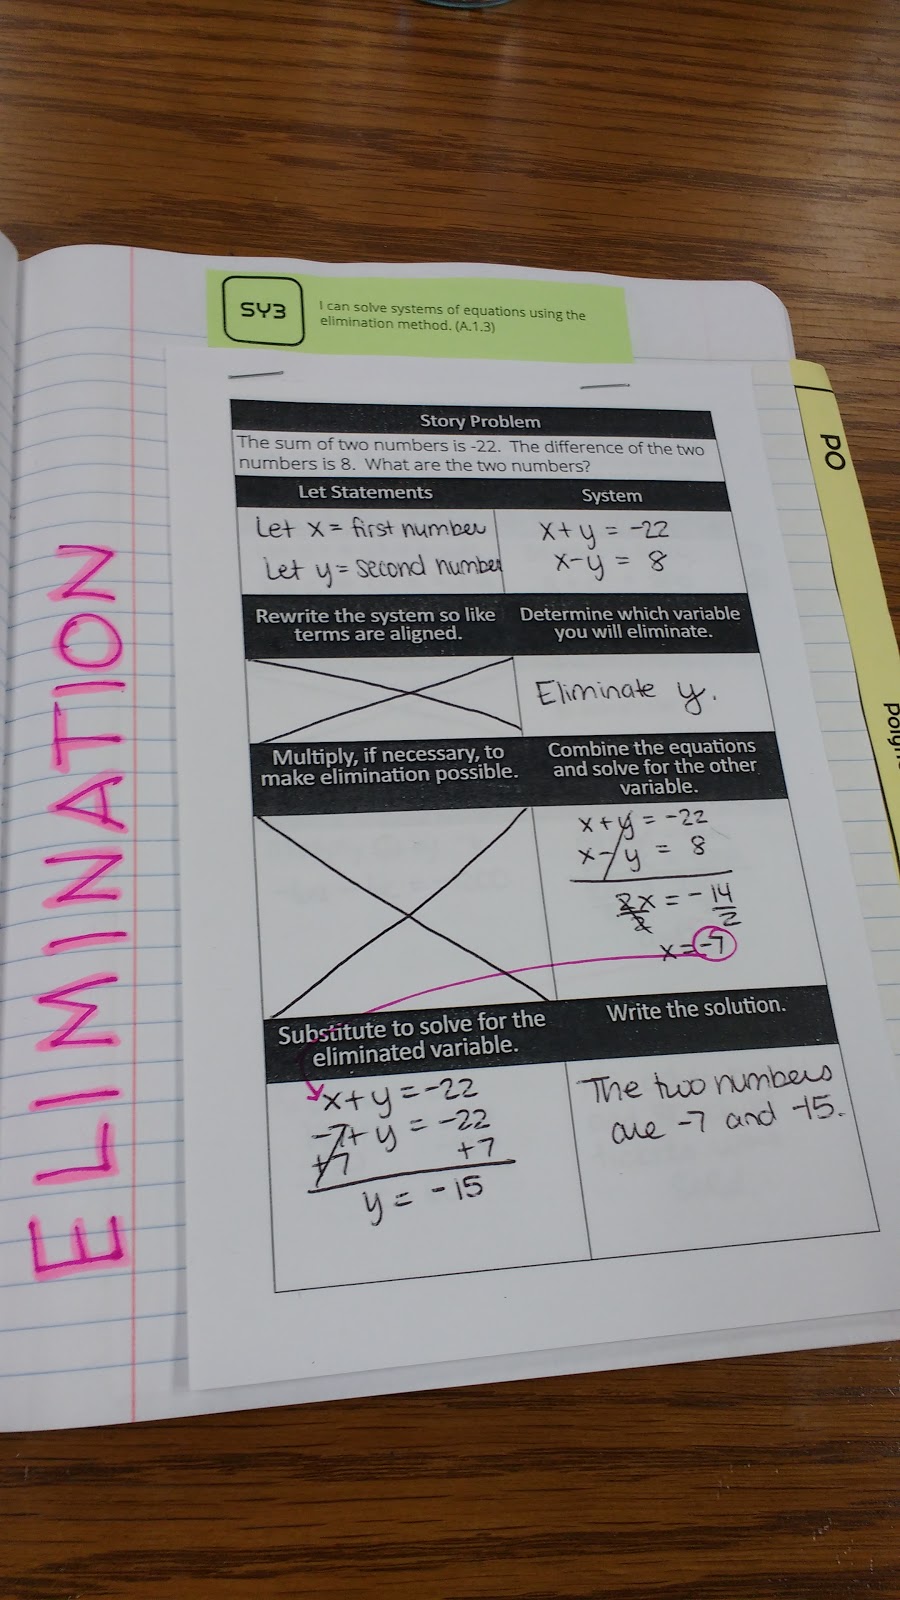
Solving Systems by Elimination Graphic Organizer
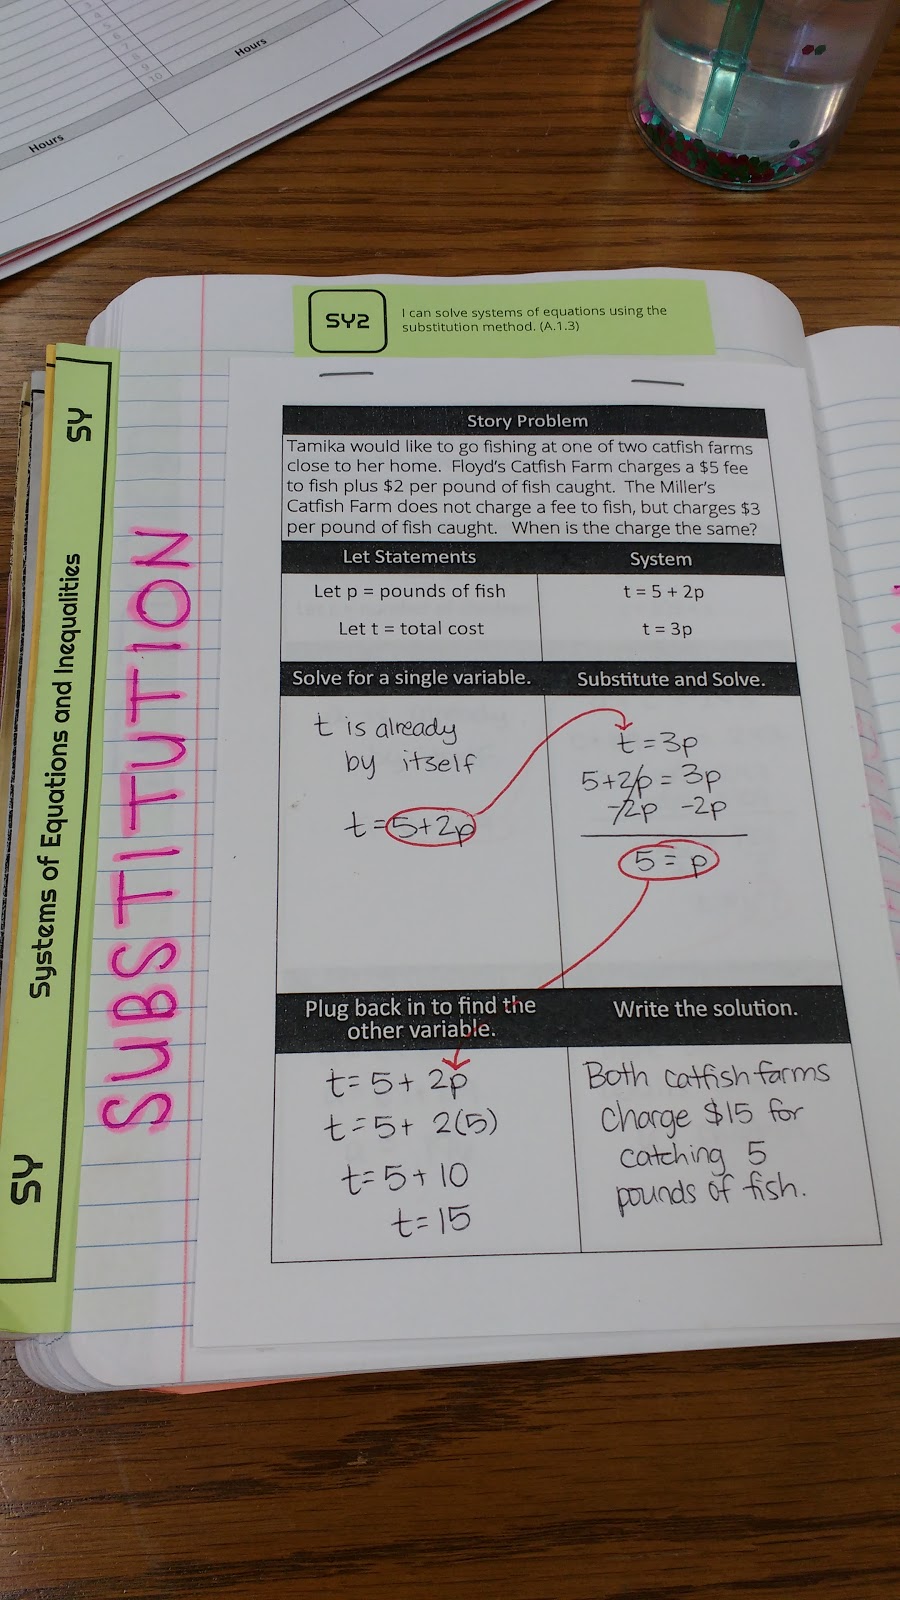
Solving Systems by Substitution Graphic Organizer
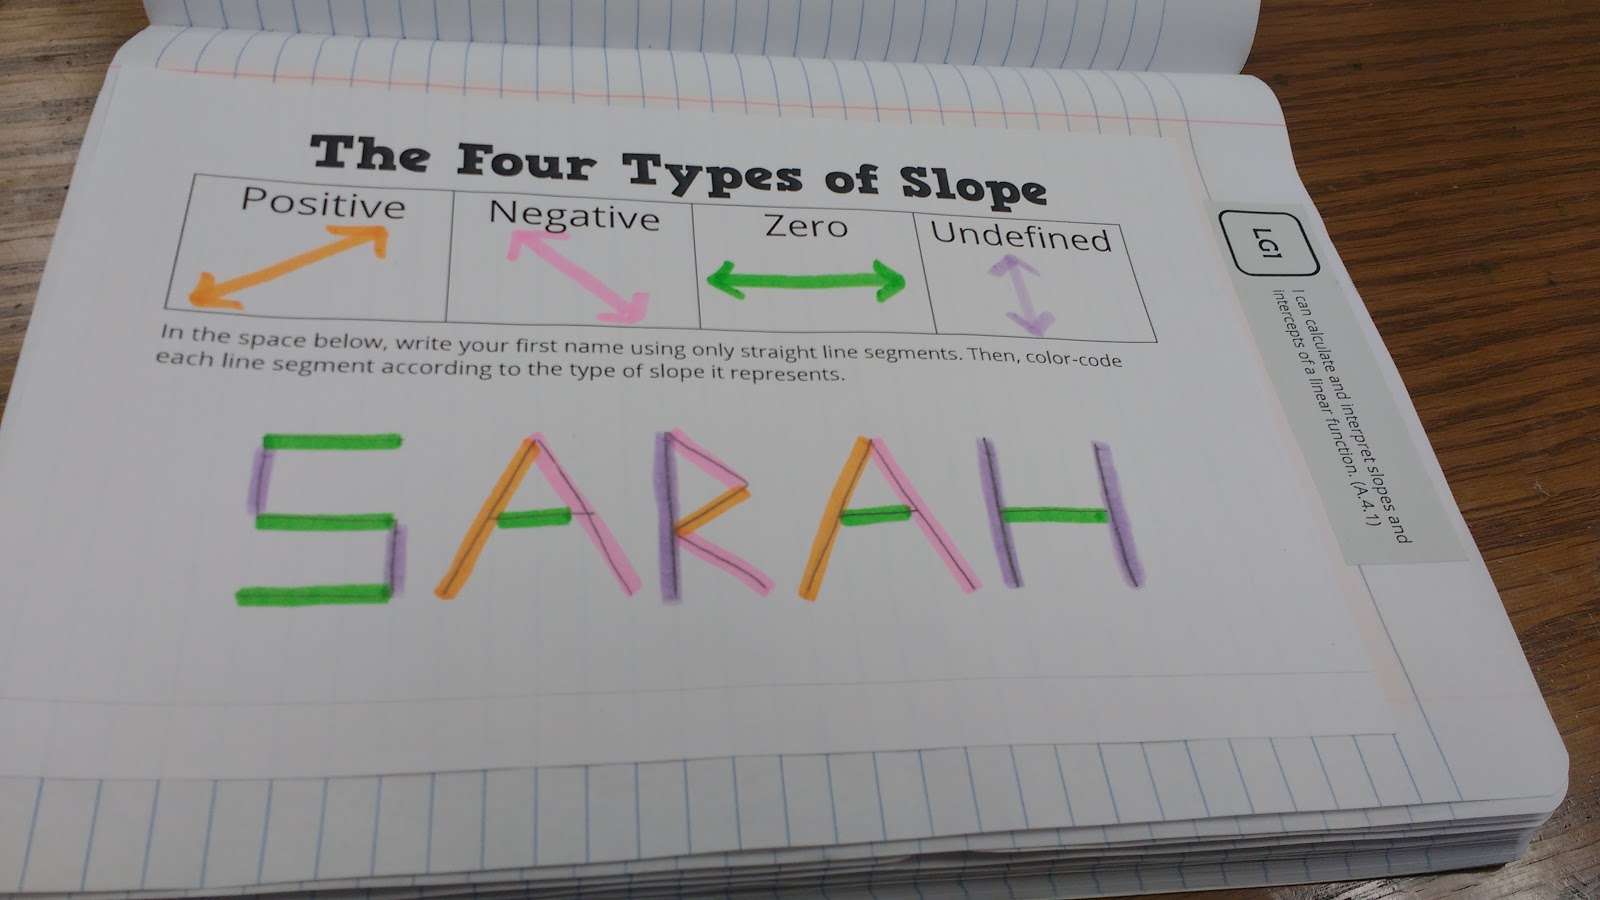
Four Types of Slope Graphic Organizer
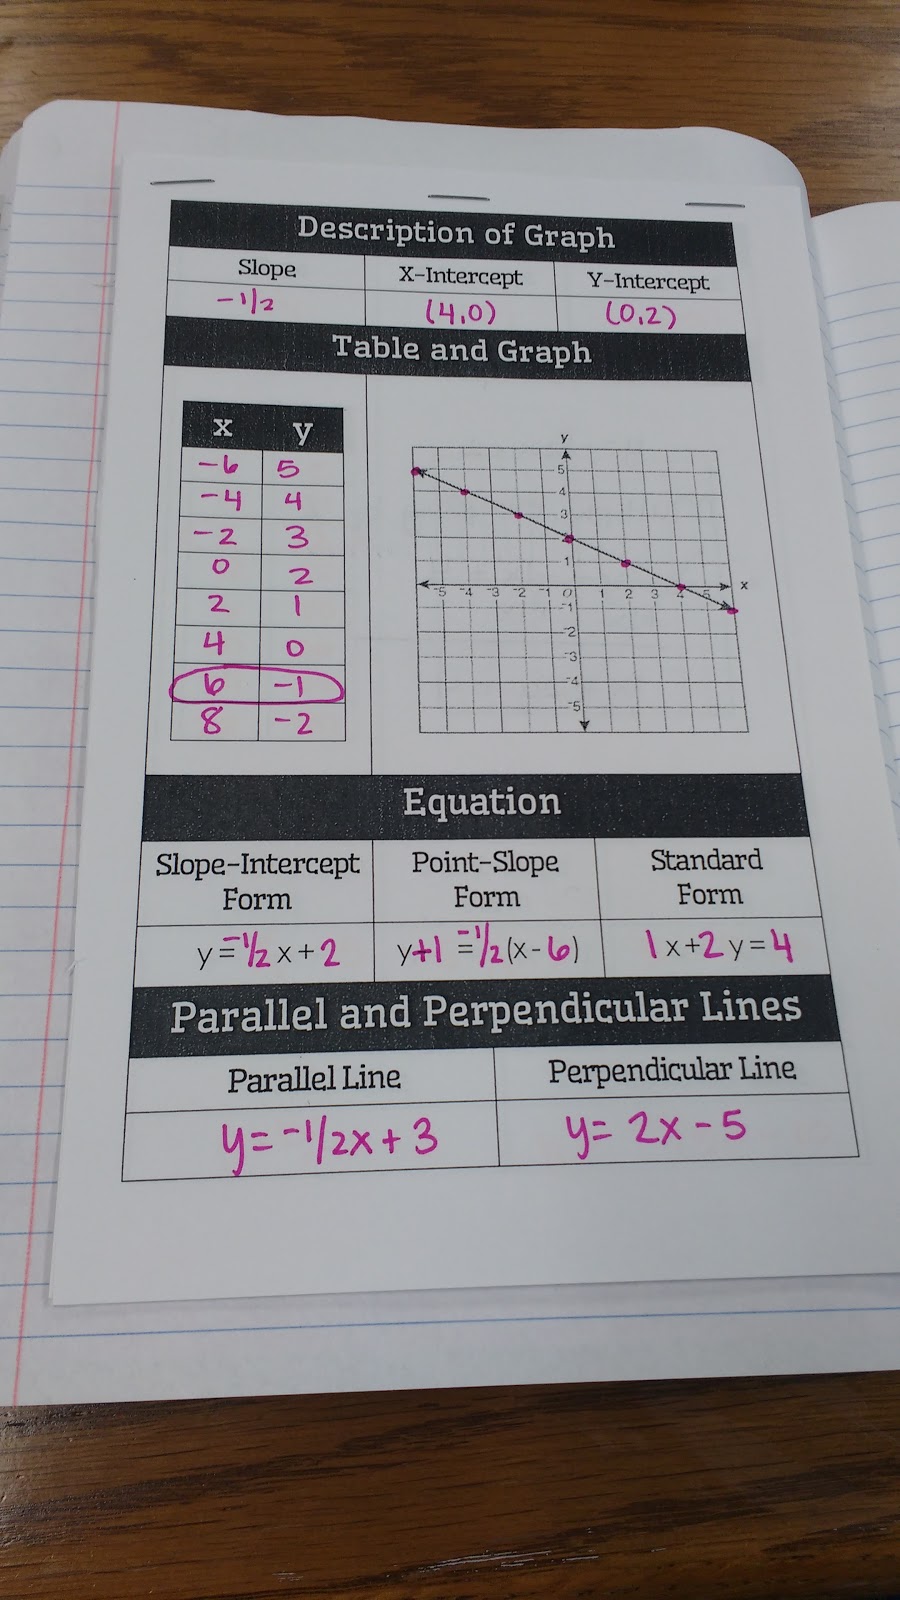
Writing Linear Equations Graphic Organizer
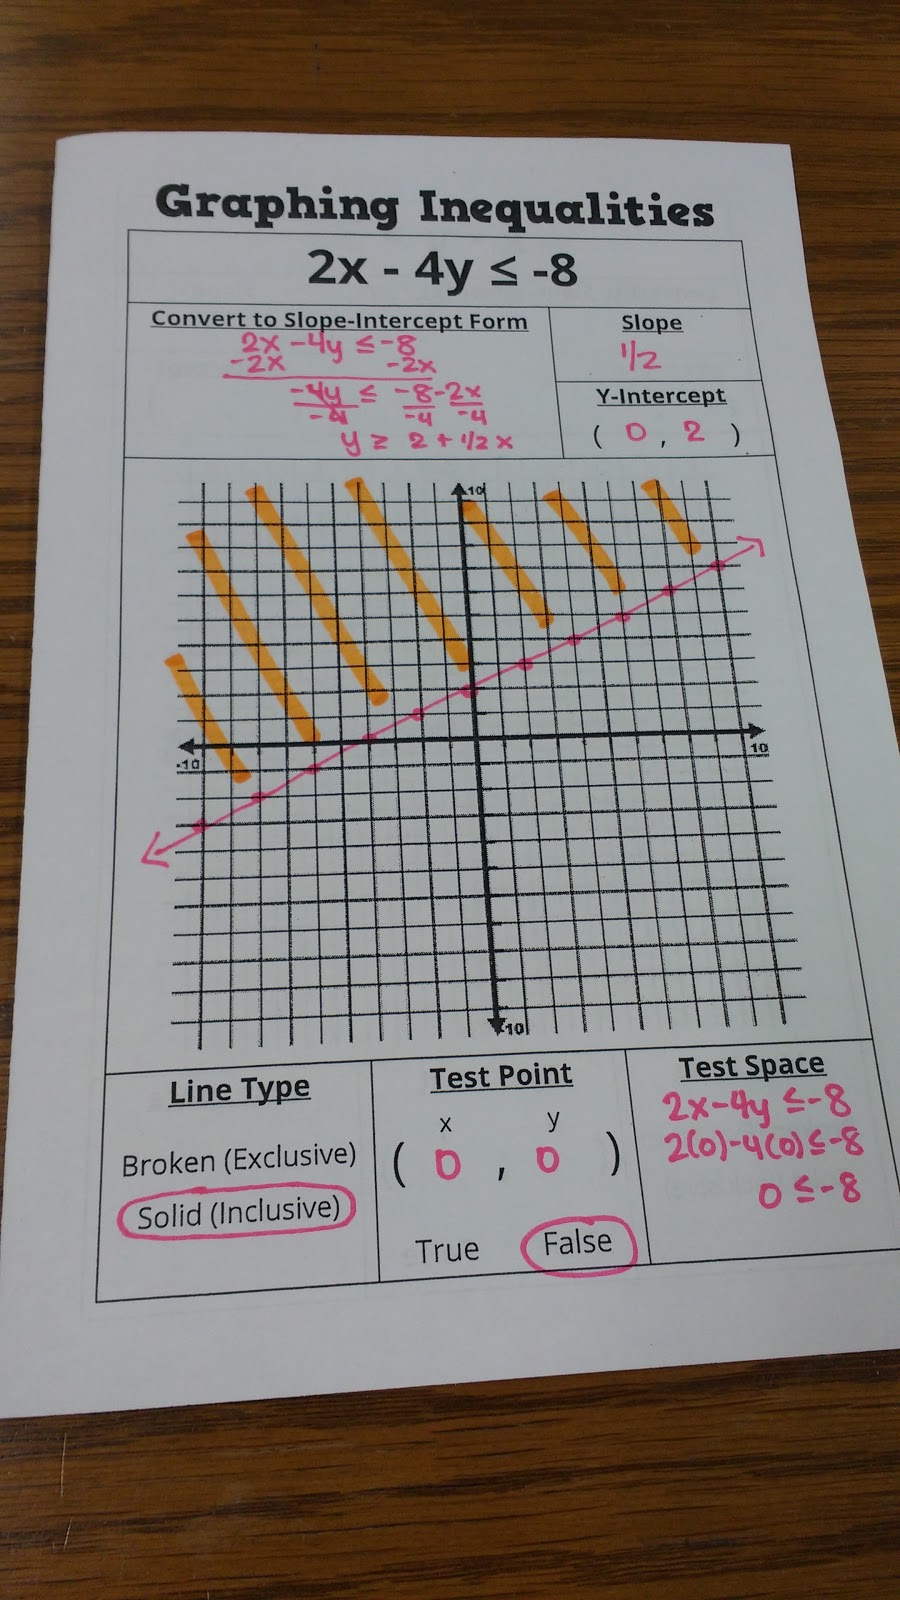
Graphing Linear Inequalities Foldable
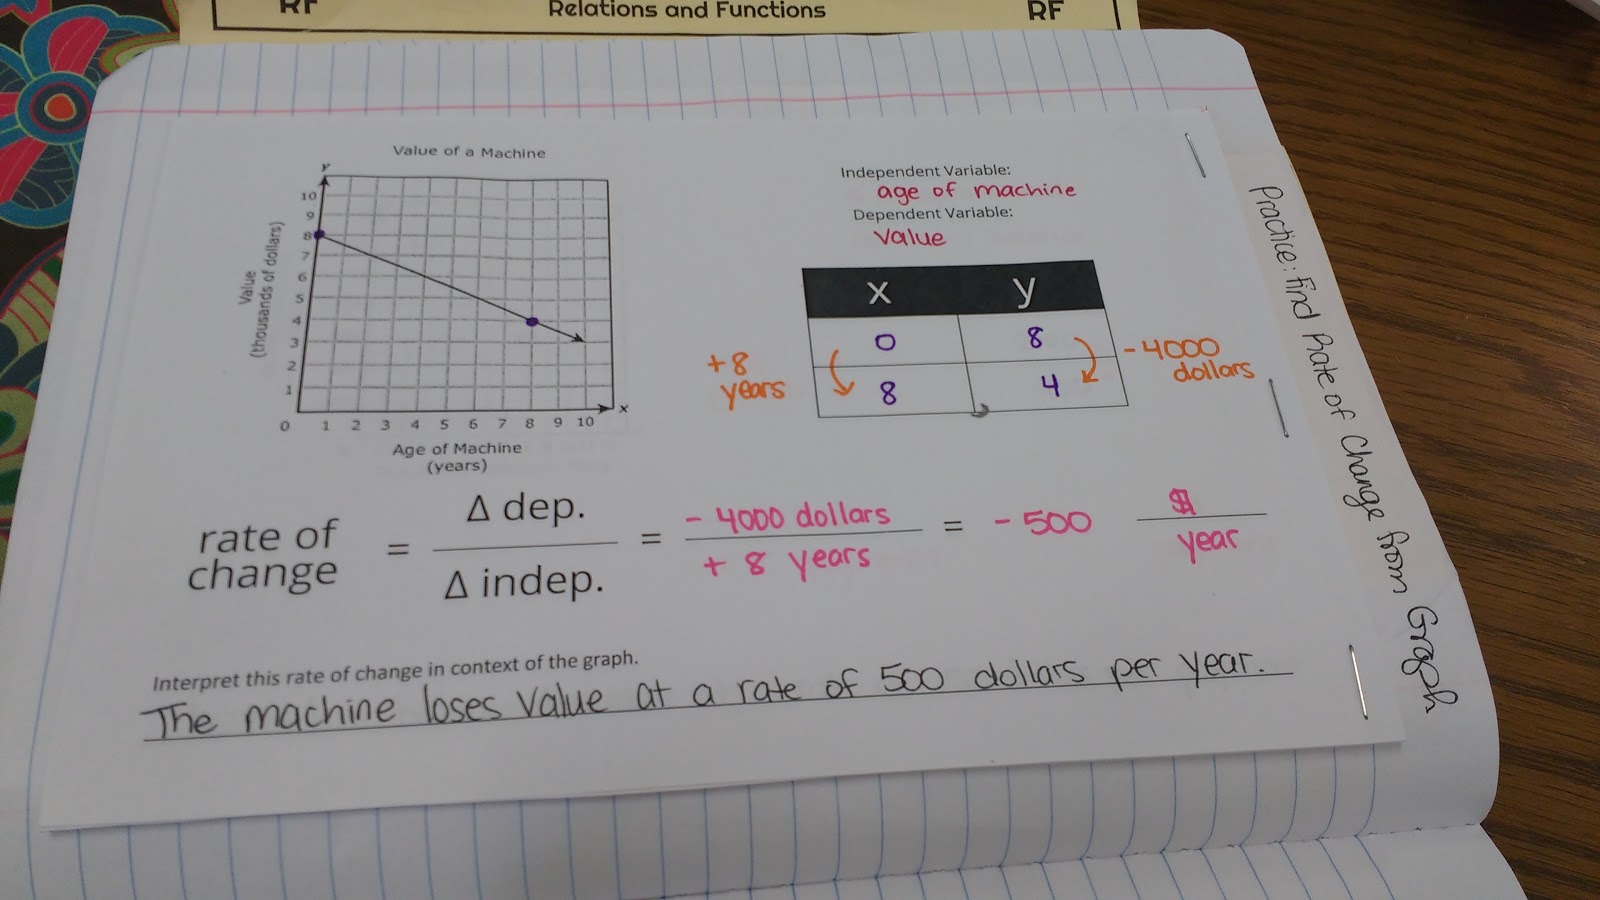
Rate of Change Graphic Organizer and Practice Problems
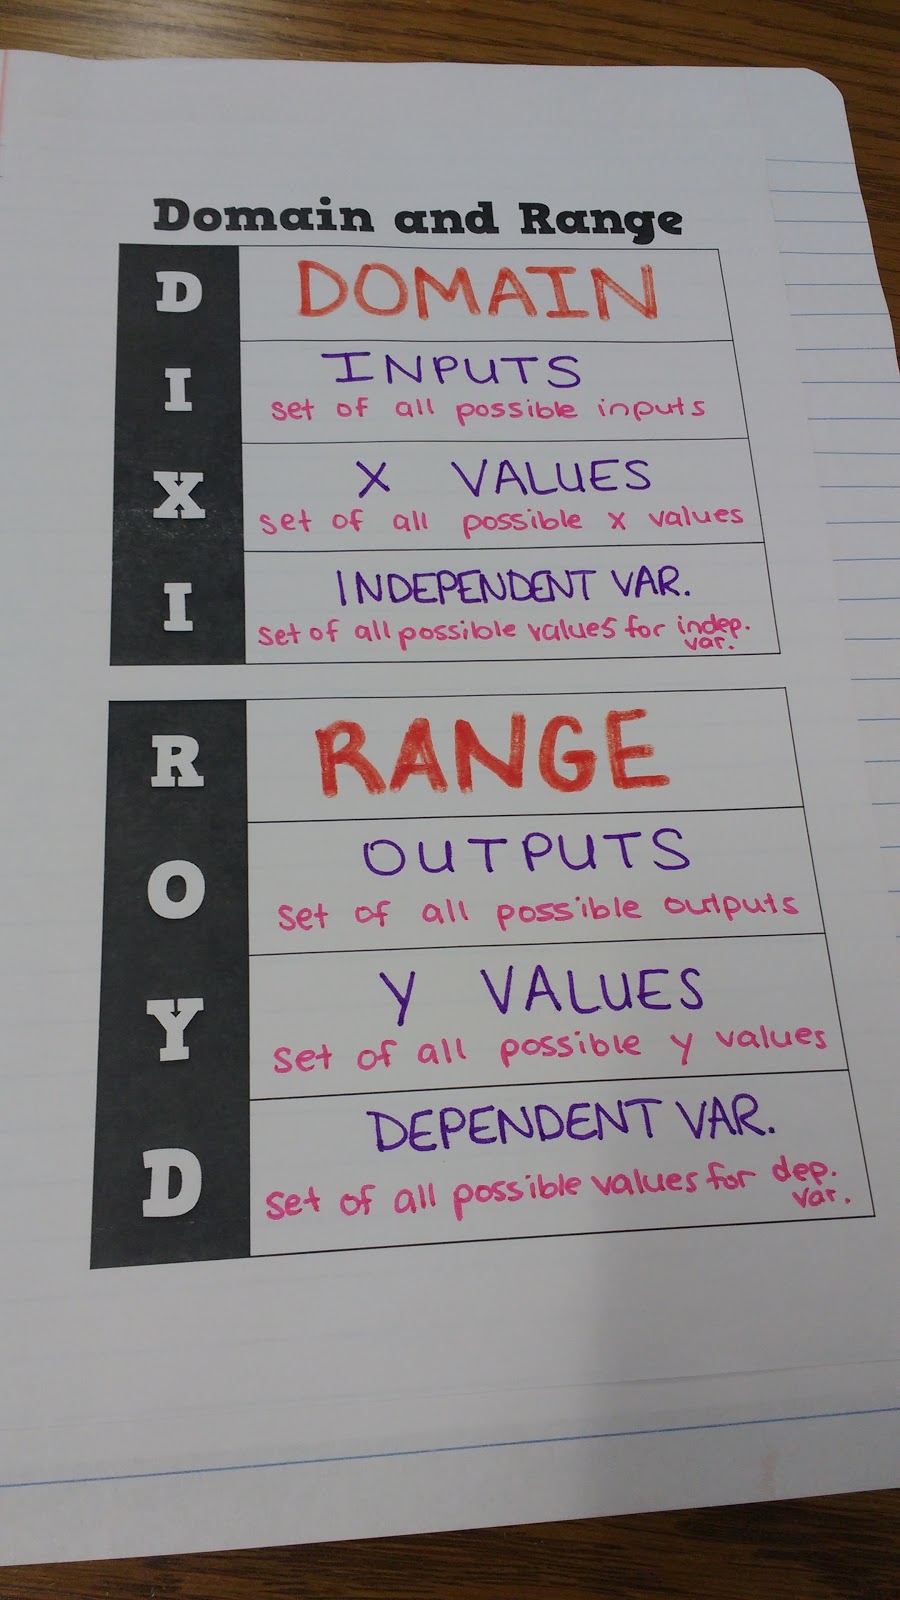
Domain and Range Graphic Organizer DIXI ROYD
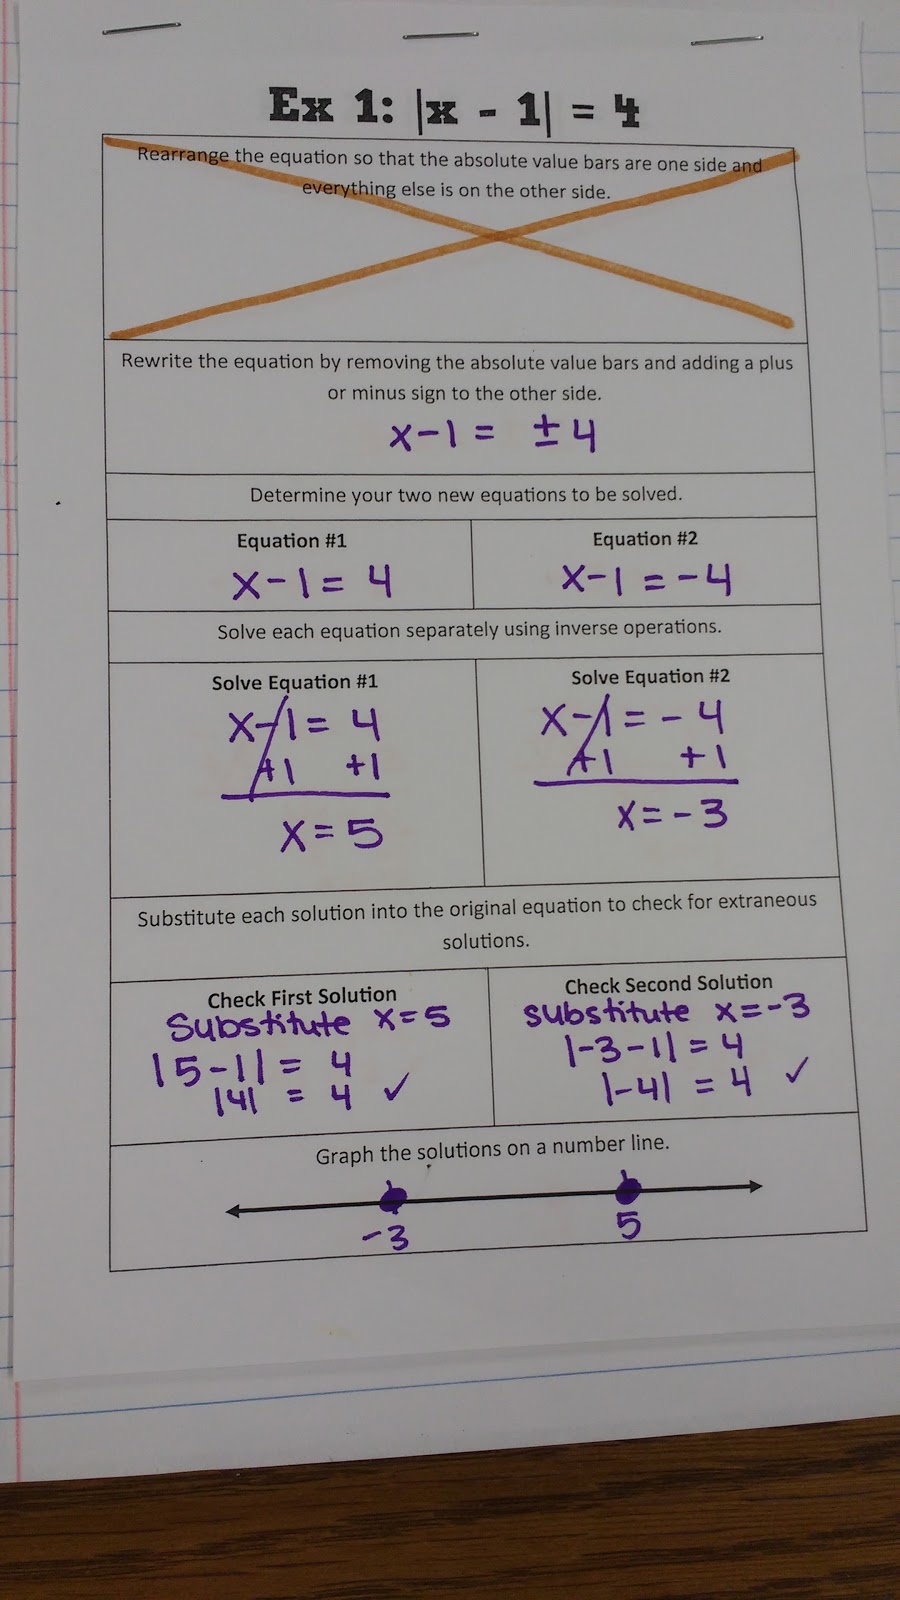
Solving Absolute Value Equations Graphic Organizers
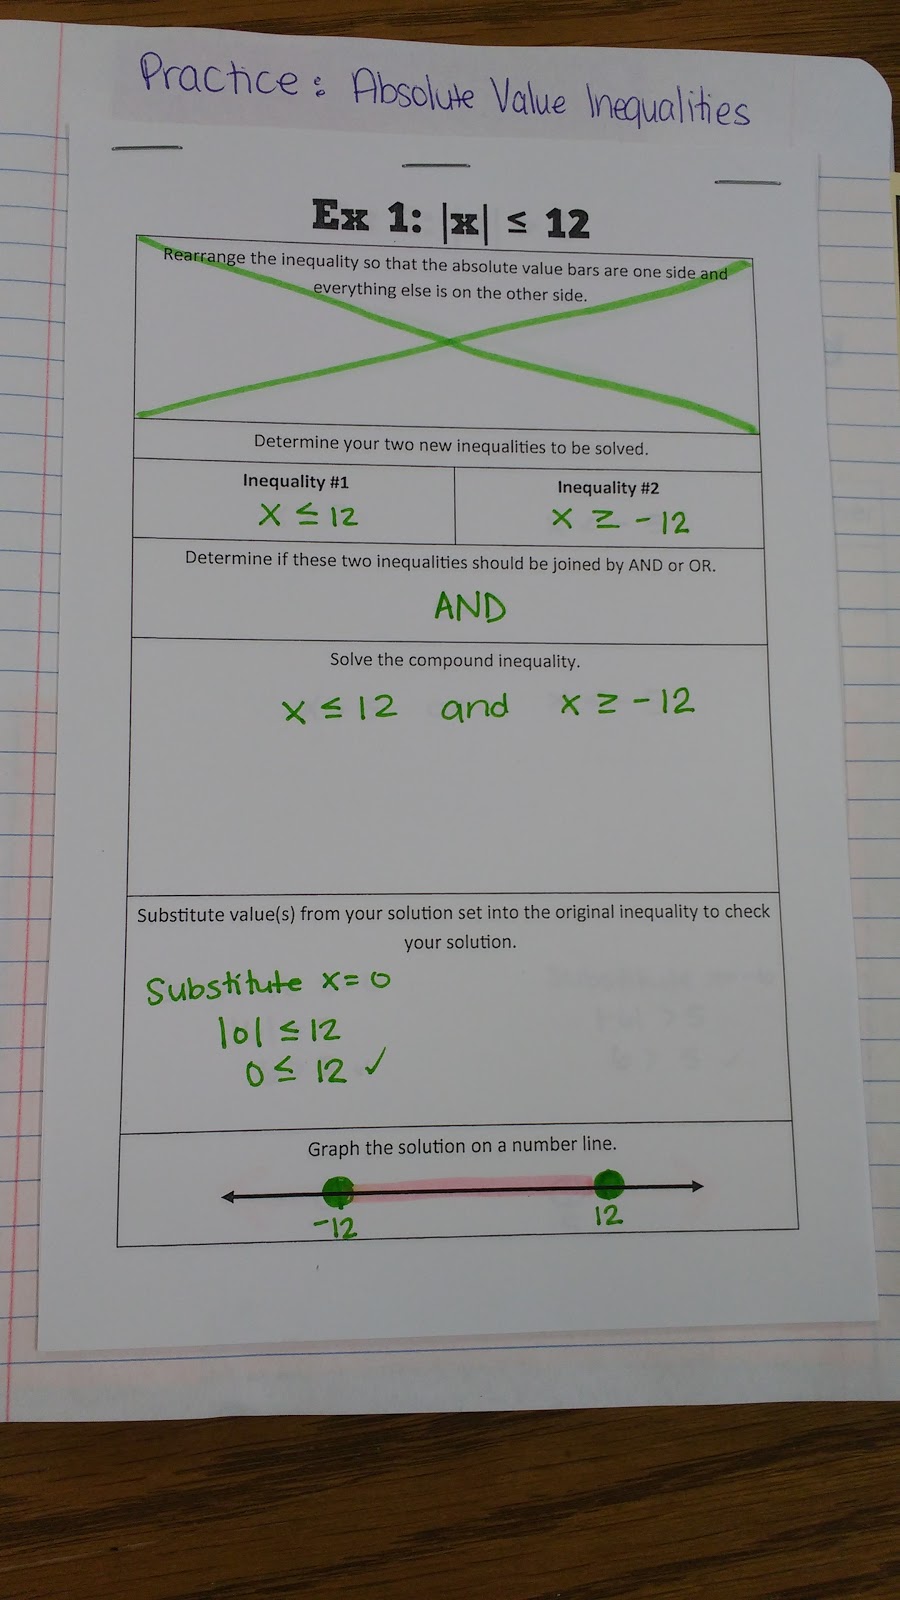
Solving Absolute Value Inequalities Graphic Organizers
Solving Equations/Inequalities with Variables on Both Sides Graphic Organizers
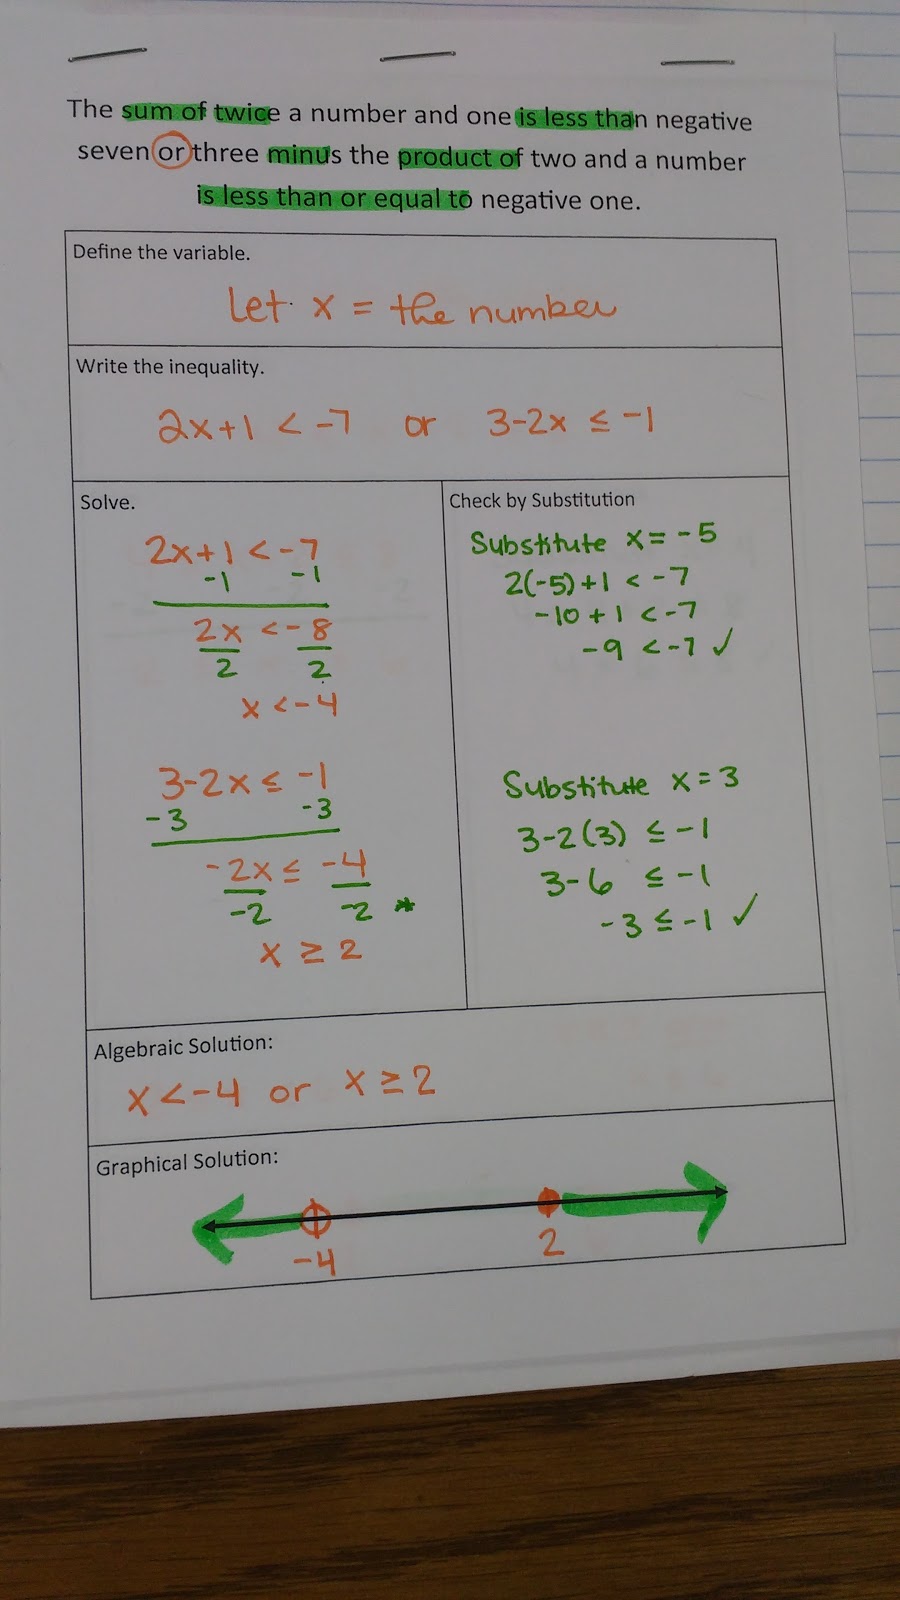
Compound Inequalities Graphic Organizers
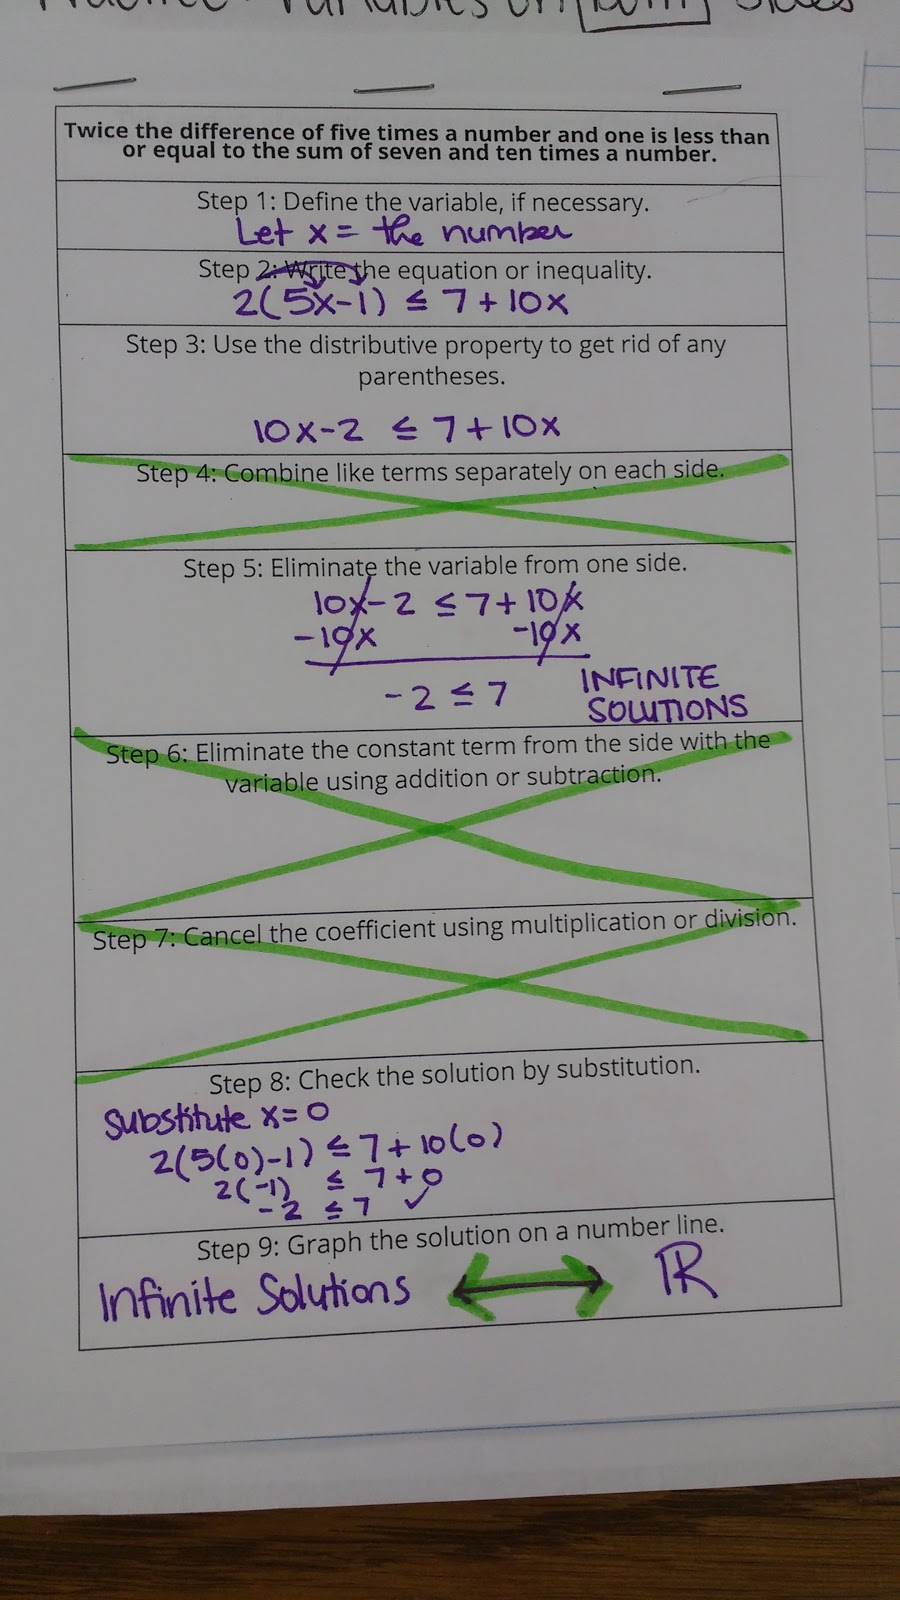
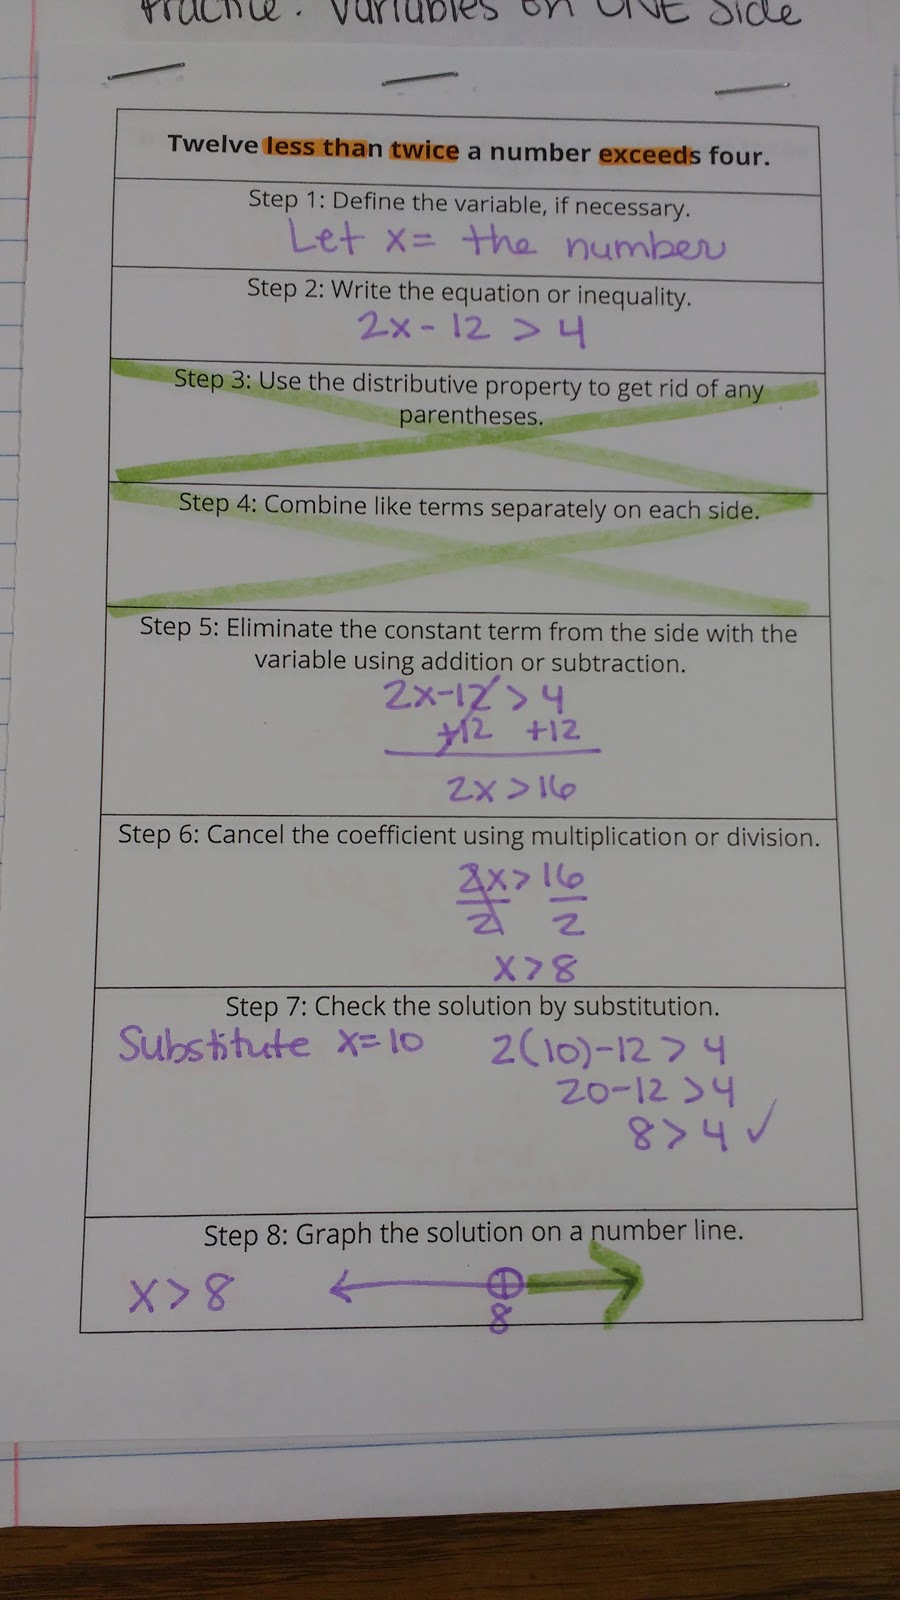
Solving Equations/Inequalities with Variables On One Side Graphic Organizers
Inequalities Investigation
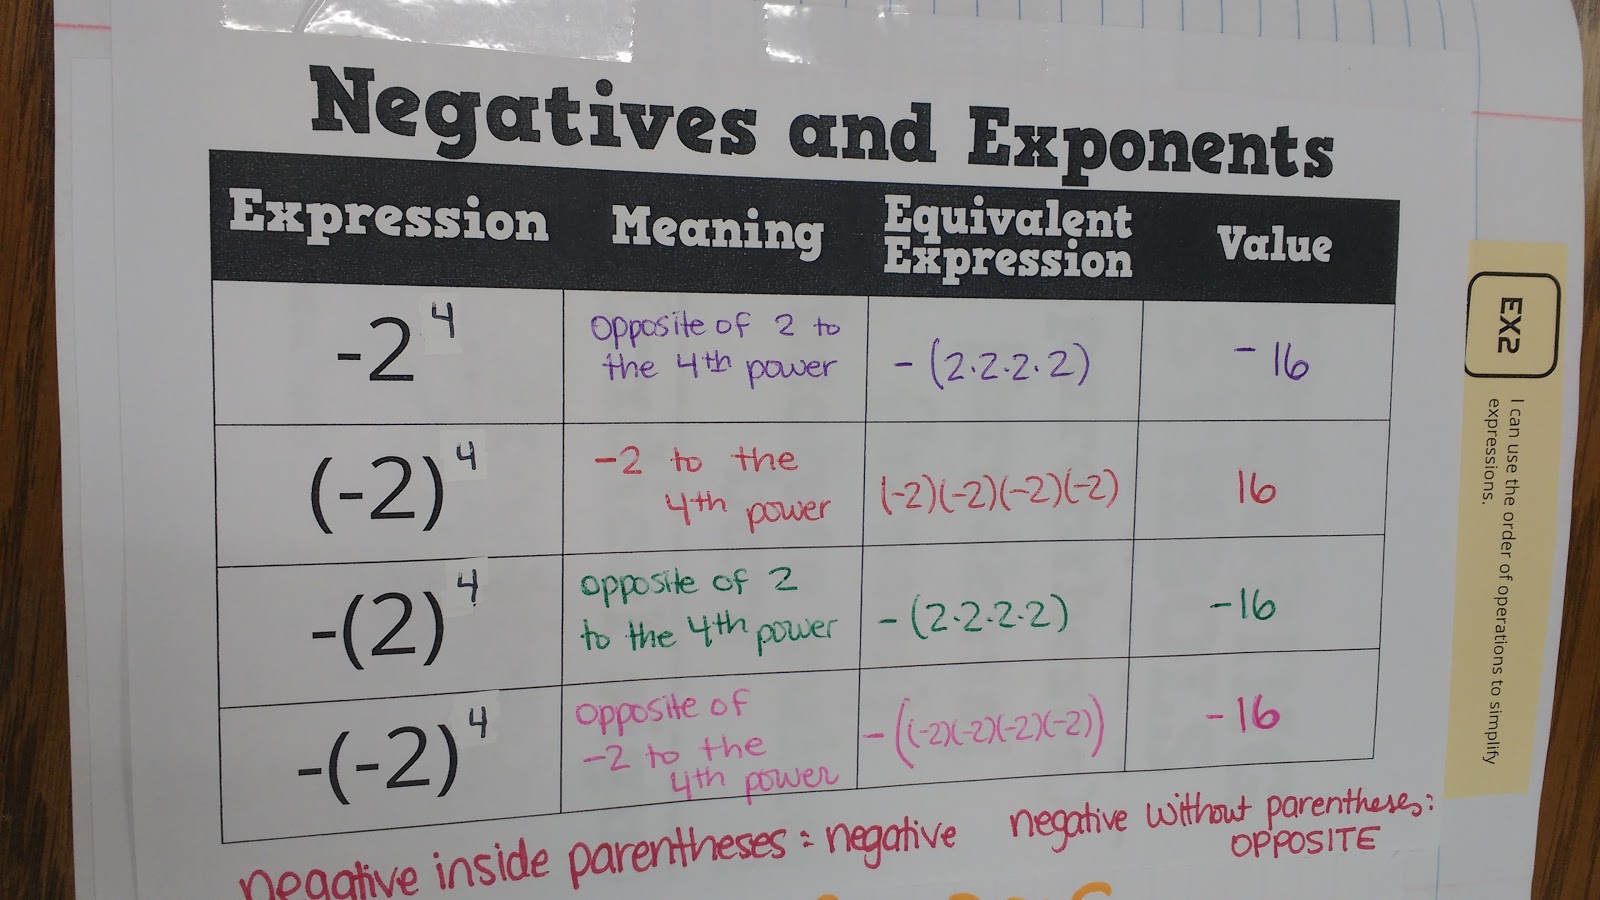
Negatives and Exponents Graphic Organizer
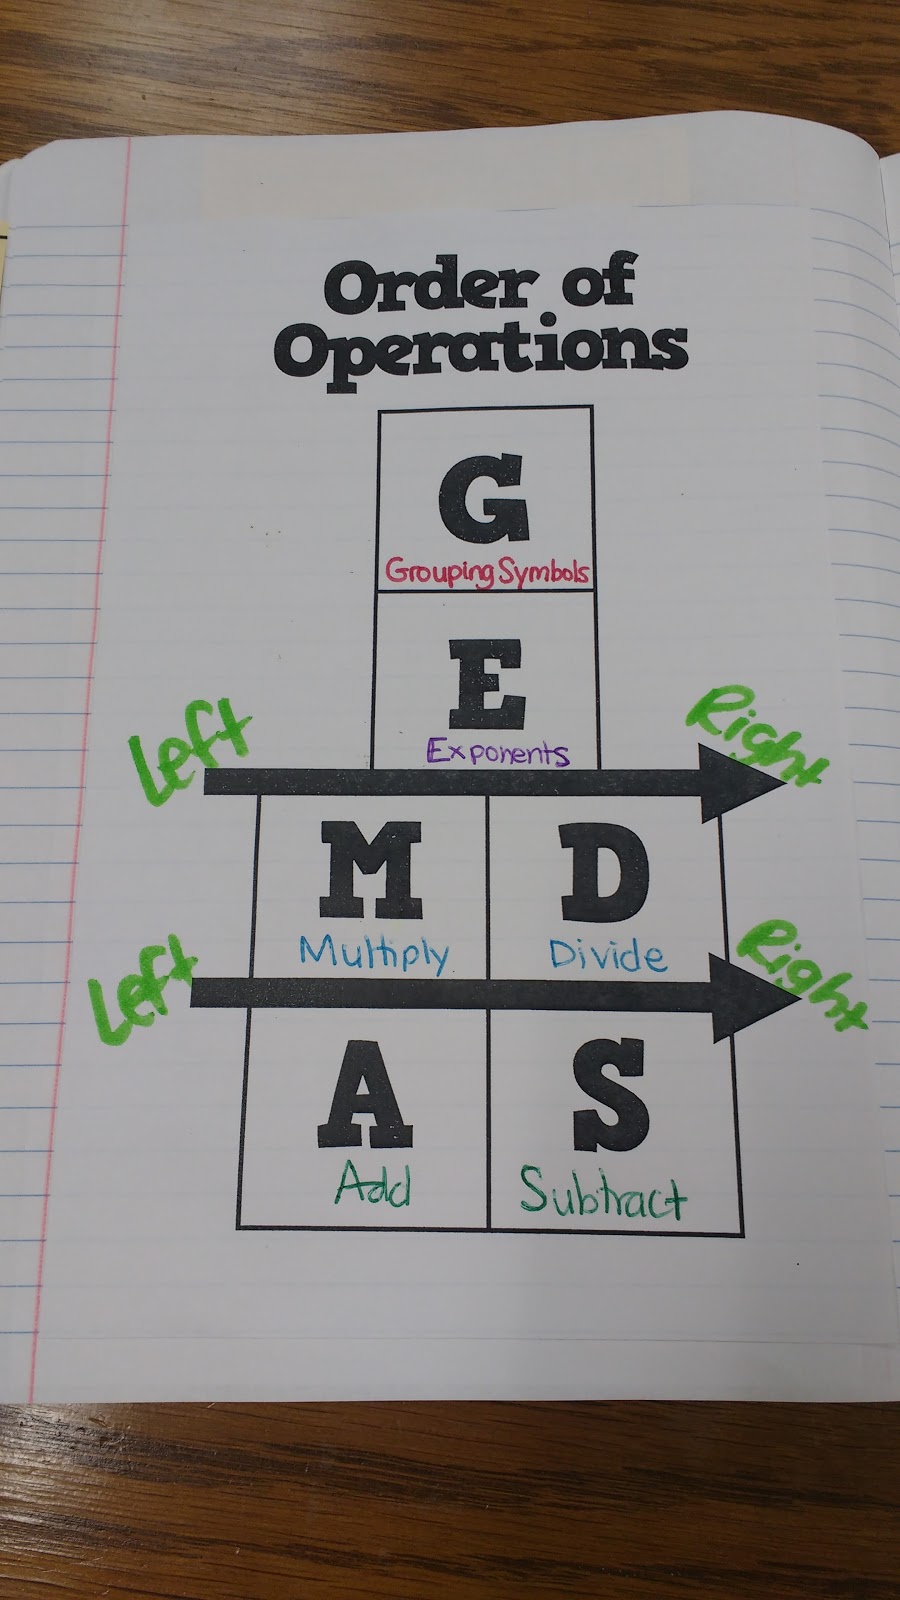
Order of Operations Graphic Organizer with Grouping Symbols
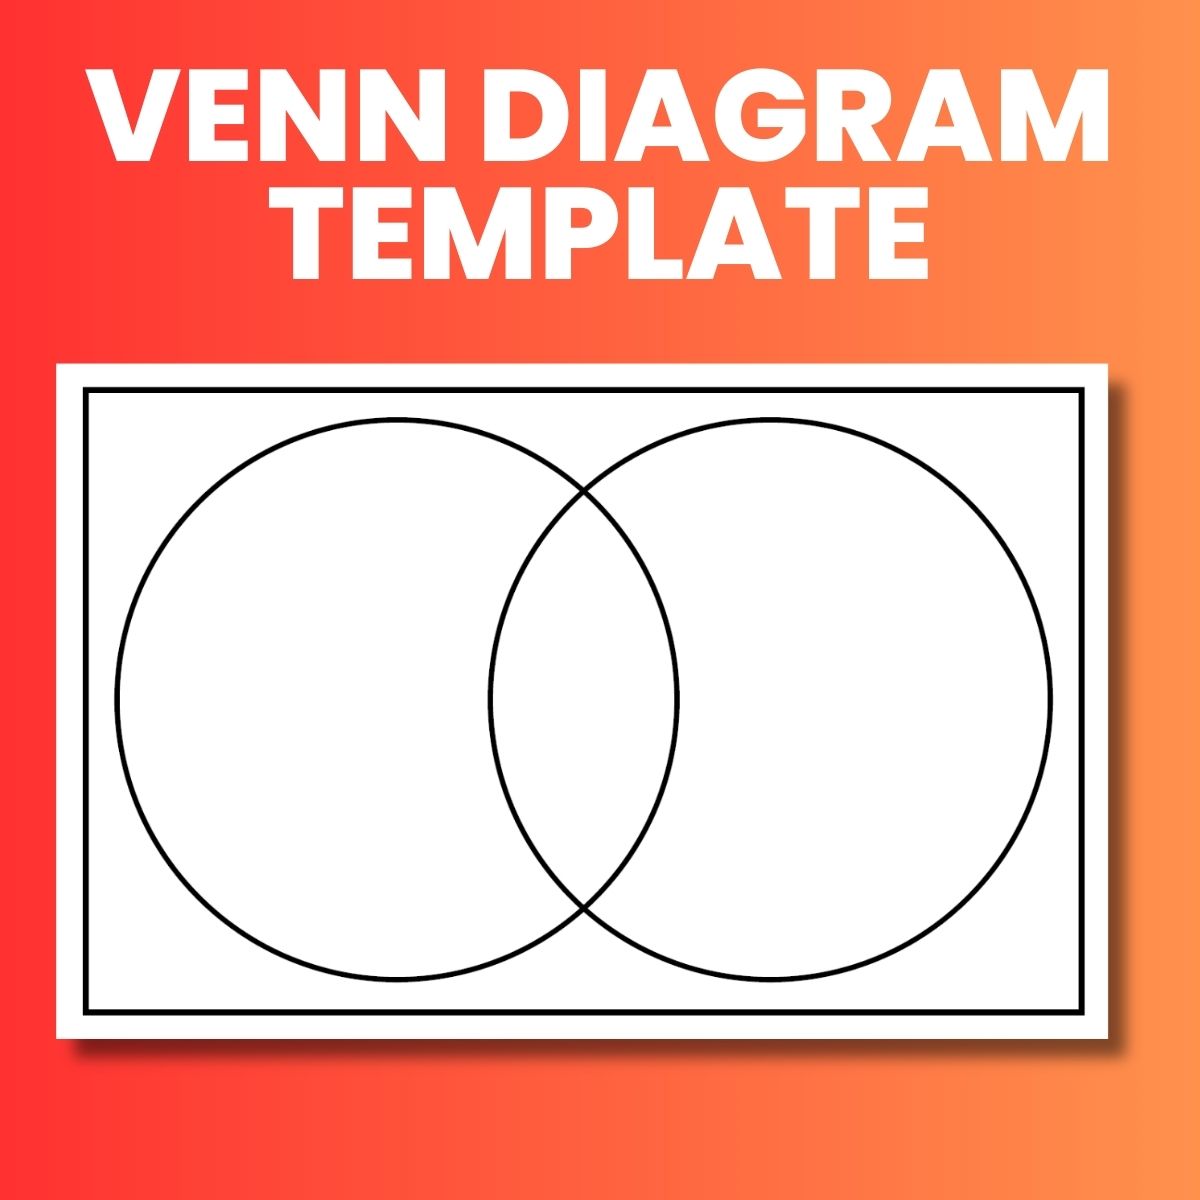
Venn Diagram Template (2 Circles)
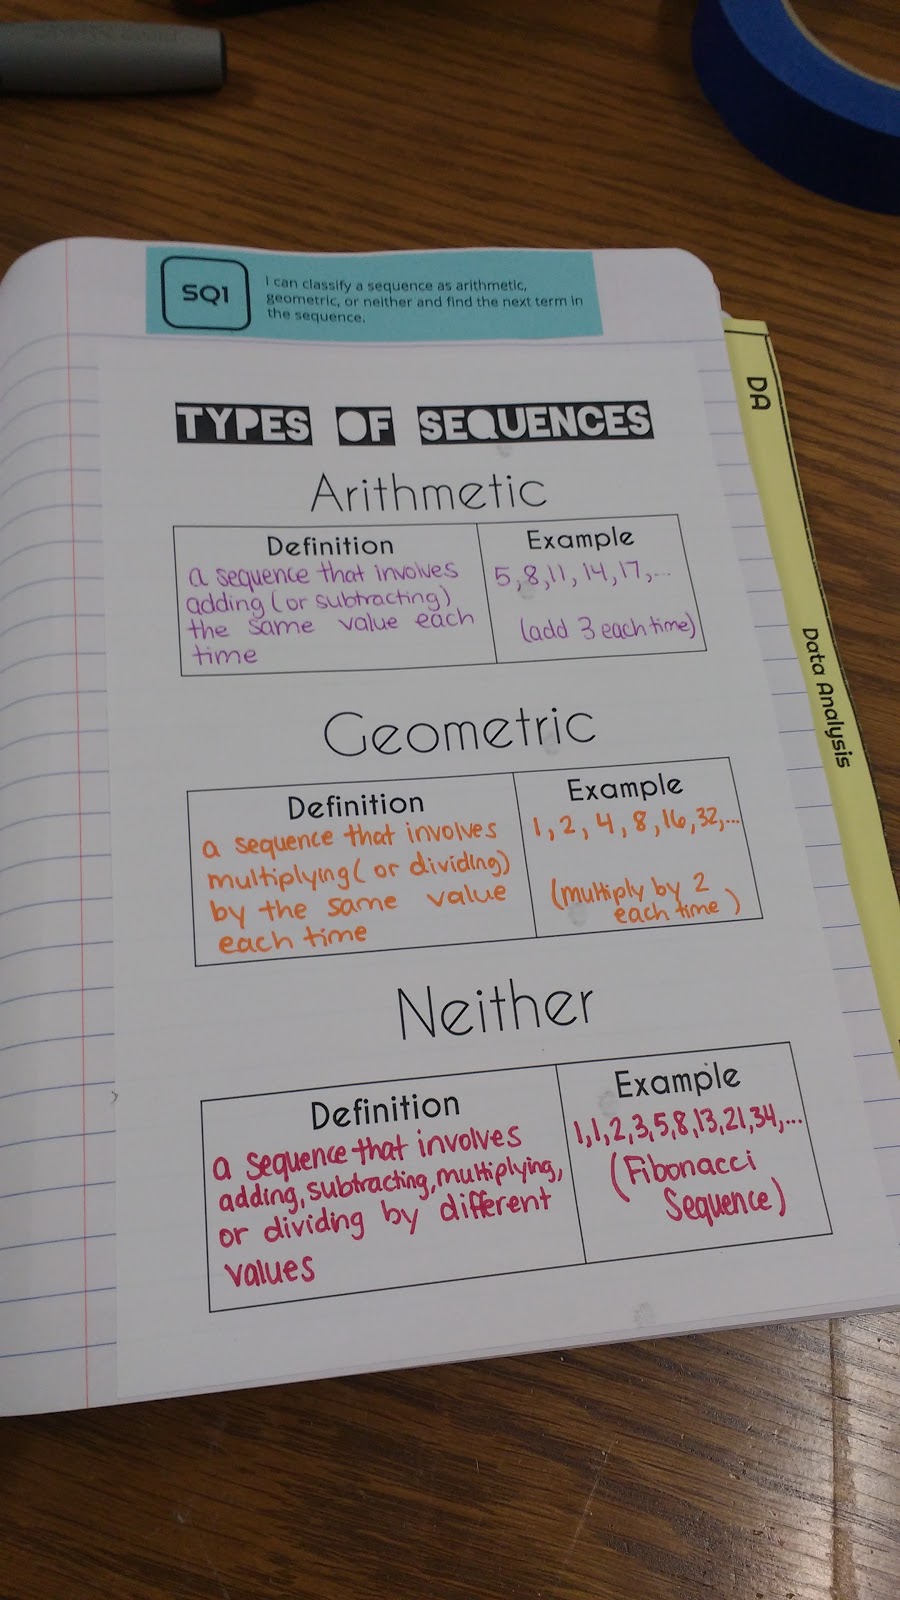
Types of Sequences Graphic Organizer
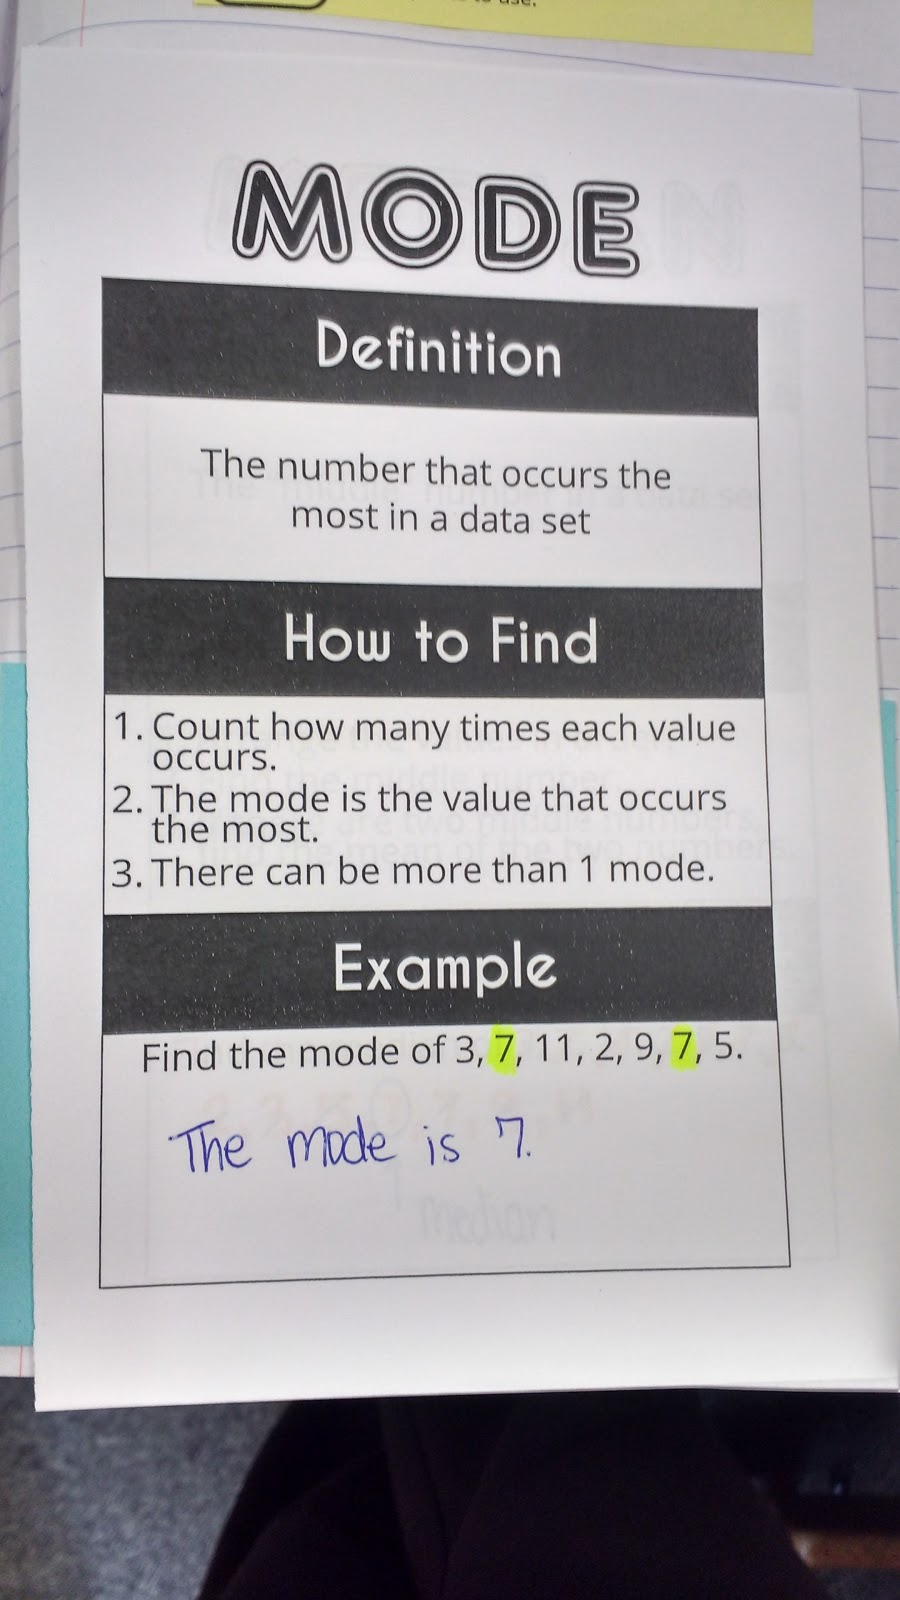
Measures of Central Tendency Graphic Organizers
Looking for Patterns in Factoring Quadratics
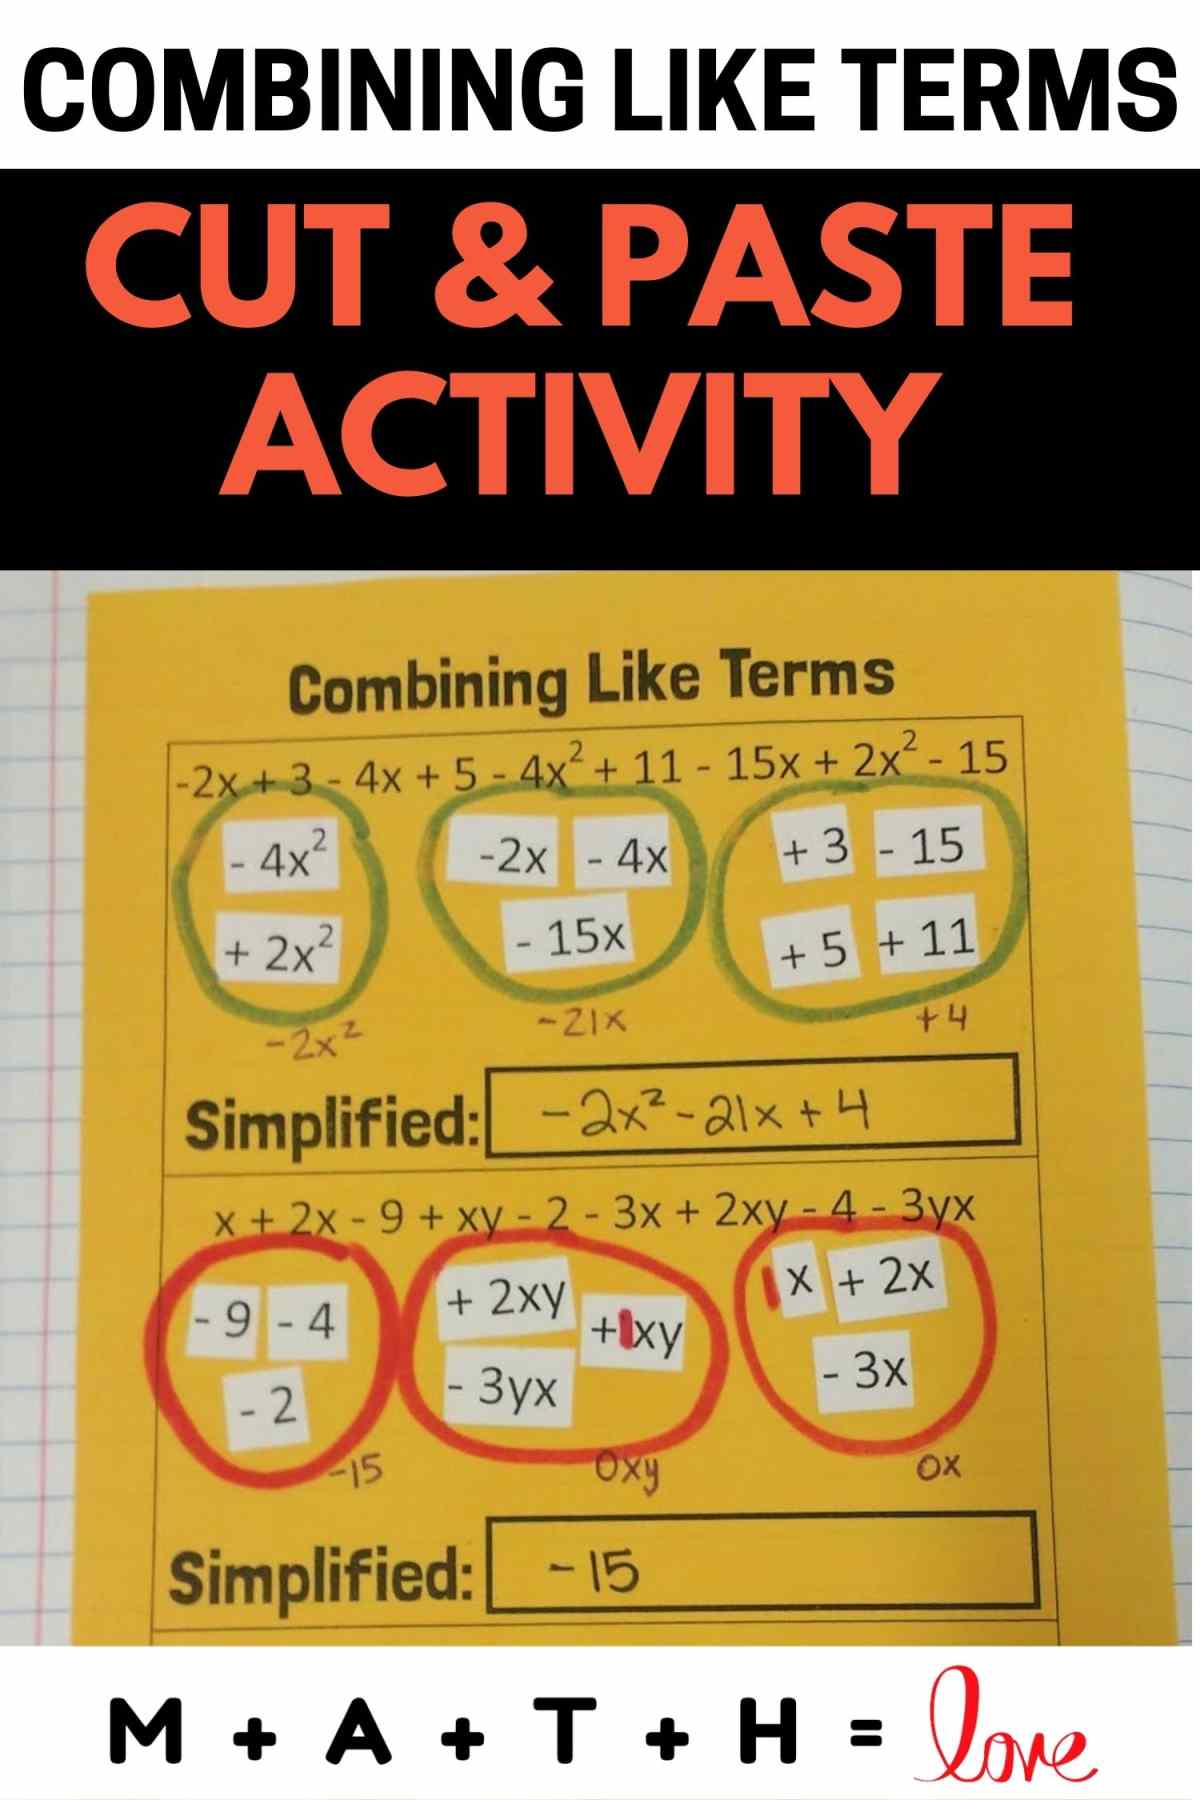
Combining Like Terms Cut and Paste Activity
Page navigation
1
2
3
Next Page
Next
Scroll to top
Scroll to top
About
Toggle child menu
Expand
About Me
Puzzles
Toggle child menu
Expand
All Printable Puzzles
Math Puzzles
Logic Puzzles
Seasonal and Holiday Puzzles
Word Puzzles
Hands-On Puzzles
Mazes
Puzzle Solutions
Answer Key Database
Resources
Toggle child menu
Expand
Sort by Season or Holiday
Sort by Theme
Sort by Grade Level
Toggle child menu
Expand
Lower Elementary K-2
Upper Elementary 3-5
Middle School 6-8
High School 9-12
Sort by Math Topic
Toggle child menu
Expand
Number & Operations
Algebra & Functions
Geometry & Measurement
Statistics & Probability
Trigonometry
Calculus
Toggle Menu Close
Search for:
Search