Measures of Central Tendency Graphic Organizers
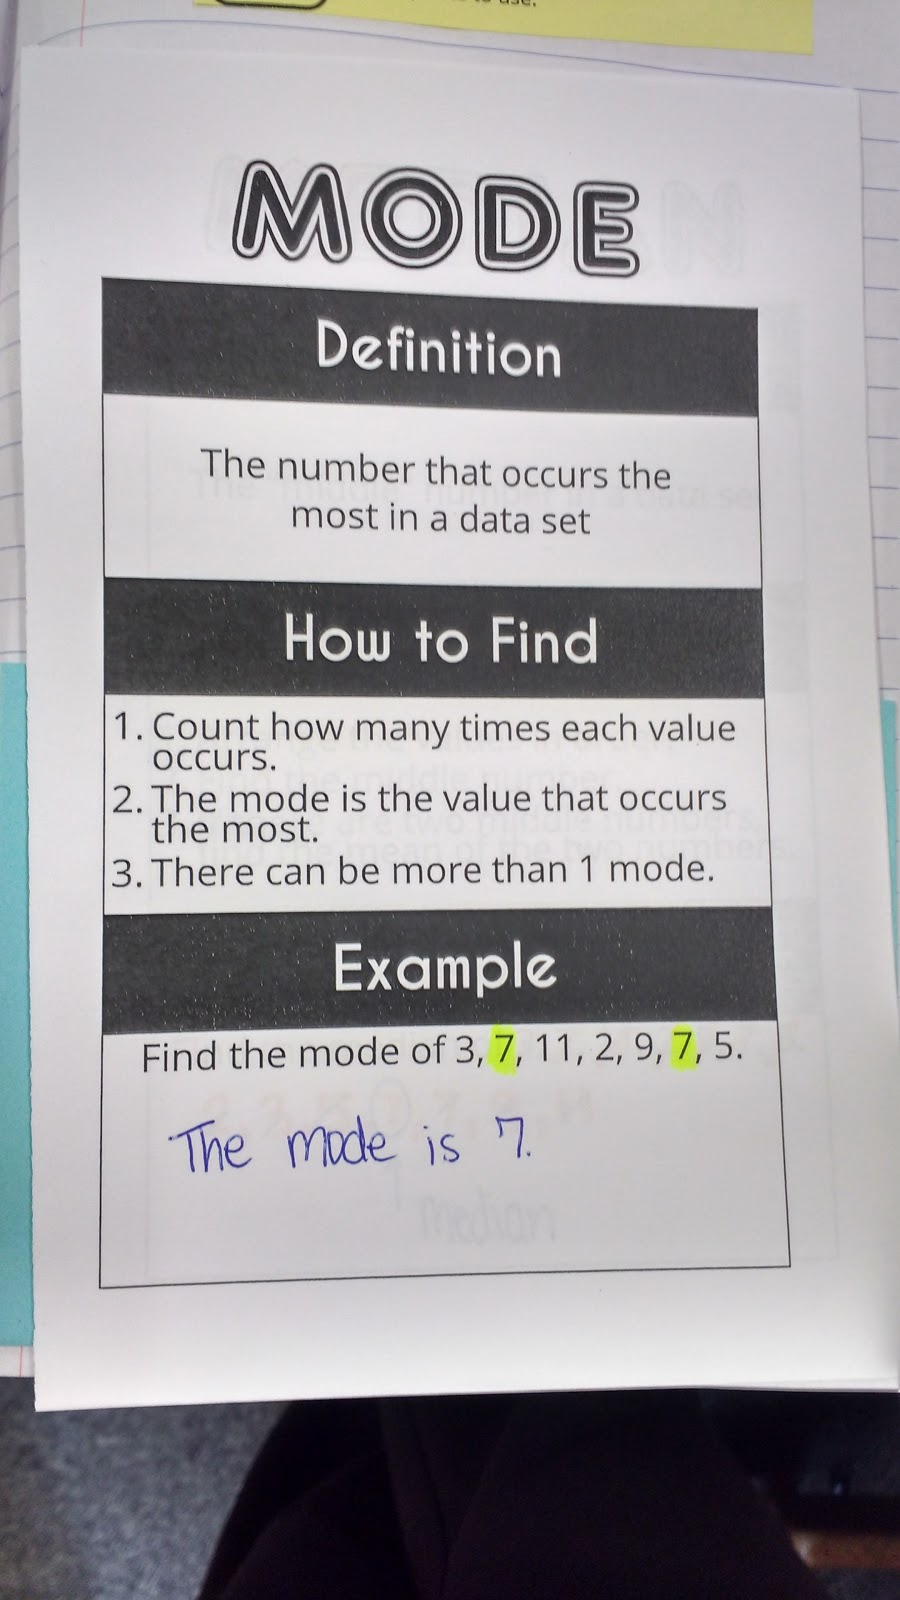
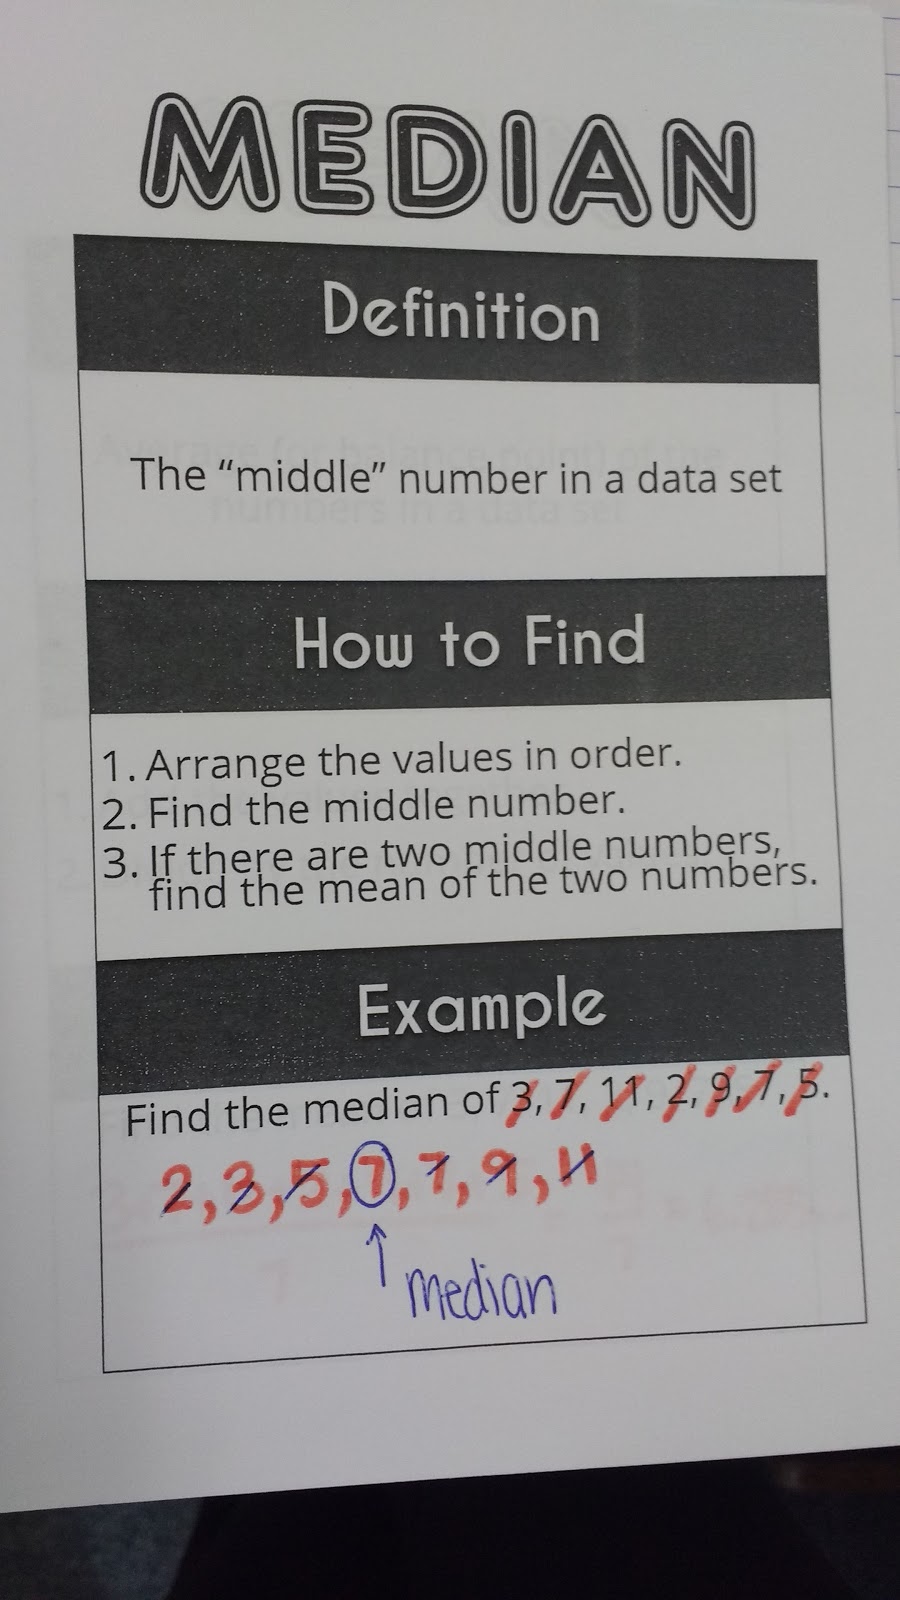
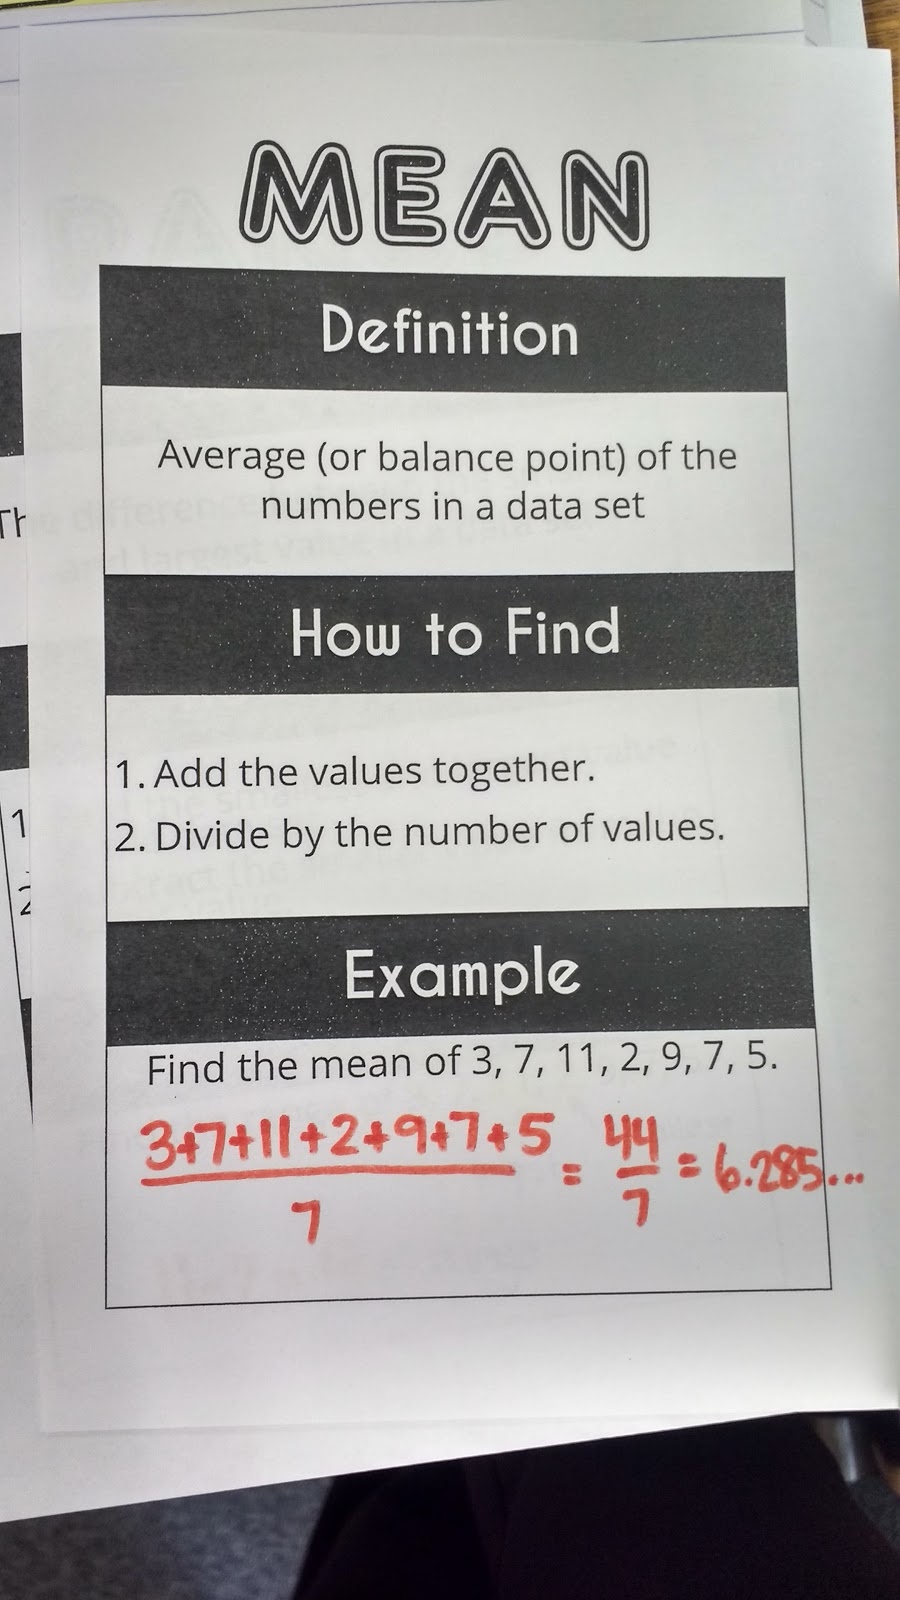
I created these measures of central tendency graphic organizers for my Algebra 1 students to review how to find mean, median, mode, and range at the beginning of our data analysis unit.
If you’ve been paying attention, you might have caught a sneak peek of these notes over finding mean, median, mode, and range in my blog post about creating pockets for your interactive notebooks.
When my Algebra 1 students found out that our next unit was starting out with a review of finding mean, median, mode, and range, they promptly informed me that we didn’t need to review it because they’ve been learning about it since the fifth grade. Given how often I have had students reference these notes, I will say that I do think they needed the review!
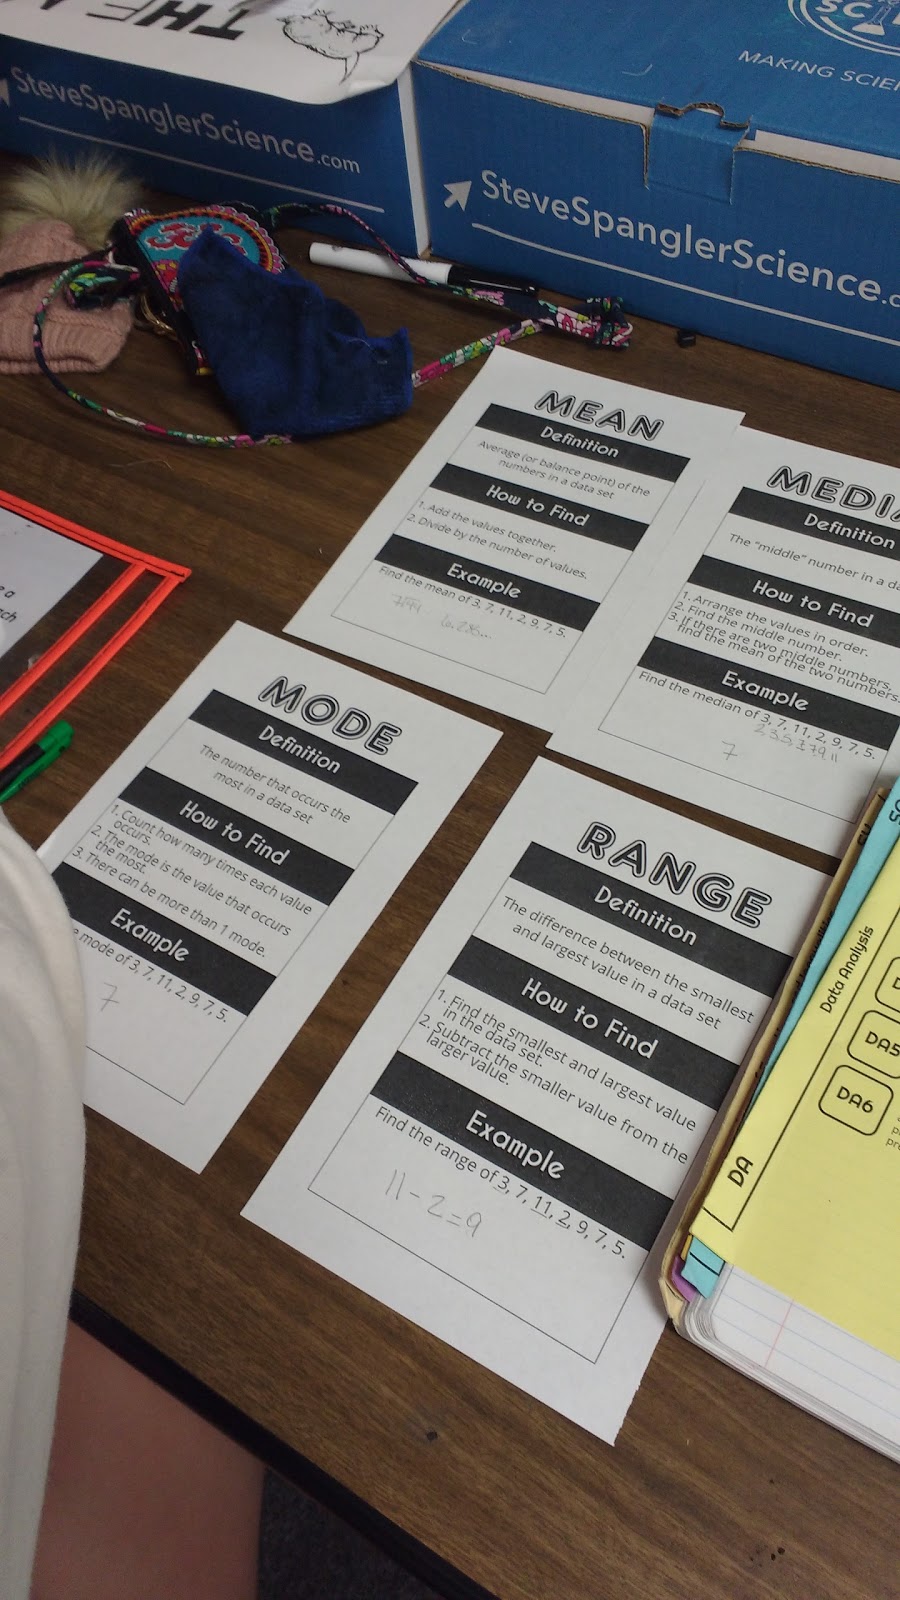
Our notes for mean, median, mode, and range were placed in a nifty pocket. Some students chose not to make a pocket and instead stapled the pages together at the top and glued in the bottom sheet. I told them that they could put them in their notebook using whichever method they preferred.
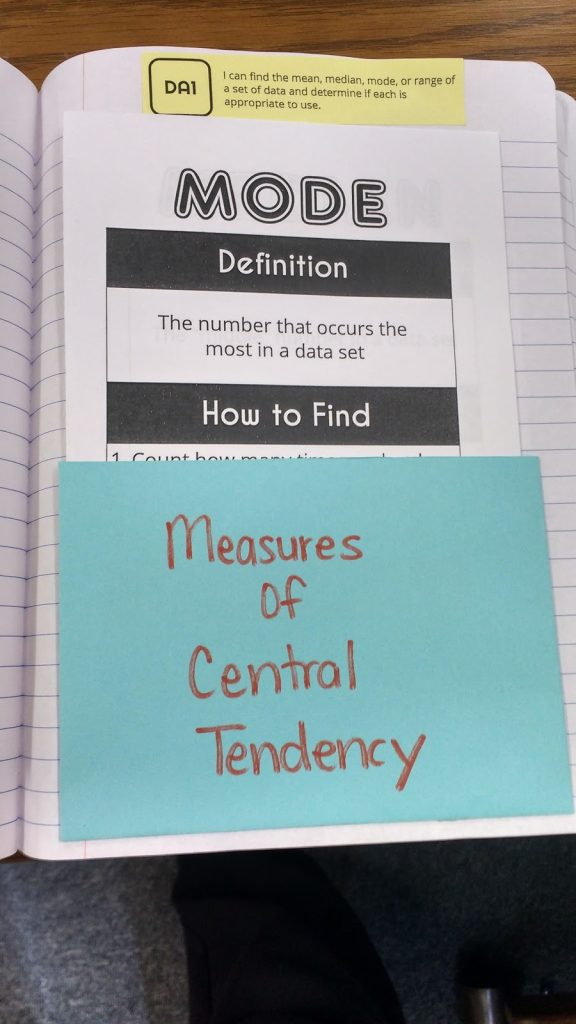
Mode Graphic Organizer
Median Graphic Organizer
Mean Graphic Organizer
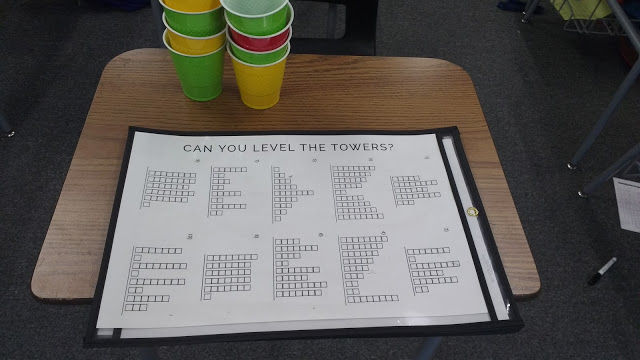
I had my students do a Don Steward activity called Can You Level the Towers? to get them thinking about mean before we started these. Of course, the puzzle didn’t mention the word mean anywhere on it.
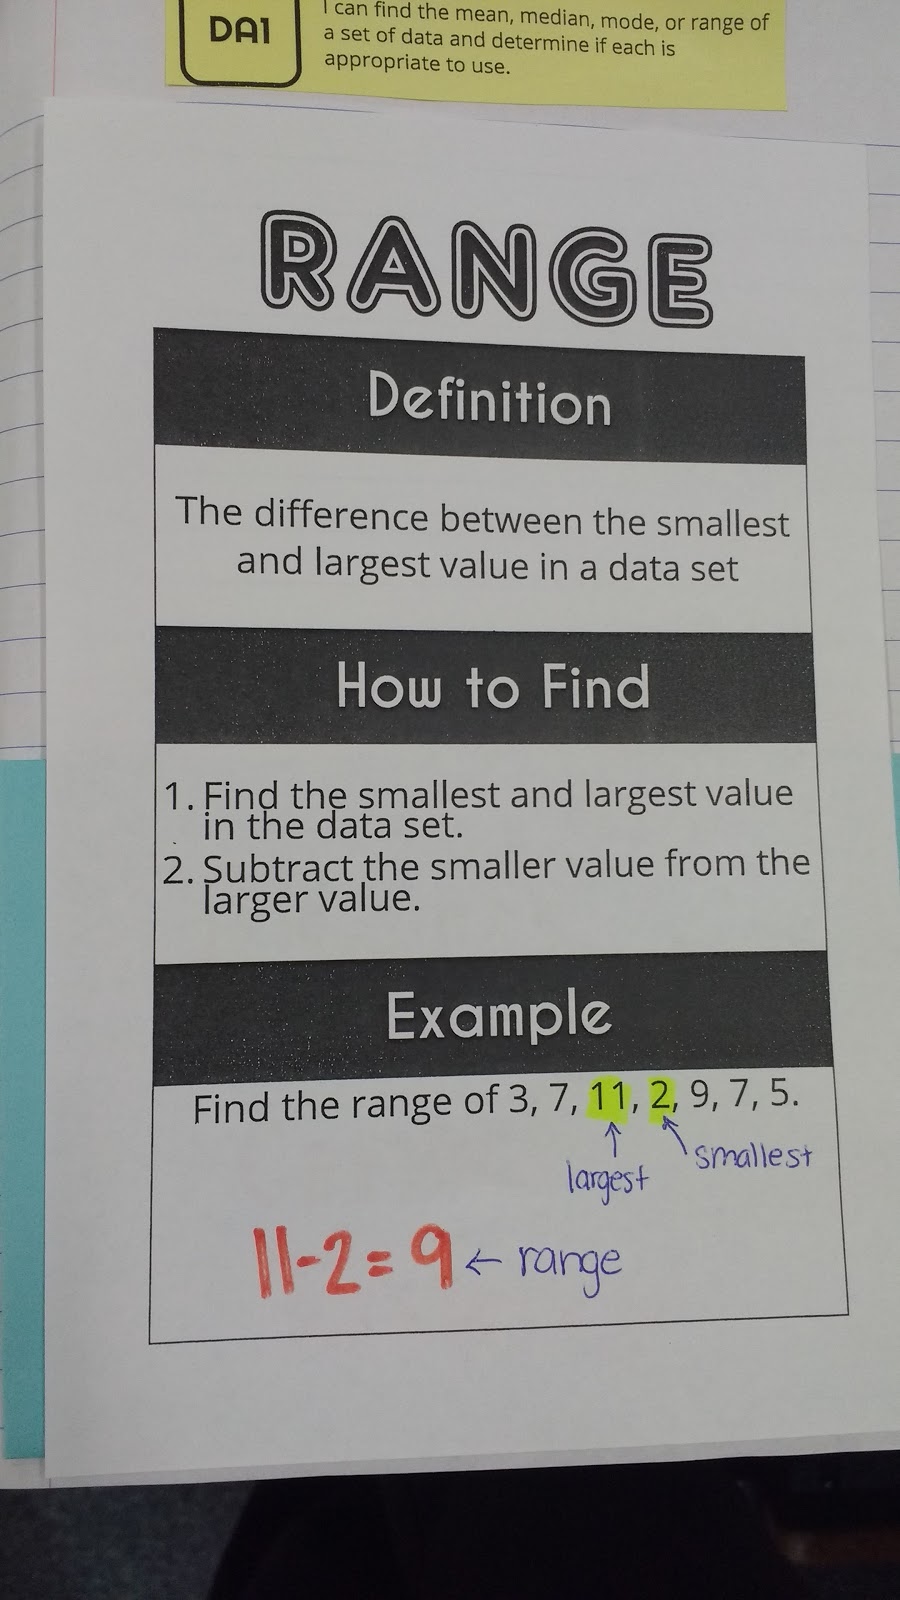
Range Graphic Organizer
