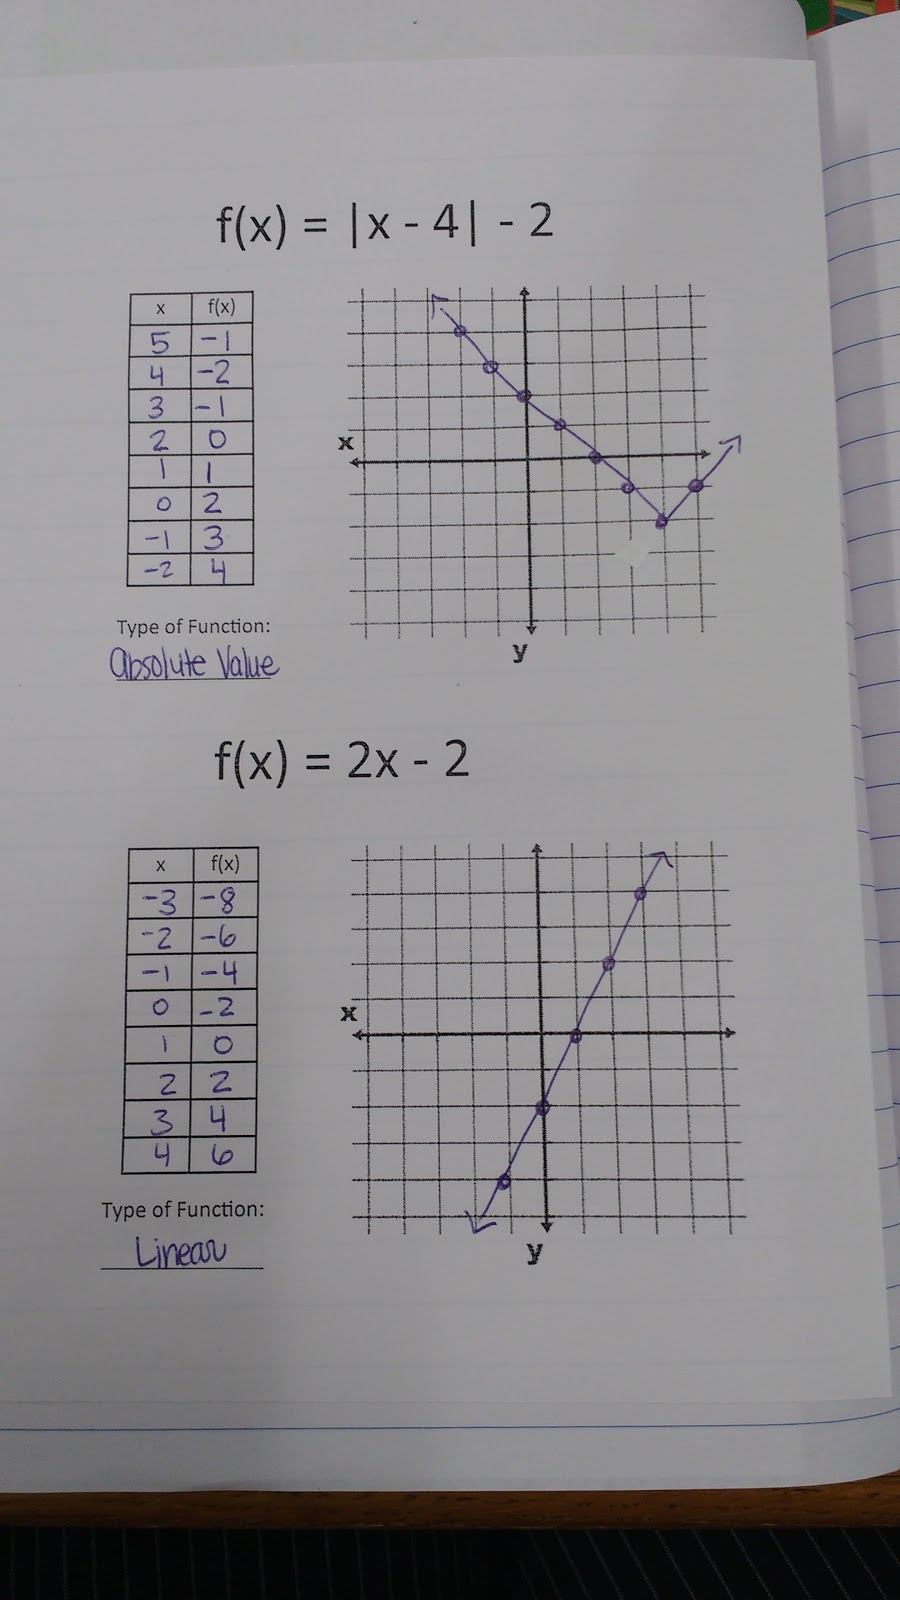
Graphing Functions Using Input/Output Tables Foldable
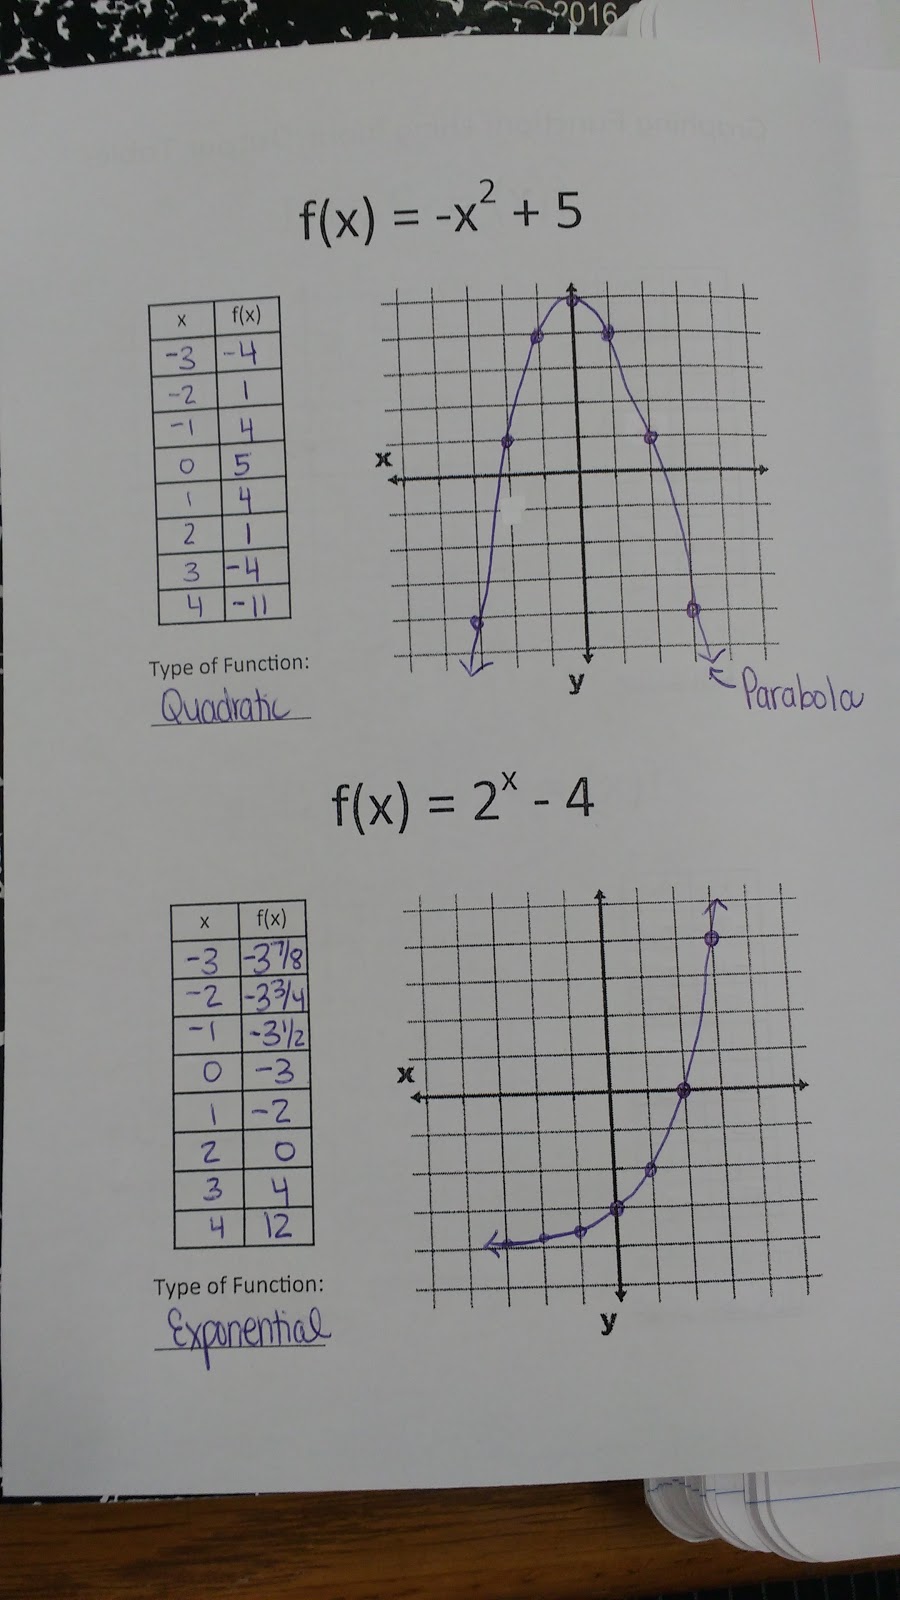
I created this graphing functions using input/output tables foldable for my Algebra 1 students to put in their interactive notebooks.
After graphing the “Win Some Cash!” functions, we did some more graphing functions practice. After graphing each function, students had to classify the function as linear, absolute value, quadratic, or exponential.
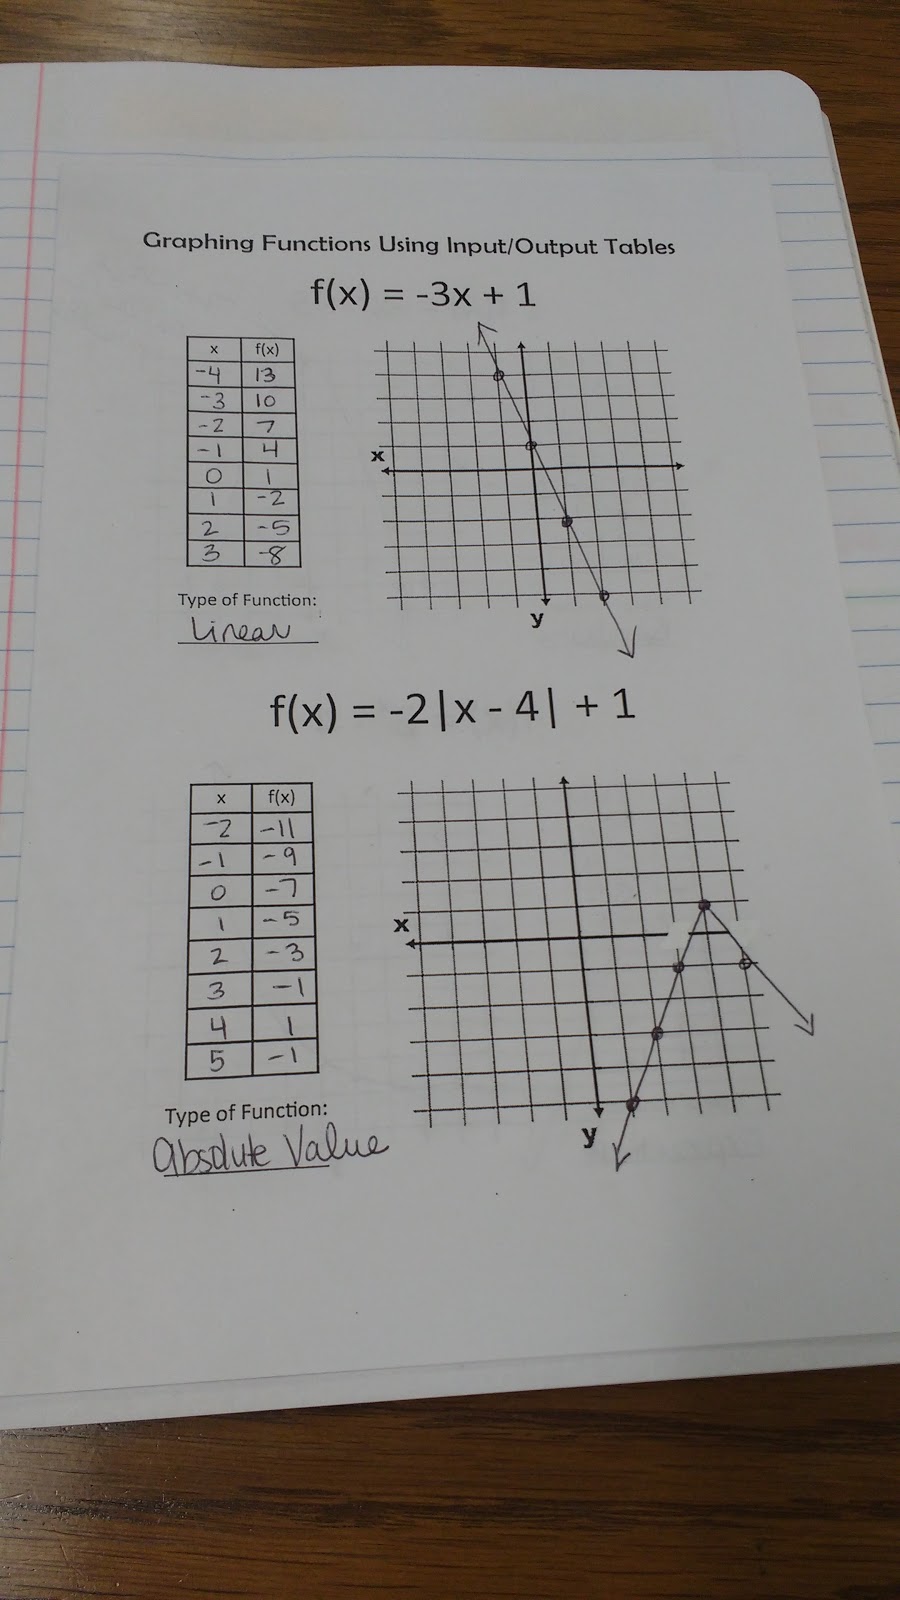
We needed lots of graphing practice. Students had to graph each function by making an input/output table and classify each function as linear, quadratic, absolute value, or exponential.
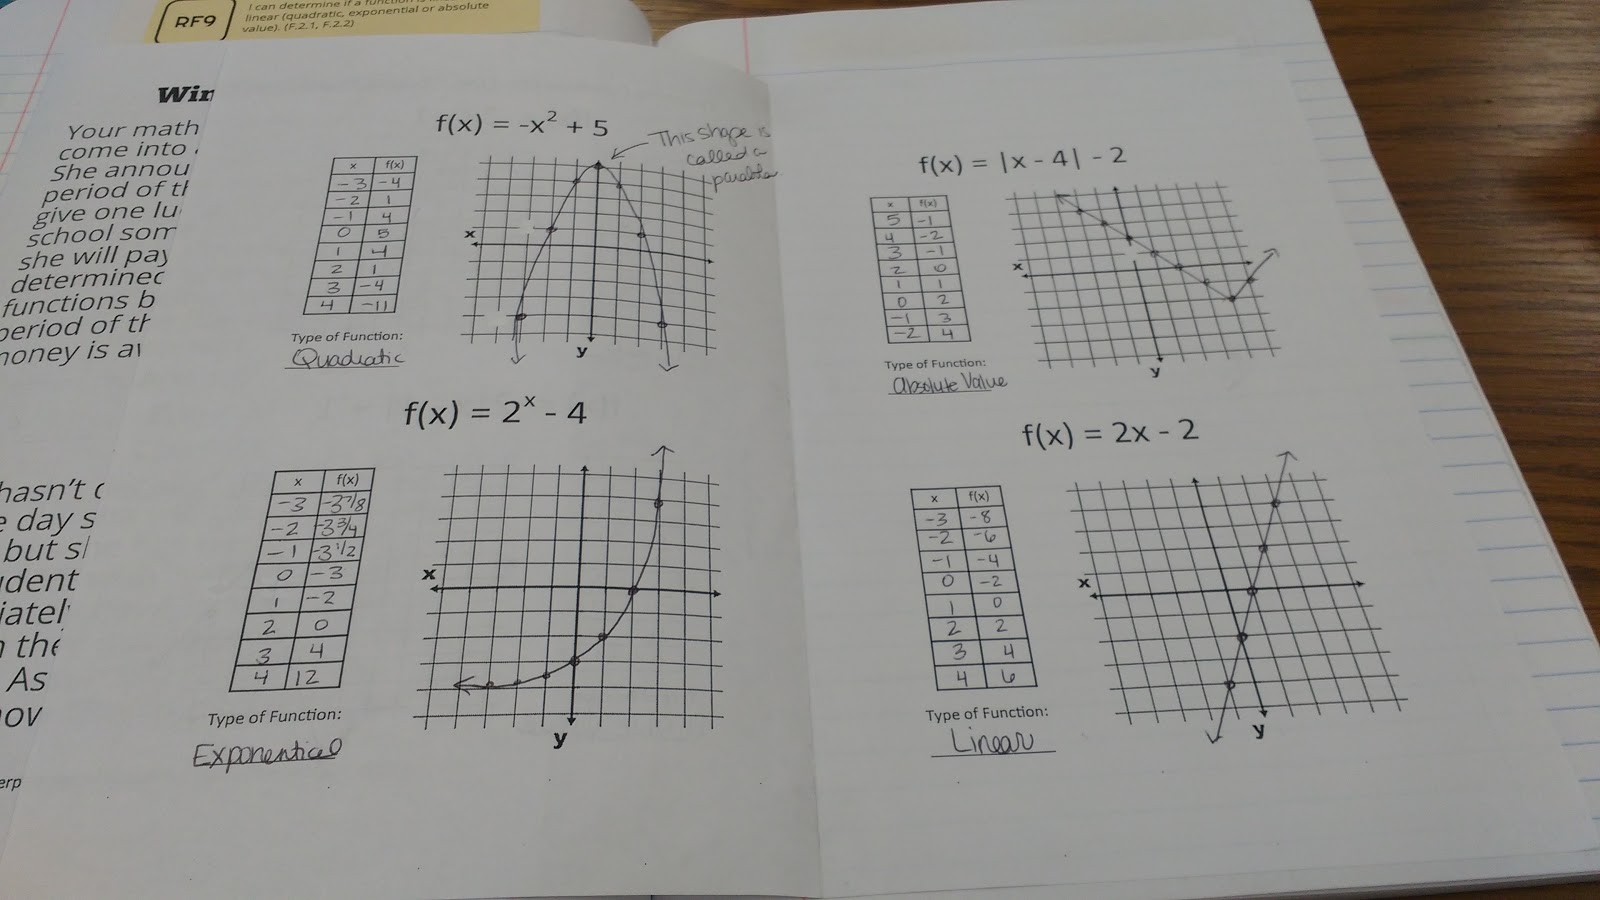
My students really struggled with knowing how to connect the dots. When I instructed them to connect the dots from left to right, this just confused them even more. Not sure how to remedy this for next year. Maybe I should make some sort of connect the dots puzzle for them to work out that goes left to right…
This year, I meant to make a summary page that discusses key points about each type of function, but we ran out of time. It’s definitely on the list of things to fix for next year.
