Kentucky Derby Winning Times
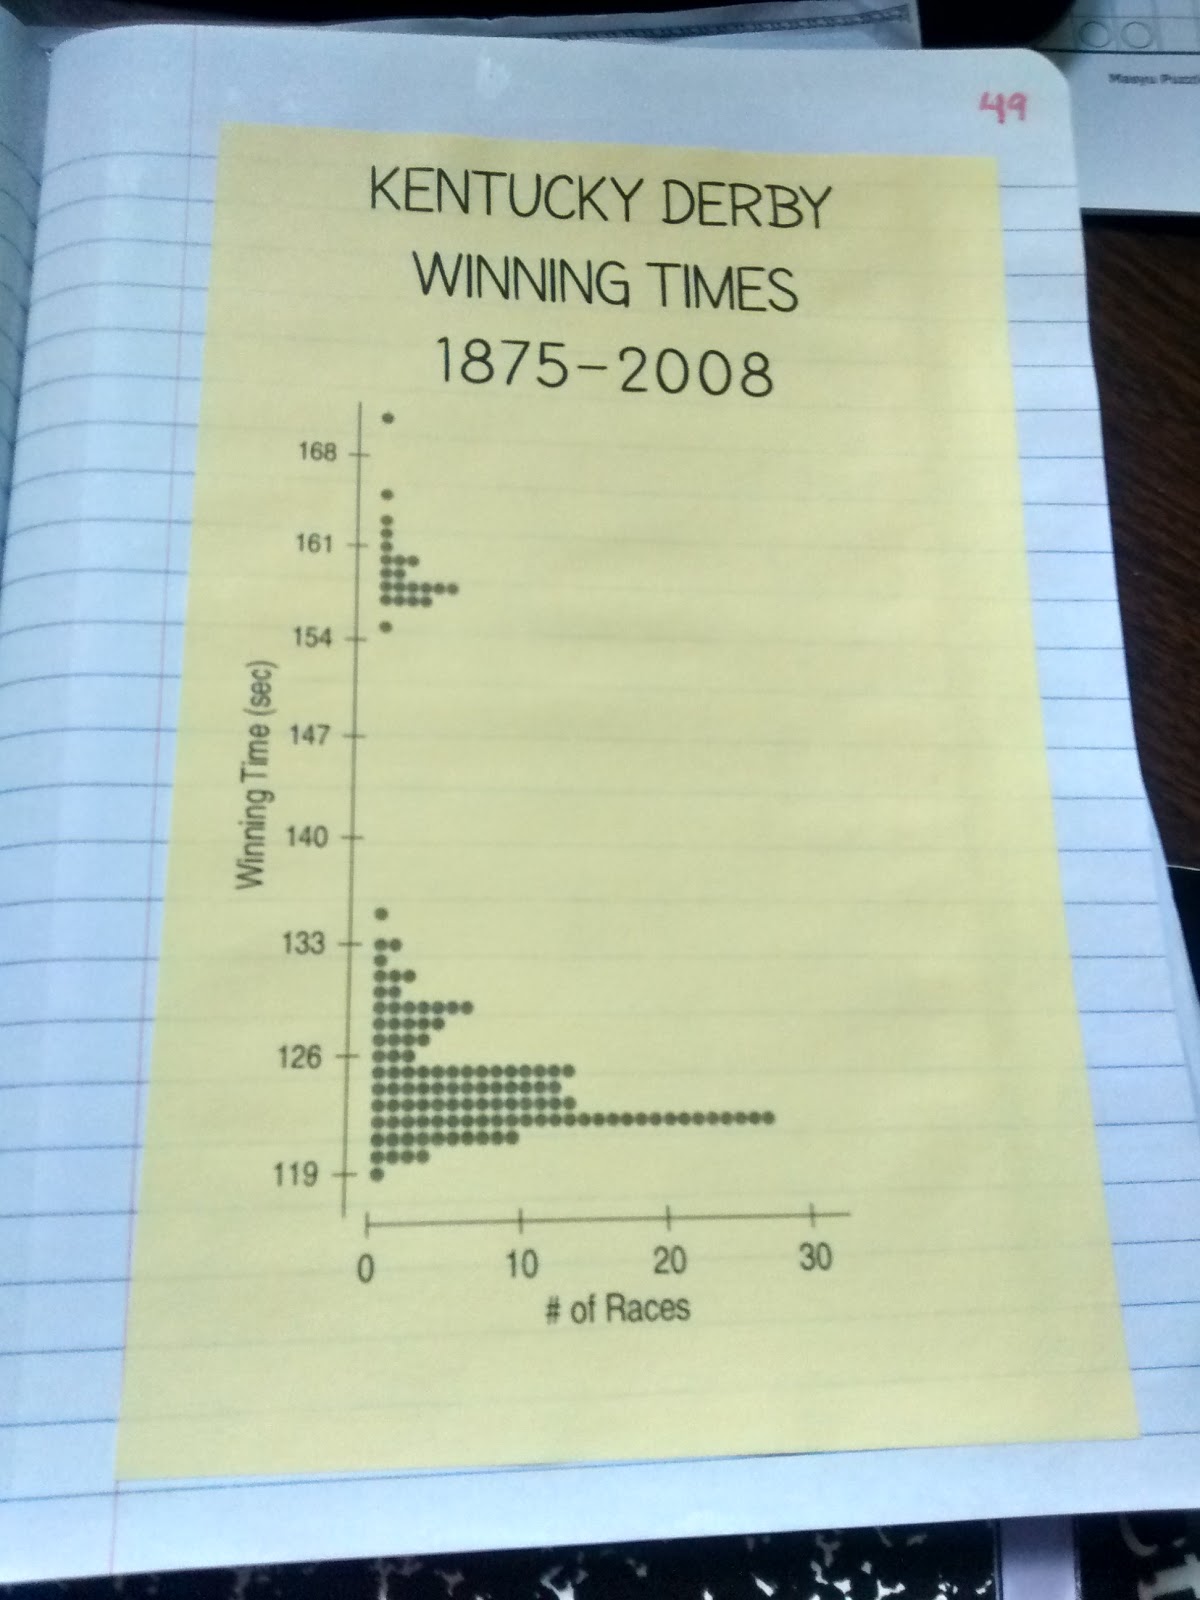
One of my favorite graphs to use to practice SOCS in statistics is this Kentucky Derby Winning Times graph that I found in Stats: Modeling the World.
To practice describing SOCS, I had my class look at this dotplot of the Kentucky Derby Winning Times between 1875 and 2008. We had quite the interesting discussion about why the data was shaped this way.
I used this activity after we completed our SOCS Foldable and before our SOCS Practice Foldable.
Free Download of Kentucky Derby Winning Times
Kentucky Derby Winning Times (PDF) (1047 downloads )
Kentucky Derby Winning Times (Editable Publisher File ZIP) (873 downloads )
More Ideas for Teaching Quantitative Data Displays
- Tenzi Data Collection Activity for Comparing Data Sets
- Dot Plot of the Day Activity
- Design Your Own Dot Plot Magnets Activity
- How Many States Have You Visited Map
- Dotplot Matching – A Desmos Card Sort Activity for Statistics
- Count the Objects Task for Data Collection
- Analyzing the Ages of Academy Award Winners
- Are your graphs OK? TULSA Graphing Posters
- Highlights Hidden Pictures Activity for Comparing Data Sets
- Blind Stork Test for Data Collection
- Dry Erase Workmat for Finding Five Number Summary, IQR, and Outliers
- Estimating 30 Seconds Data Collection Activity
- Types of Data Displays Foldable
- Kentucky Derby Winning Times