Rate of Change Graphic Organizer
We created this rate of change graphic organizer to glue in our algebra interactive notebooks.
This year, I emphasized rate of change much more than I did last year.
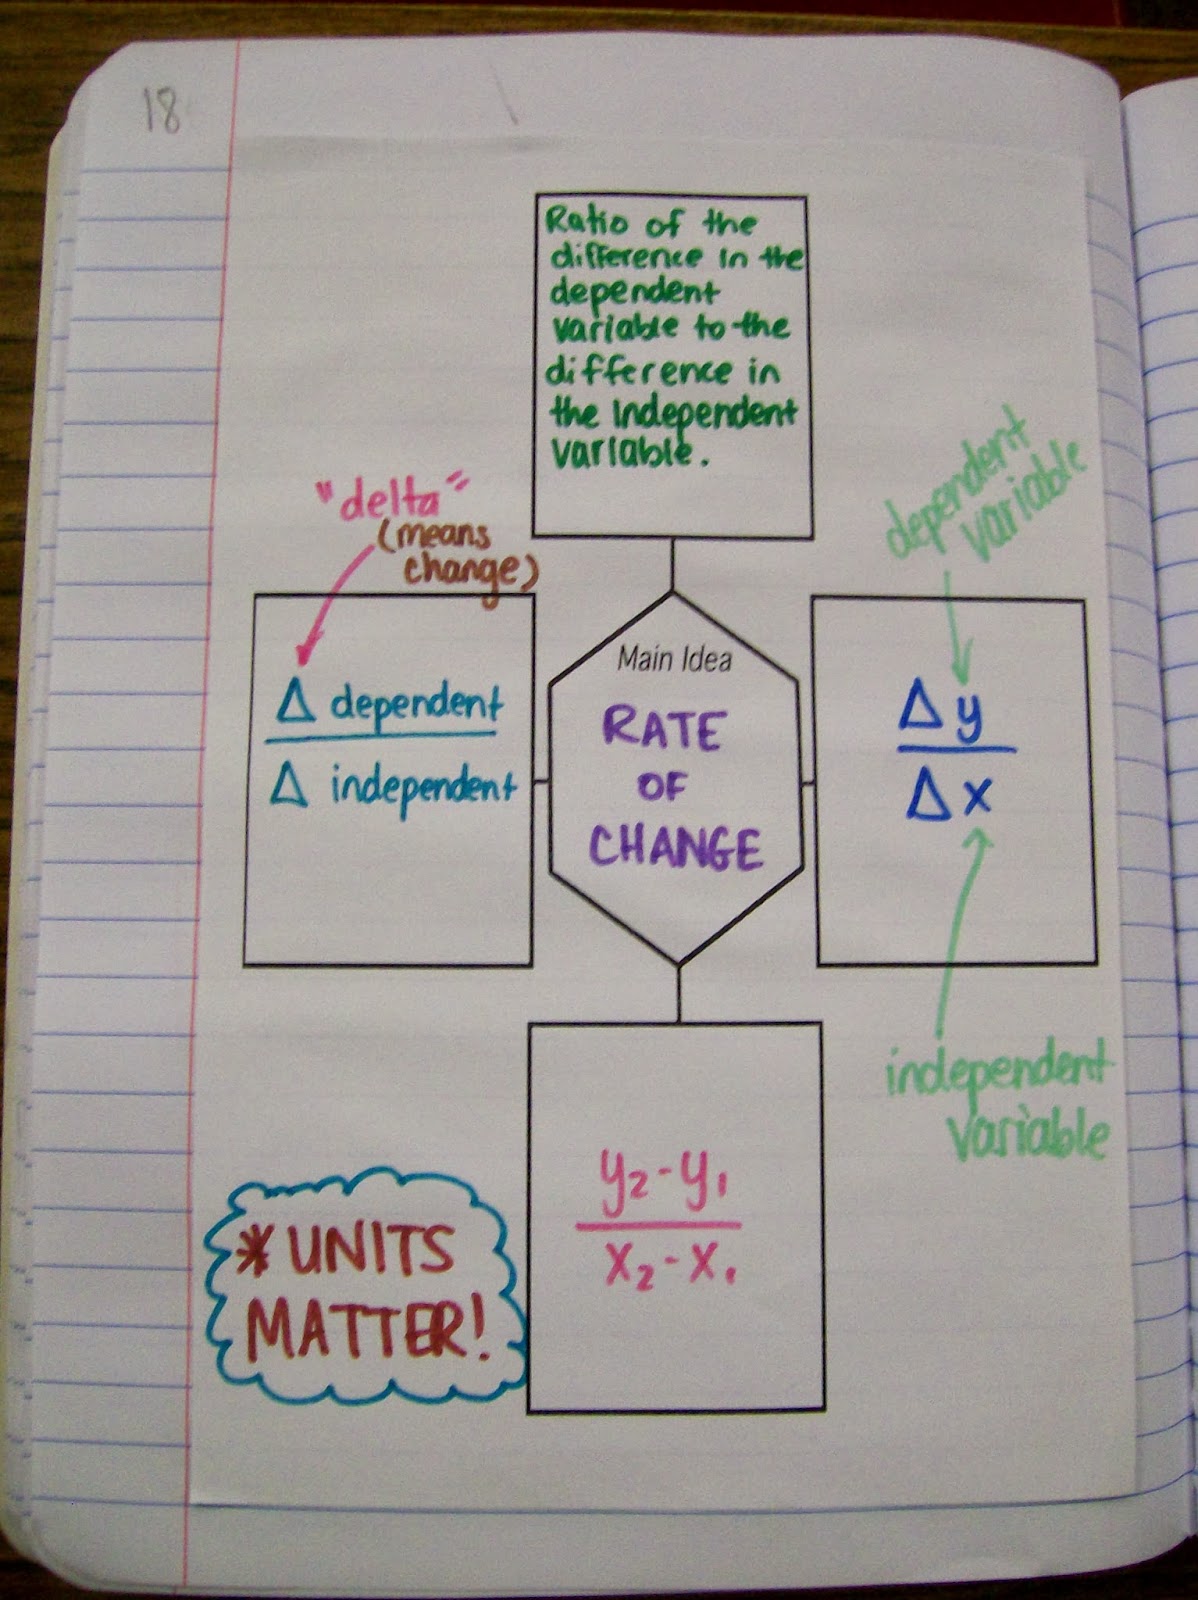
I used this as an opportunity to constantly review the difference between dependent and independent variables. Whenever students would struggle with interpreting the rate of change, I would direct them to this page a lot.