Statistics Activities
This blog post contains Amazon affiliate links. As an Amazon Associate, I earn a small commission from qualifying purchases.
Looking for fun and interesting ways to incorporate data collection into your stats class? Check out this list of 56 fun and interesting statistics activities I have done with my students over the years in Algebra 1, Algebra 2, and Statistics class.
Measures of Central Tendency Activities
Level the Towers Activity for Introducing Mean
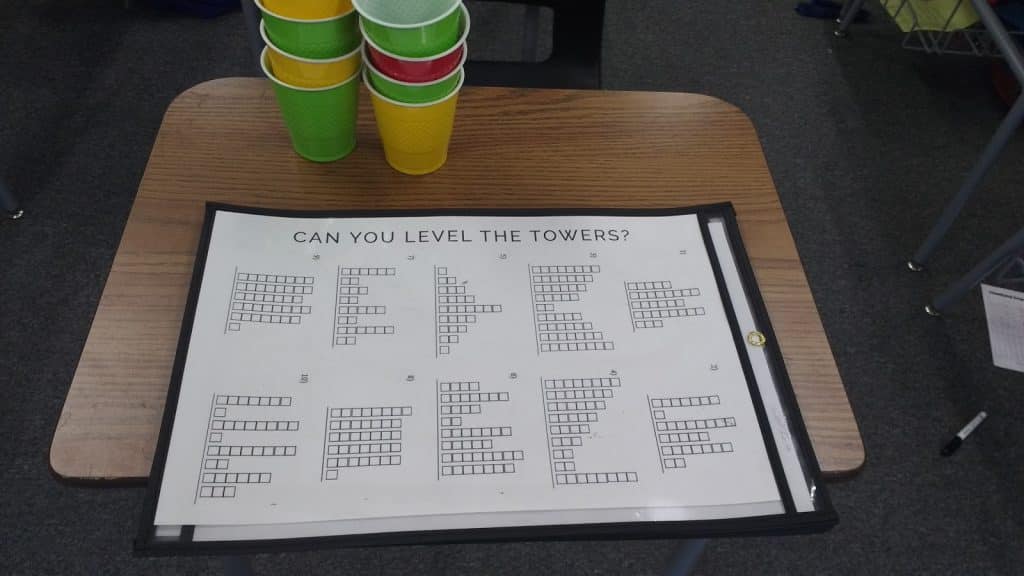
This activity will help your students visually understand what we are doing to a data set when we find the mean.
Tenzi vs Splitzi Measures of Central Tendency Activity
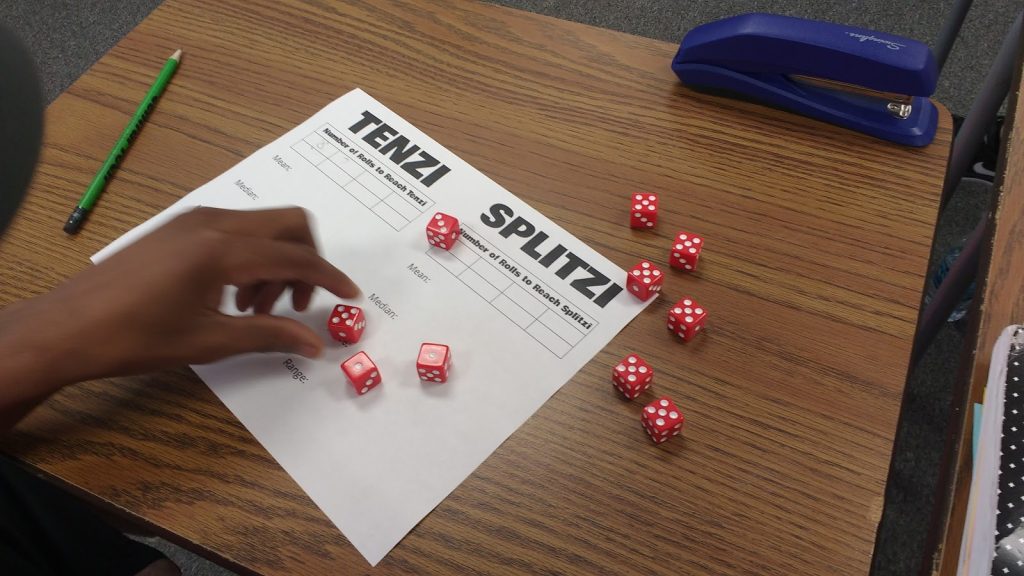
This Tenzi vs Splitzi data collection activity was the perfect set-up for practicing finding measures of central tendency with my Algebra 1 students.
Always Sometimes Never Activity for Mean, Median, Mode, and Range
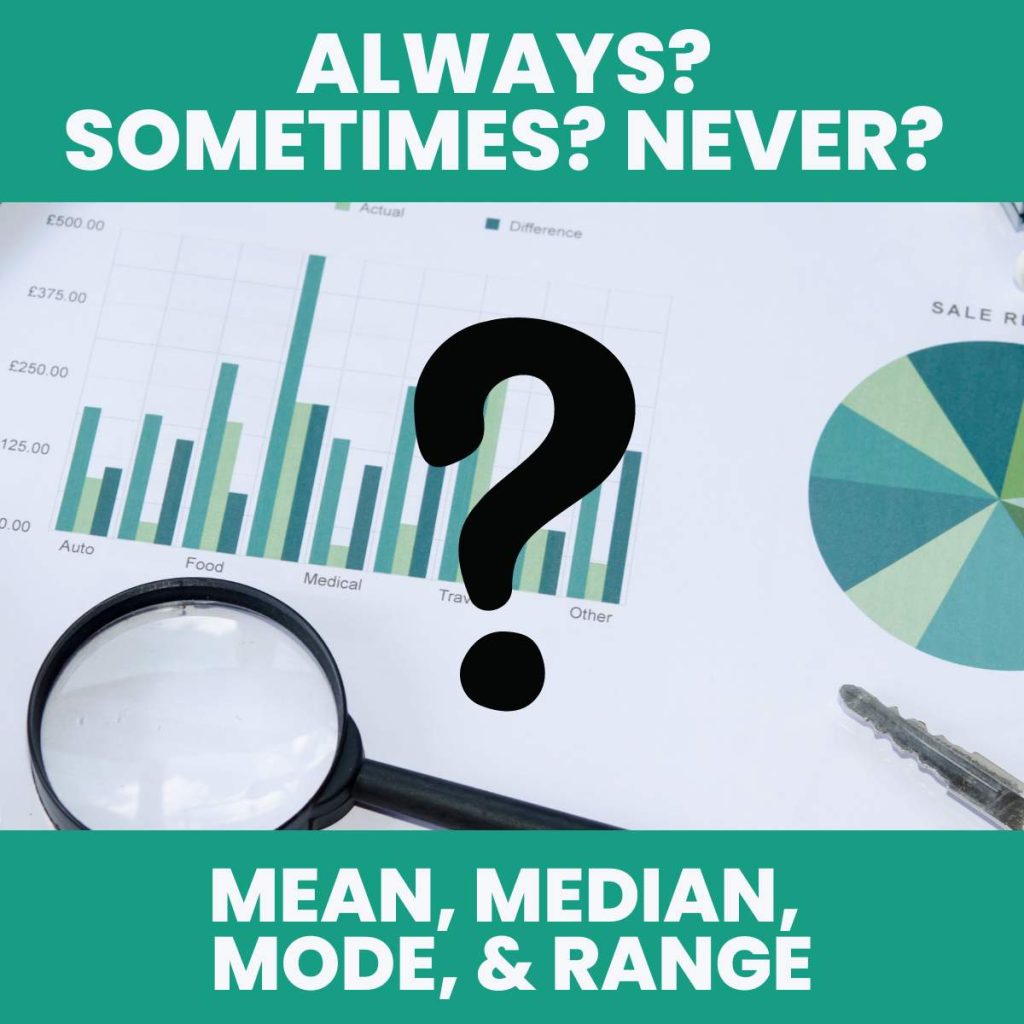
Check out this Always Sometimes Never Activity for Mean, Median, Mode, and Range. This was the perfect way to review the measures of central tendency with my Algebra 1 students. I used this activity as a last-minute review before our quiz over finding measures of central tendency.
Mean, Median, Mode, and Range Challenge Activity
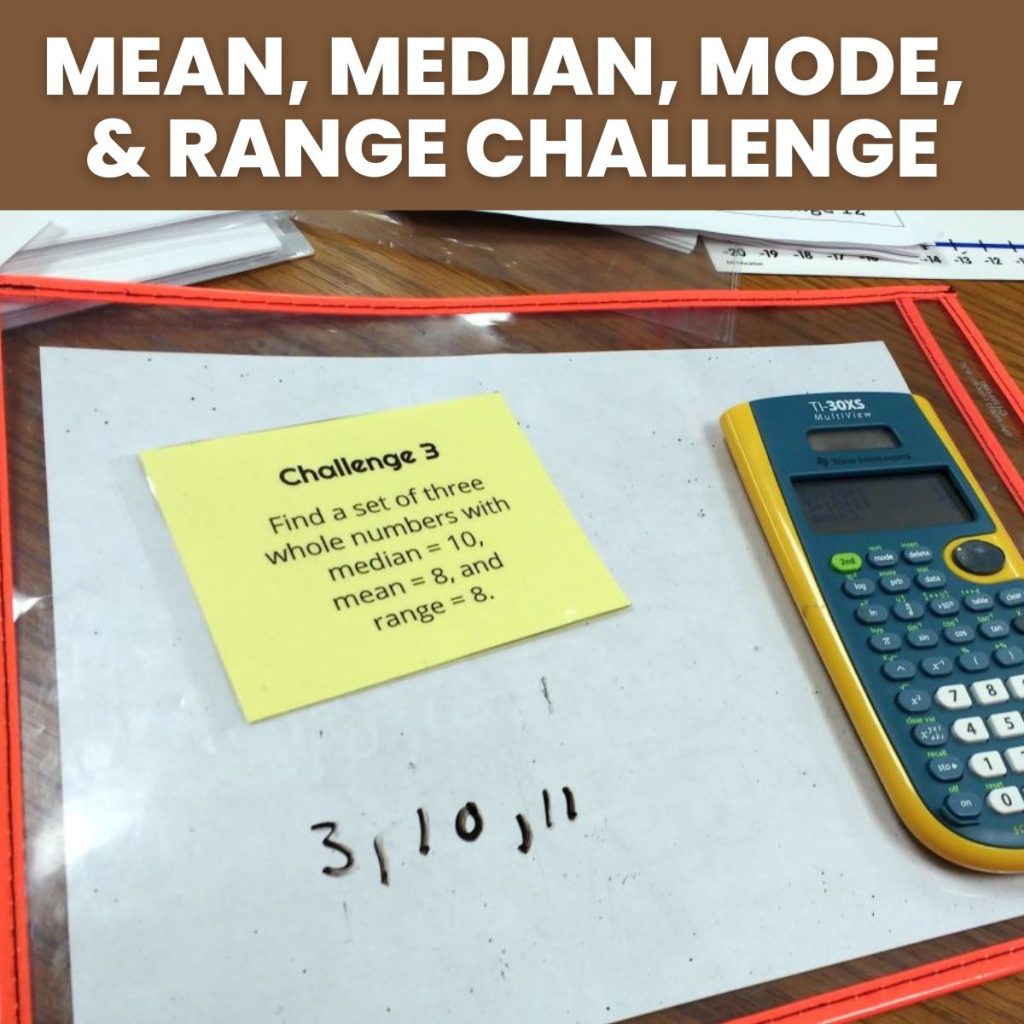
Can you find a set of numbers that satisfies each challenge involving the mean, median, mode, and range of the data set?
Mean, Median, Mode, and Range Spider Puzzles
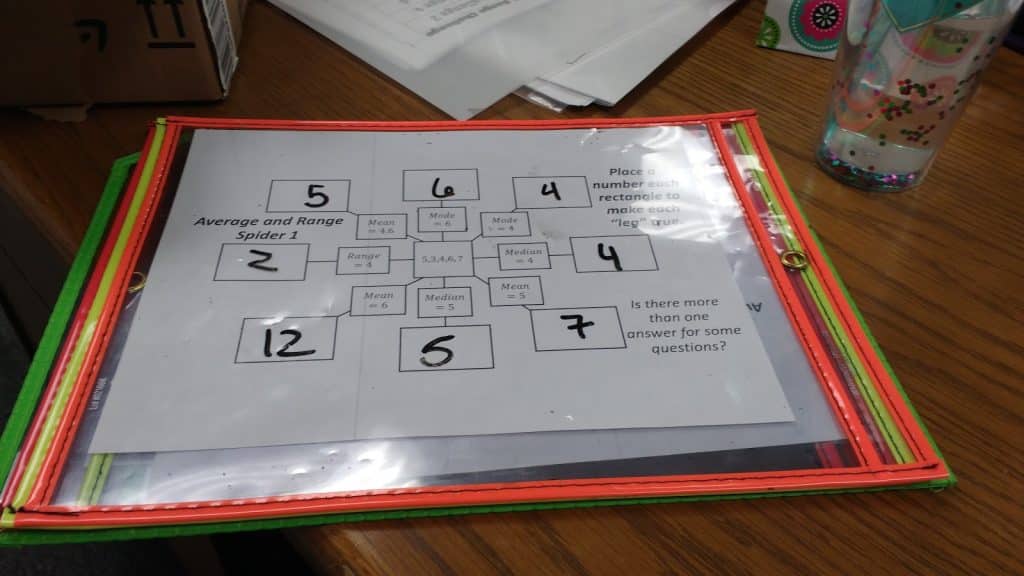
Students must add one number to the data set to make it have various means, medians, modes, and ranges. My students did not want to put this activity down!
Measures of Central Tendency Graphic Organizers
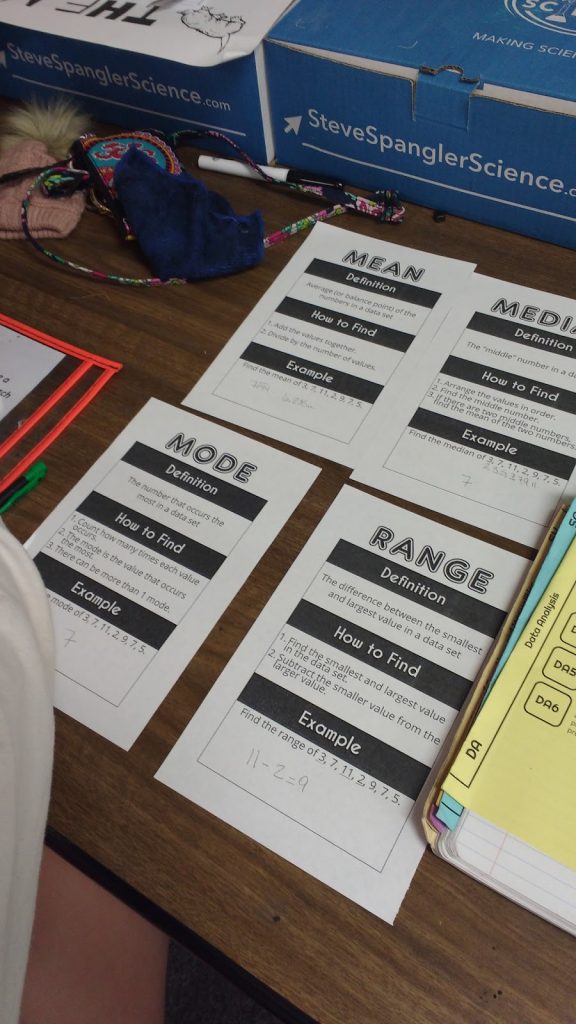
I created these measures of central tendency graphic organizers for my Algebra 1 students to review how to find mean, median, mode, and range at the beginning of our data analysis unit.
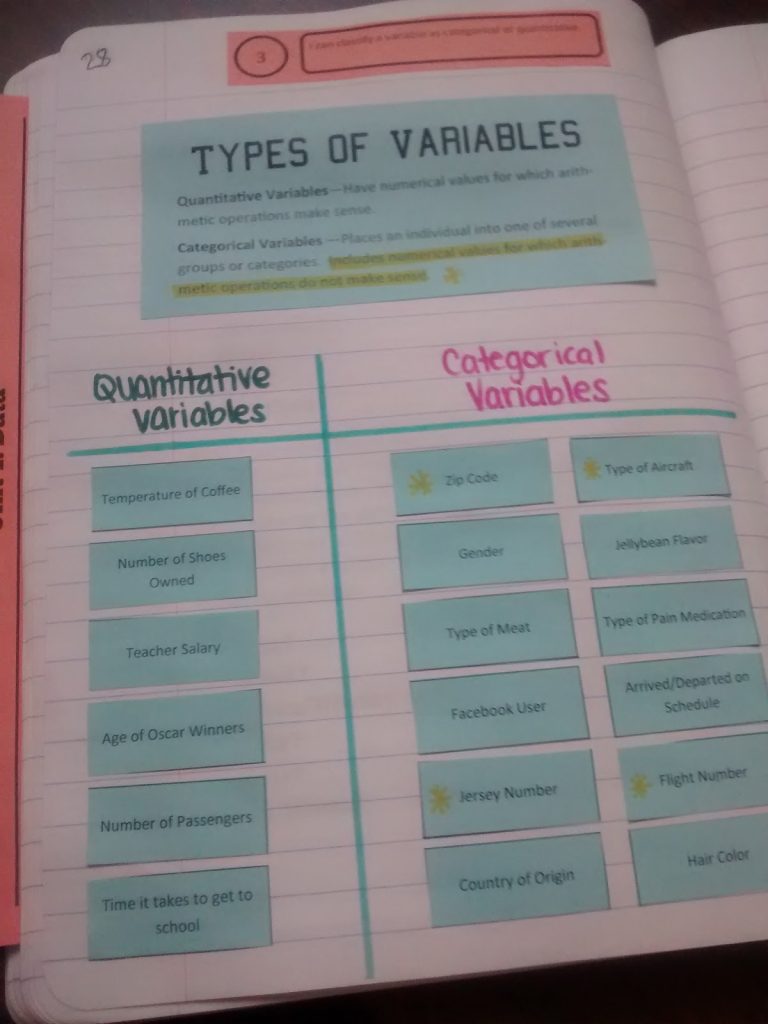
Categorical vs Quantitative Variables Activities
Categorical vs Quantitative Variables Card Sort Activity
I created a categorical vs quantitative variables card sort that I would like to share with you.
Categorical vs Quantitative Variables Hold-Up Cards Activity
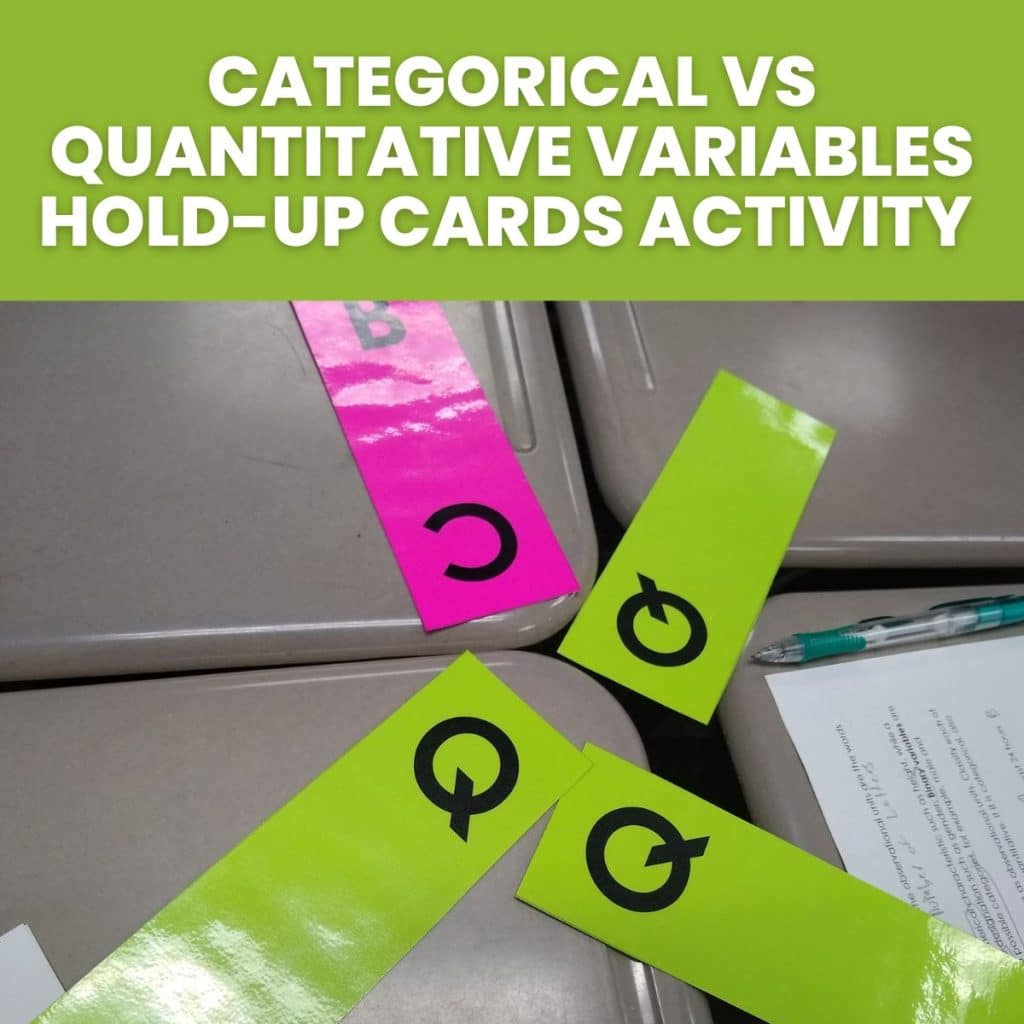
I created these categorical vs quantitative variables hold-up cards to help me understand how well my statistics students were grasping the concepts of categorical and quantitative variables.
Emergency Rooms Card Sort Activity for Categorical and Quantitative Variables
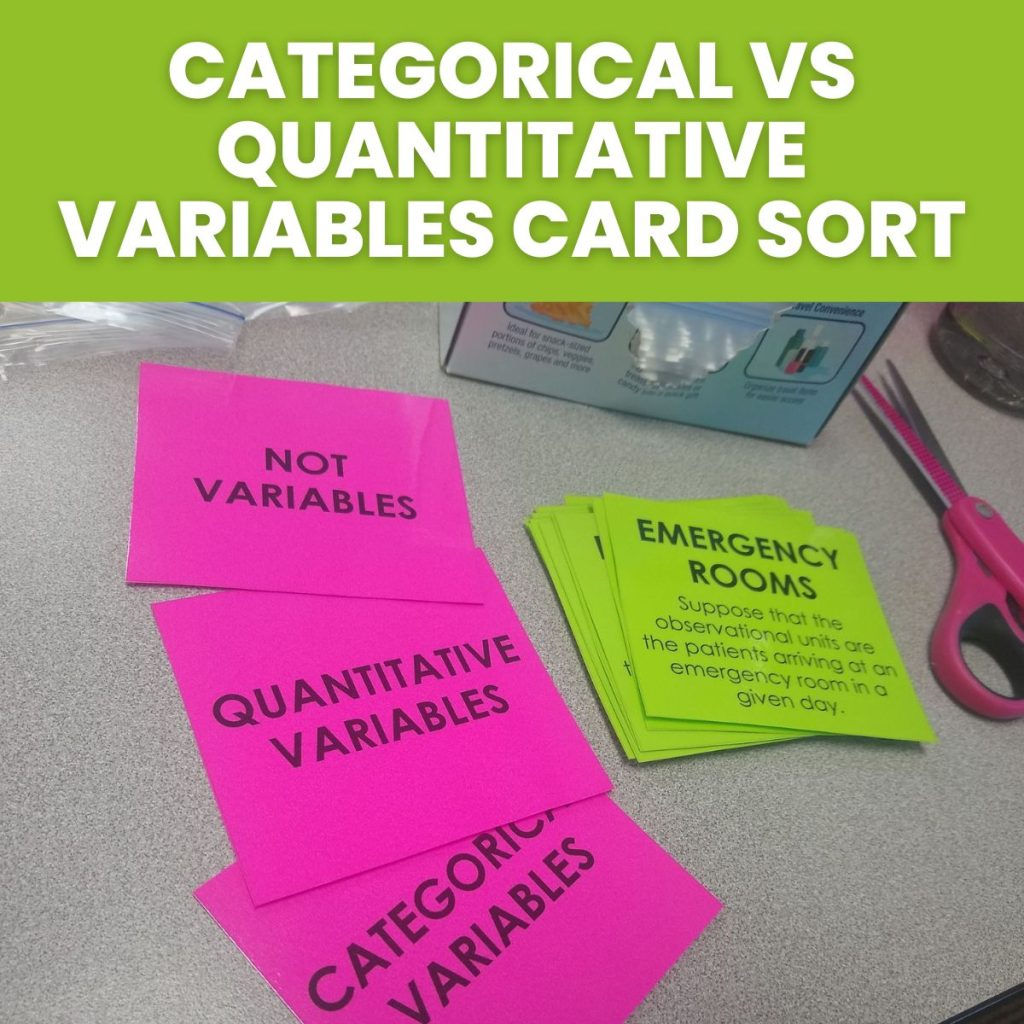
Looking for a fun way to assess student understanding on categorical and quantitative variables? Check out this card sort activity I created for my statistics classes involving data that could be collected in an emergency room.
Levels of Measurement Activities
Levels of Measurement Dry Erase Activities
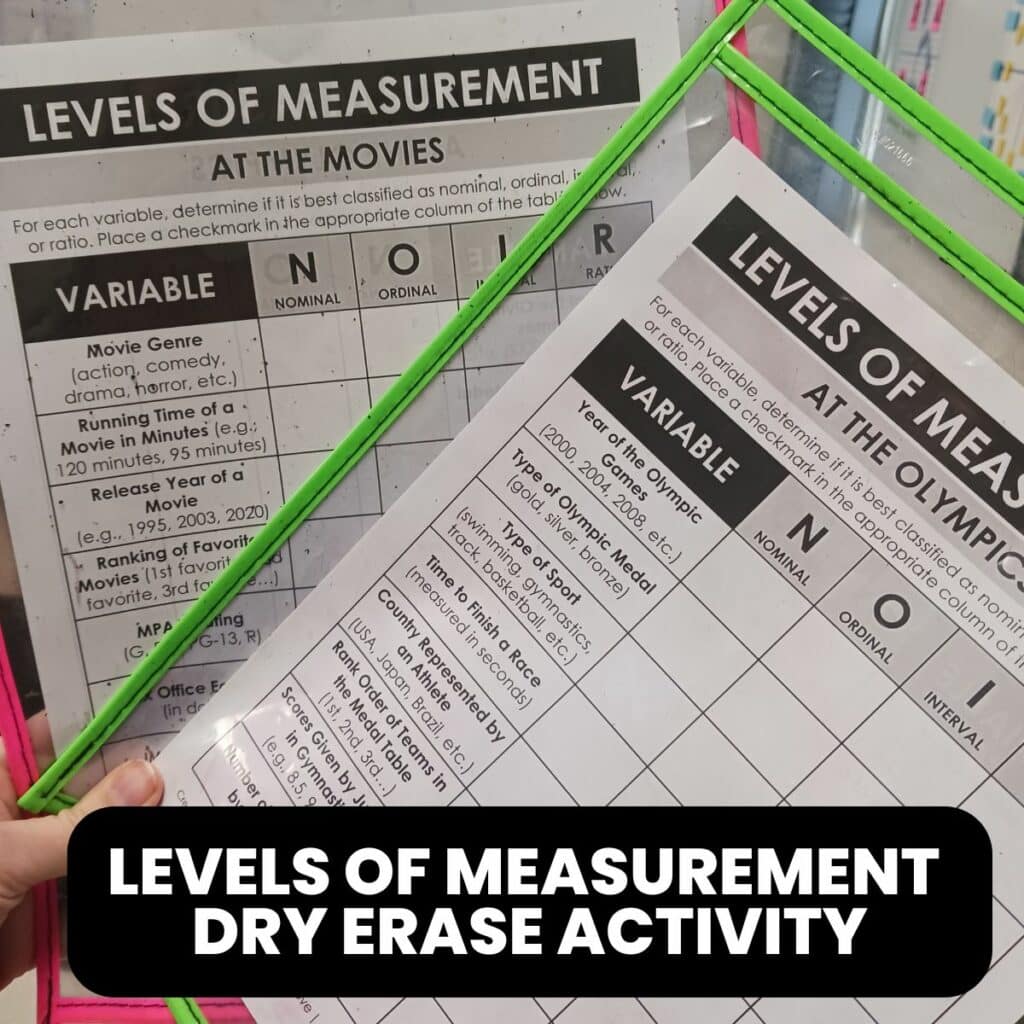
Take your statistics students on a “field trip” to practice classifying variables according to their levels of measurement with this fun dry erase activity!
Levels of Measurement Card Sort Activity
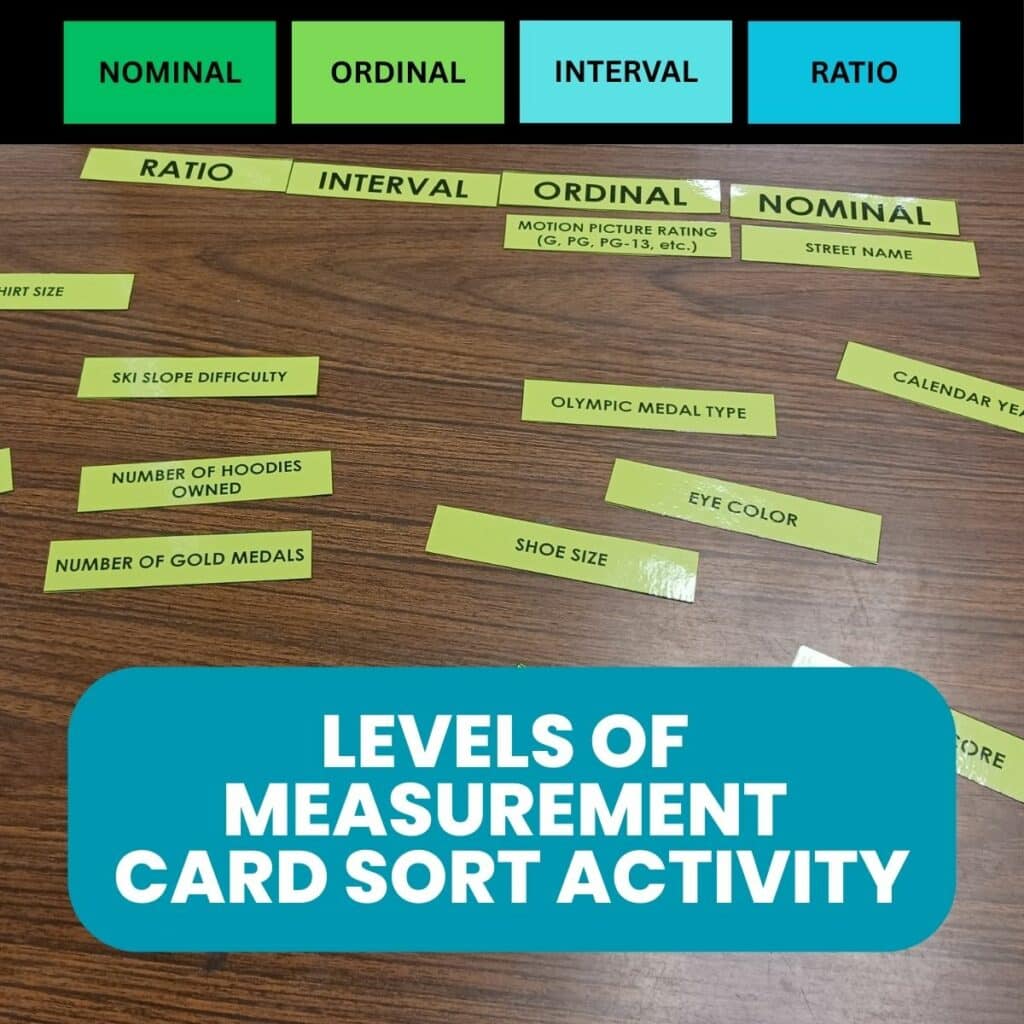
Practice classifying variables according to the 4 levels of measurement with this free and fun statistics card sort activity.
Statistics and Data Analysis Activities
Kentucky Derby Winning Times Dot Plot Analysis

One of my favorite graphs to use to practice SOCS in statistics is this Kentucky Derby Winning Times graph that I found in Stats: Modeling the World. To practice describing SOCS, I had my class look at this dotplot of the Kentucky Derby Winning Times between 1875 and 2008.
SOCS Foldable for Statistics
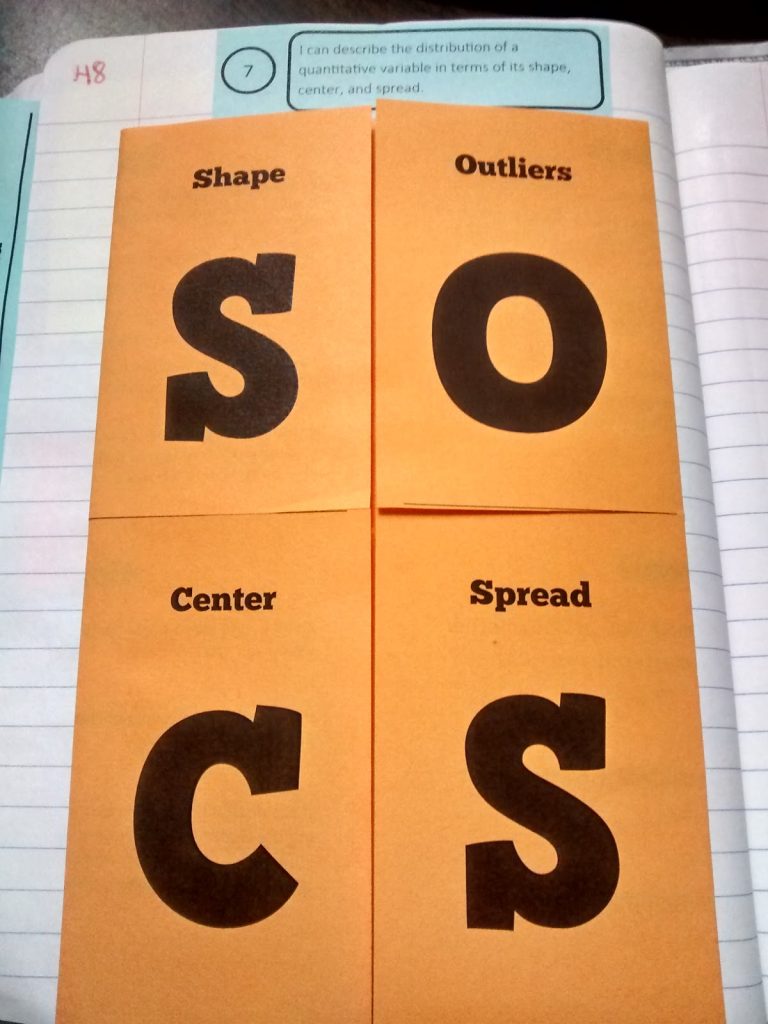
I’m pretty happy with how this SOCS foldable turned out that I created for my stats class. We’re practicing identifying the shape, outliers, center, and spread of a quantitative variable.
IQR vs Standard Deviation Card Sort Activity
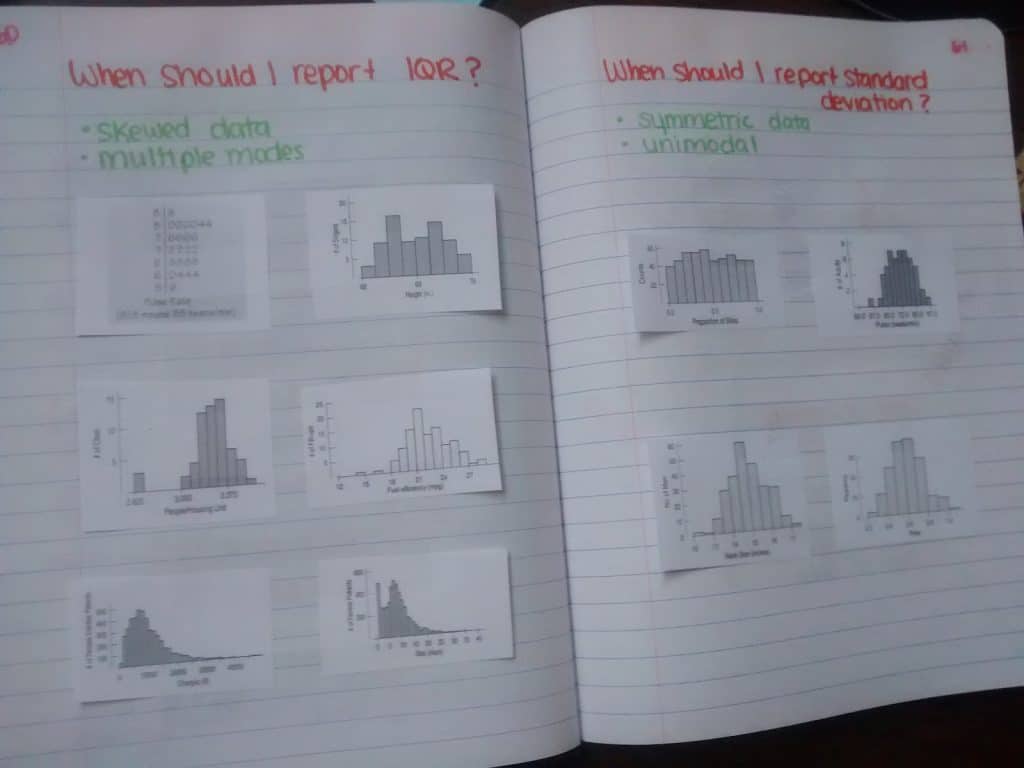
My stats students had just finished up learning to find IQR by hand and by calculator and standard deviation by hand and by calculator. I made this card sort activity to help students learn when they should report IQR vs standard deviation.
5 Number Summary 5 Finger Summary
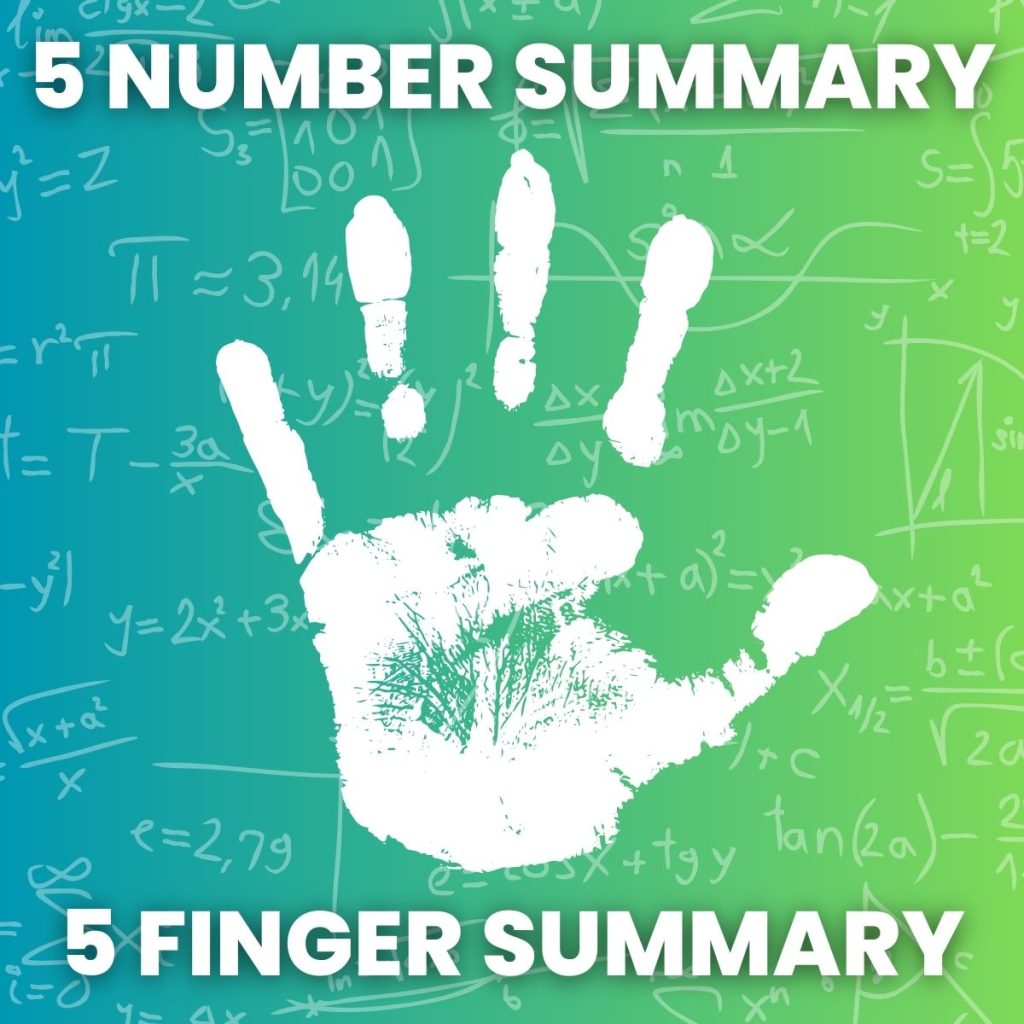
Check out this interactive notebook over the 5 elements of a 5 number summary.
Blind Stork Test for Data Collection
How hard can it be to stand on one foot with your eyes closed? Your students will find out with this fun blind stork test that is perfect for collecting data to analyze in Algebra 1.
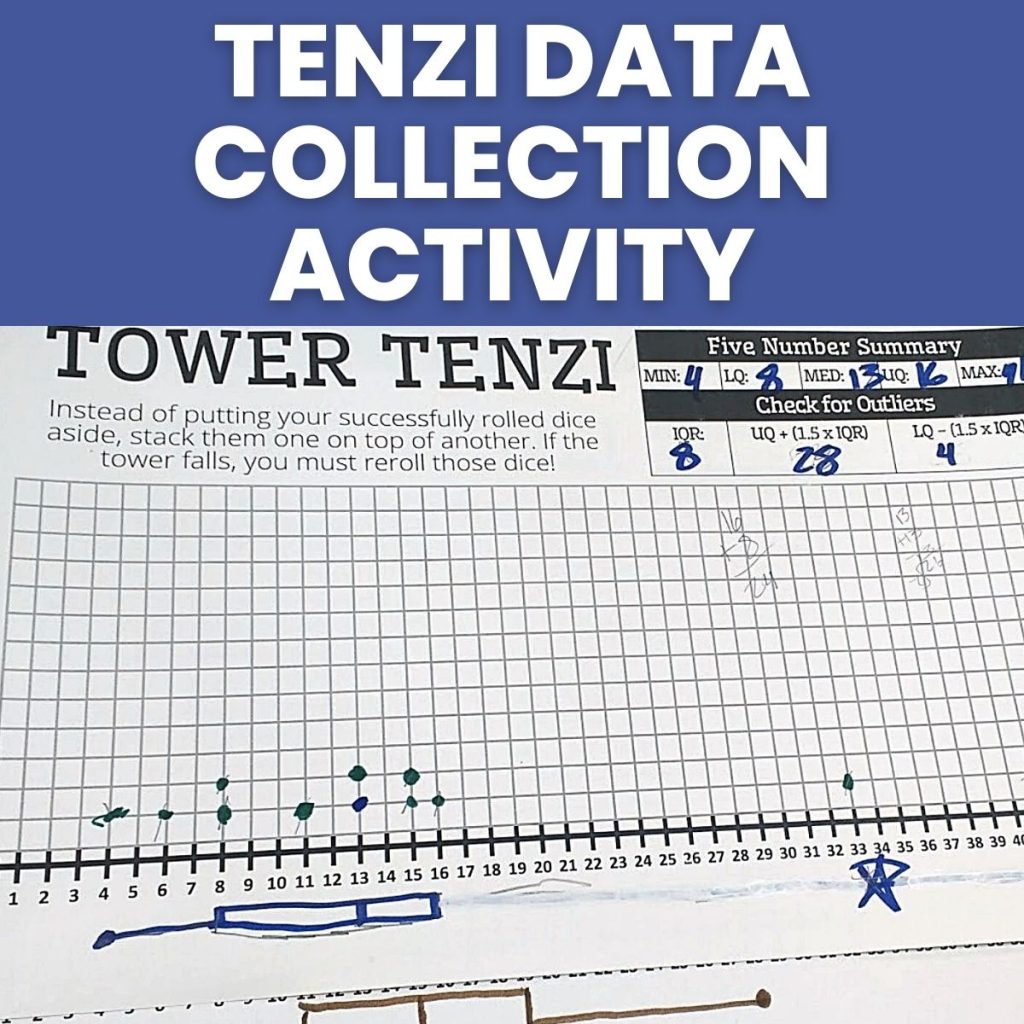
Tenzi Data Collection Activity for Comparing Data Sets
Design Your Own Dot Plot Magnets
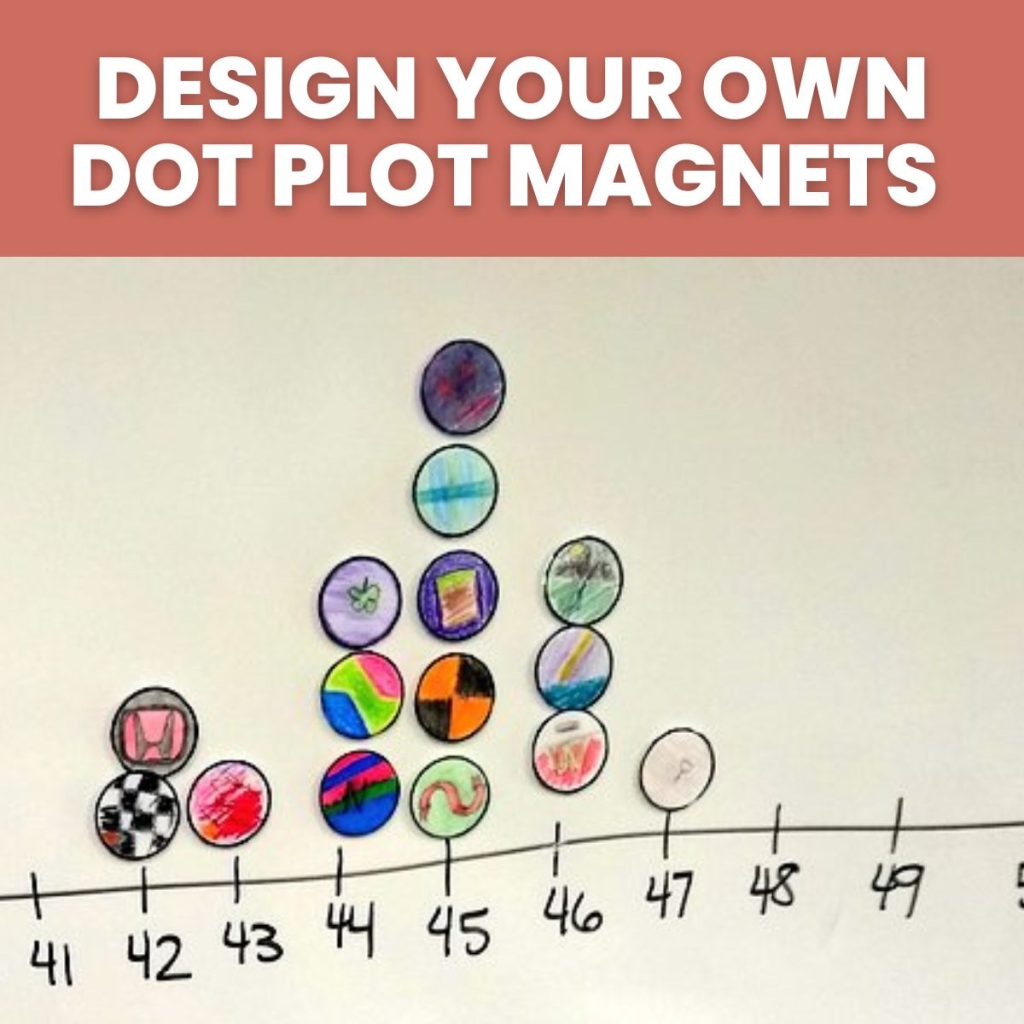
Your Algebra 1 students will love creating their own custom magnet which can be used to create class dot plots.
Dot Plot of the Day Activity
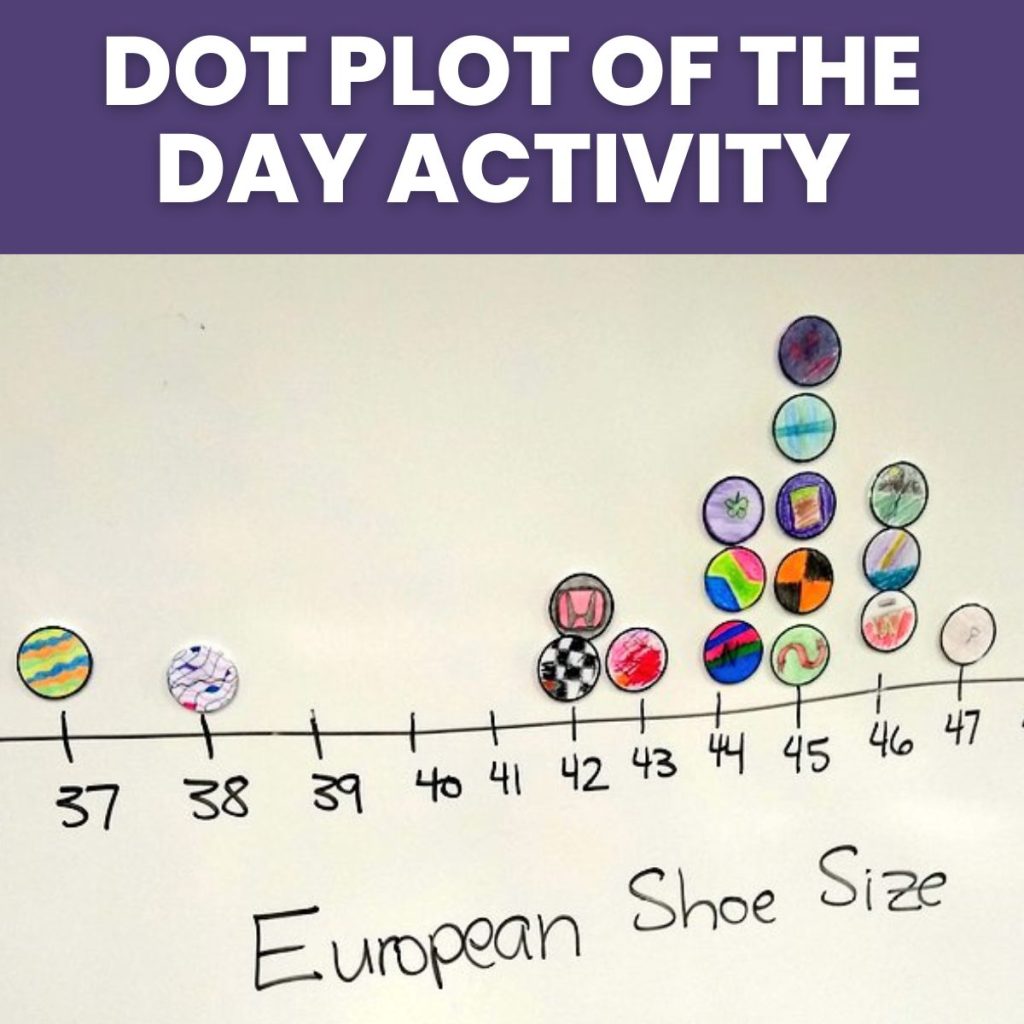
Don’t settle for random data sets from your textbook to analyze. In this dot plot of the day activity, students will practice describing data sets involving data collected directly from their classmates.
How Many States Have You Visited Data Collection Activity
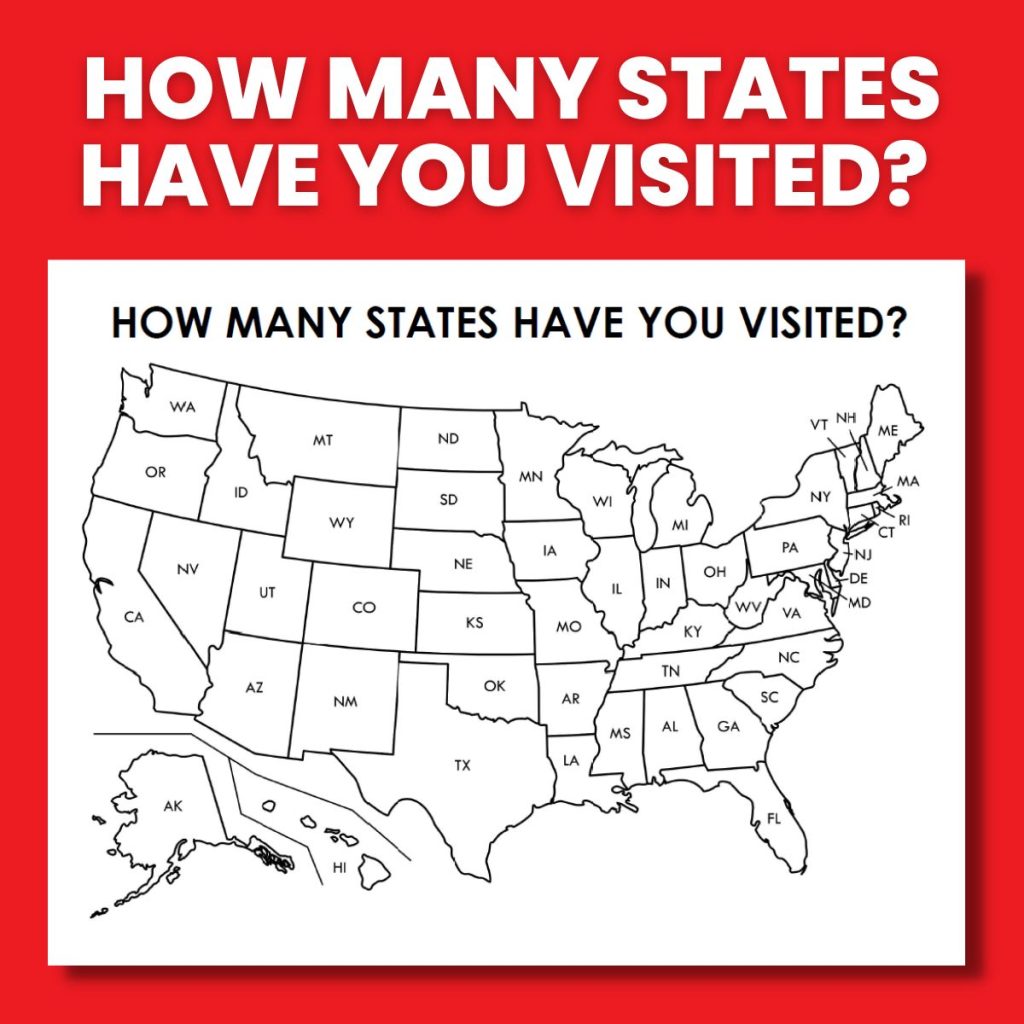
Once you have created your dot plot magnets, ask your students “How Many States Have You Visited?” This is a great first dot plot to make and analyze as a class.
Dot Plot Matching Card Sort Activity
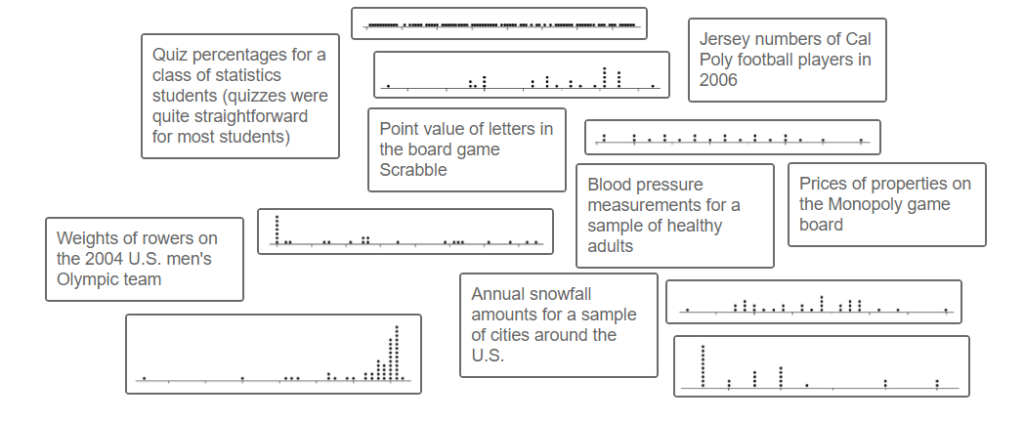
The numbers and labels are missing from these dotplots. Can you use your logical reasoning skills to match each dotplot with it represents?
Count the Objects Data Collection Task
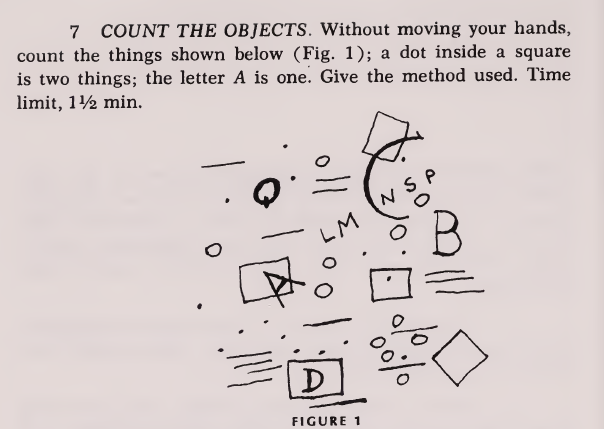
How many items will your students count in the allotted time? Have your students create a graphical display of the results. How does the true value compare to the class results?
Analyzing the Ages of Academy Award Winners

This data set analyzing the ages of male and female academy award winners is the perfect introduction to back-to-back stem-and-leaf plots.
Highlights Hidden Pictures Data Collection Activity for Comparing Data Sets
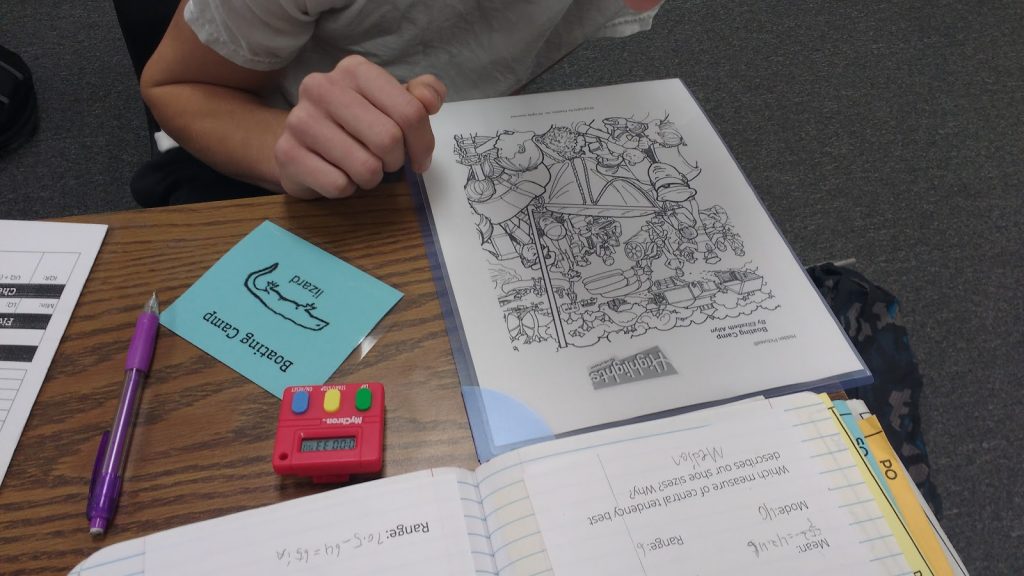
Students were given a plastic sleeve with a hidden picture puzzle and a card with a picture to locate within the puzzle, a MyChron timer, and a data recording sheet to glue into their interactive notebooks.
Game of Greed
I want to share a statistics foldable I made for the Game of Greed. This dice game is such a fun way to collect data!
Boxplot and Histogram Card Sort Activity
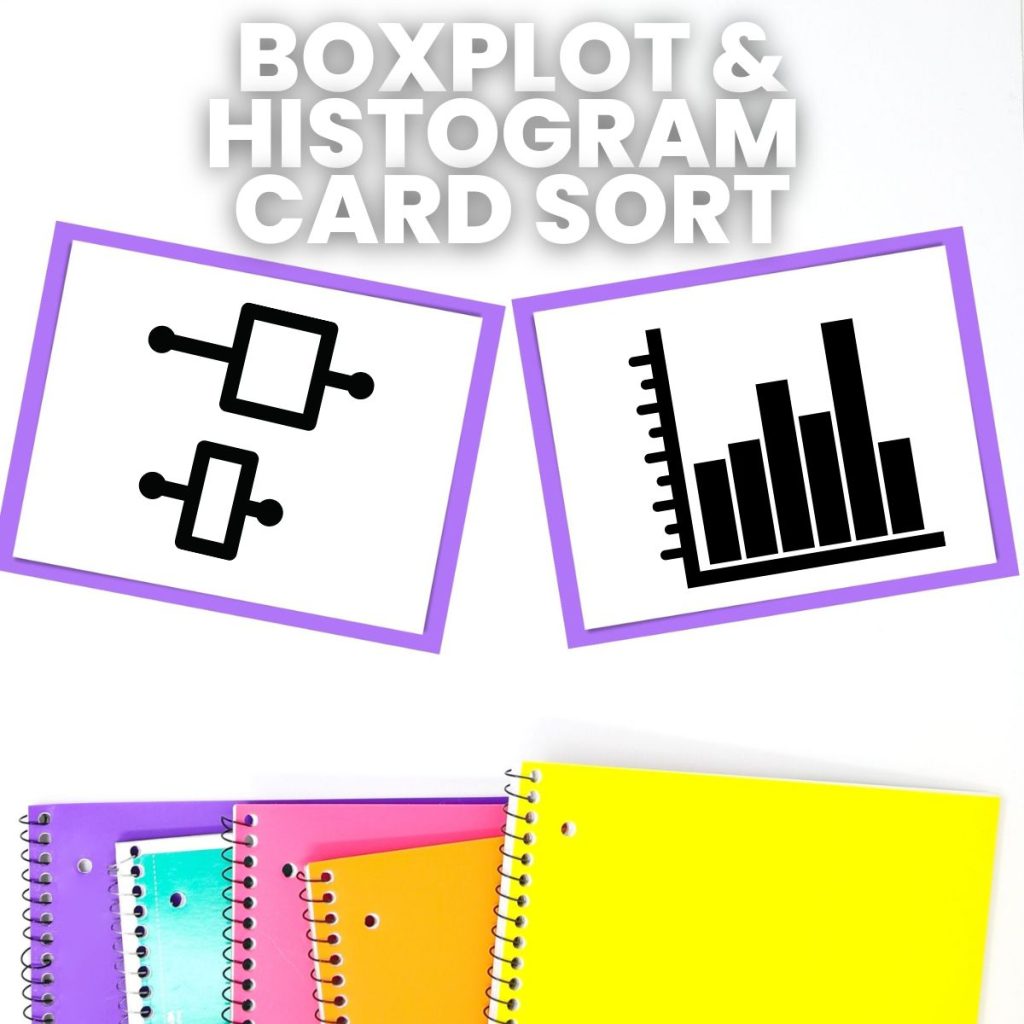
My stats students were struggling with boxplots. So, I decided to take a break from making boxplots to letting them look at boxplots that were already made. A quick google search led me to this boxplot and histogram card sort activity.
Looking for Outliers in the OKC Thunder
Students will practice finding a five number summary and determining if there are any outliers by looking at salary data for the OKC Thunder.
5 W’s and H Foldable
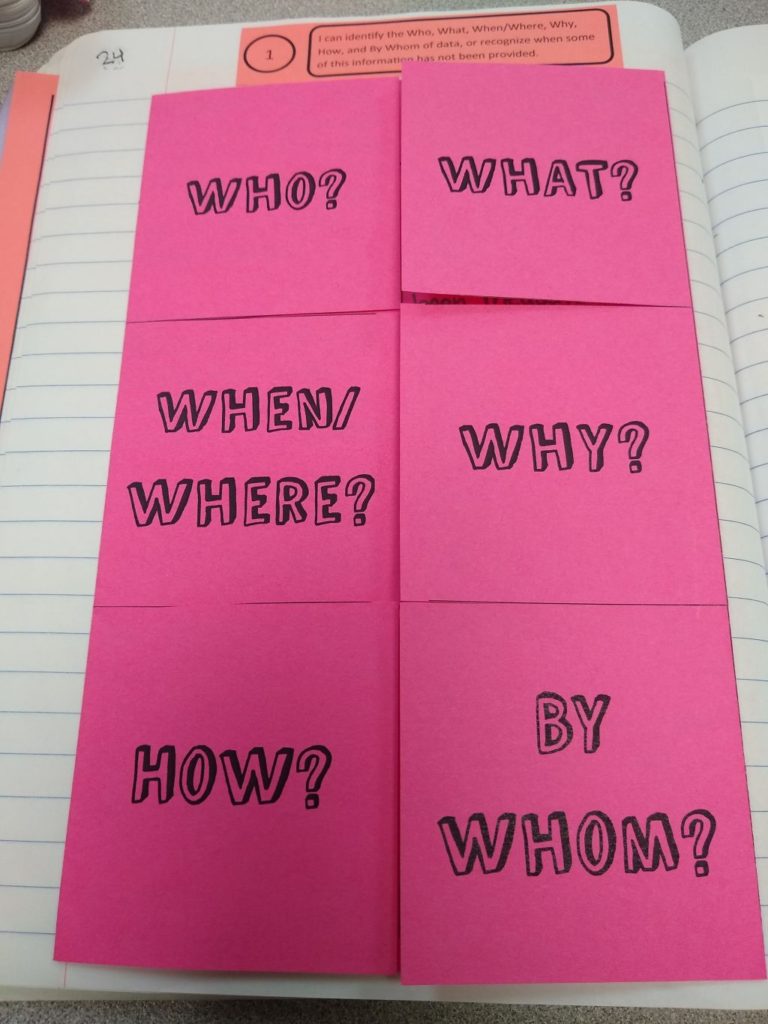
I created this 5 W’s and H Foldable for my Stats class to glue in their statistics interactive notebooks (INBs).
Dry Erase Workmat for Finding Five Number Summary, IQR, and Outliers
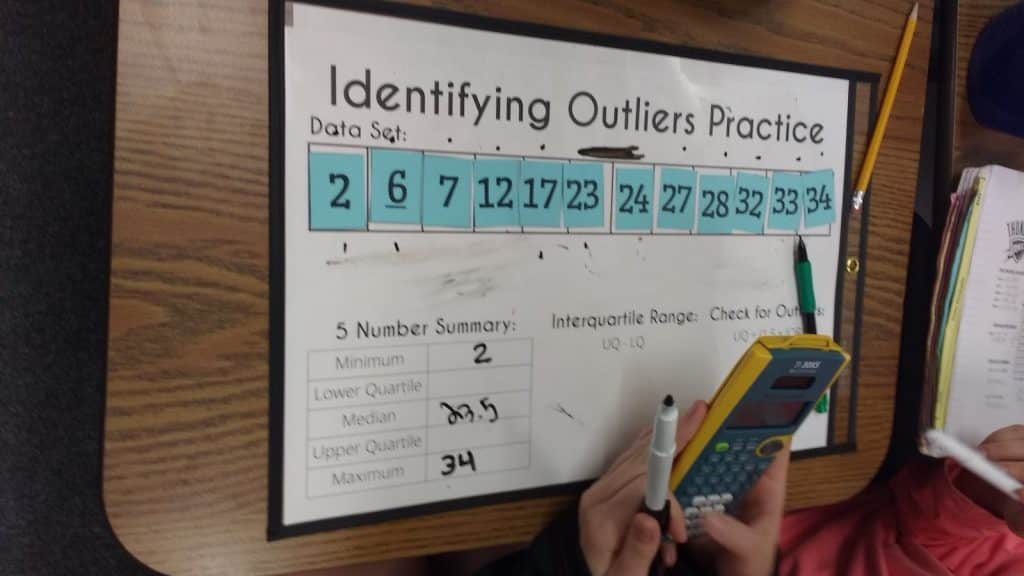
Students use this helpful dry erase workmat to help them organize their work while finding the five number summary of a data set and using that to find IQR and outliers.
Graphs In the News Statistics Foldable

I made this Graphs in the News Statistics Foldable to give my stat students practice analyzing graphs of categorical data. I pulled some real-life data displays from the internet. Then, I had students discuss these questions together as a group. I loved hearing my students reason through these!
Estimating 30 Seconds Data Collection Activity
How well can your students estimate 30 seconds? This is the perfect quick data collection activity to get a fun set of data to analyze.
Types of Data Displays Foldable
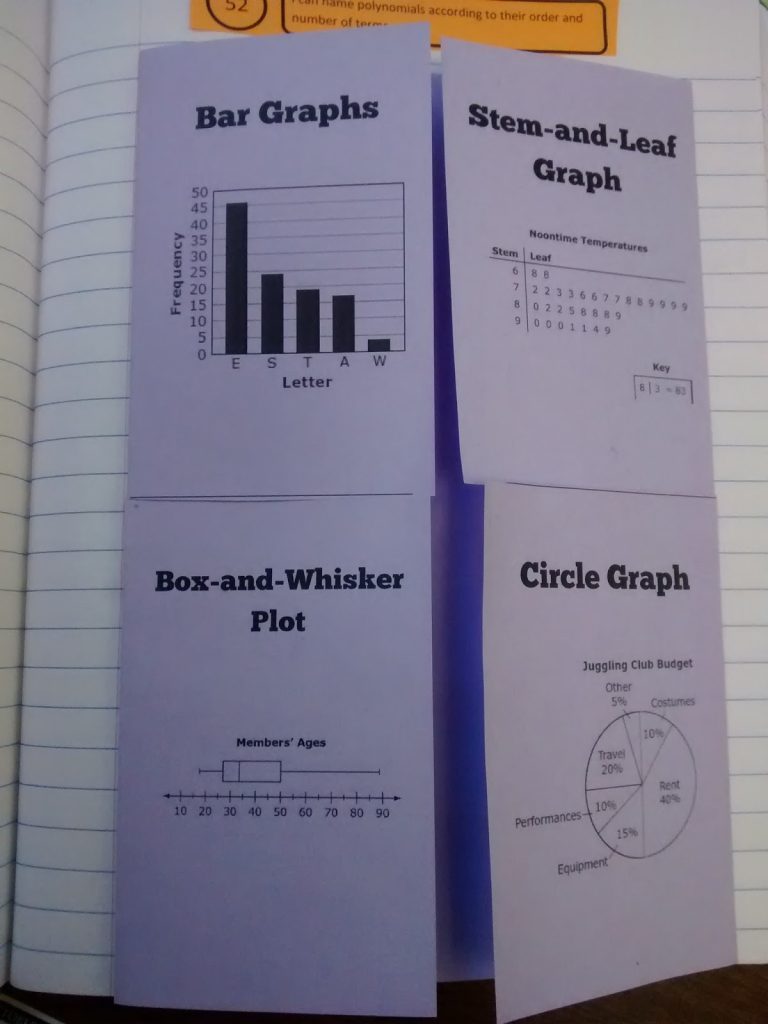
I created this types of data displays foldable for my Algebra 1 students to review bar graphs, stem-and-leaf graphs, box-and-whisker plots, and circle graphs.
Let’s Make a Graph Activity
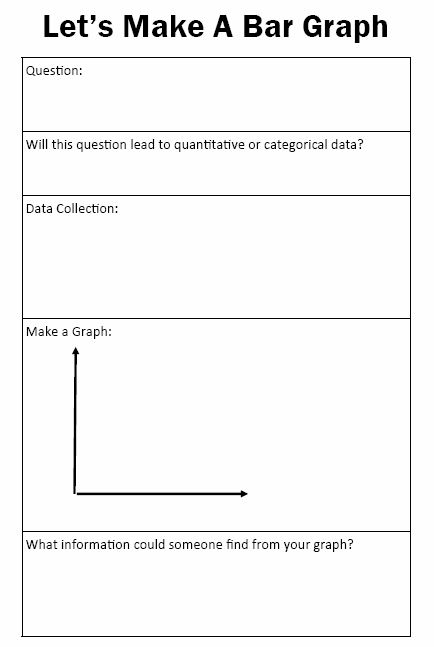
I created this let’s make a graph activity to give my Algebra 1 students practice making various types of data displays. We needed to practice making bar graphs, box-and-whisker-plots, circle graphs, and stem-and-leaf graphs.
Paper Airplane Lab

Recently, my statistics class was working on a paper airplane lab to explore the effect of the wingspan of a paper airplane on the distance traveled by the plane.
Gummy Bear Catapults
Recently, my statistics students have been doing an activity with gummy bear catapults.
Hiring Discrimination Simulation for Statistics

This year, I decided I wanted to start my statistics class off with a statistical simulation to give them a taste of what was in store for the year. I ran across mention of a hiring discrimination simulation on another blog, and I thought it would make the perfect first activity.
Are your Graphs OK? TULSA Graphing Posters
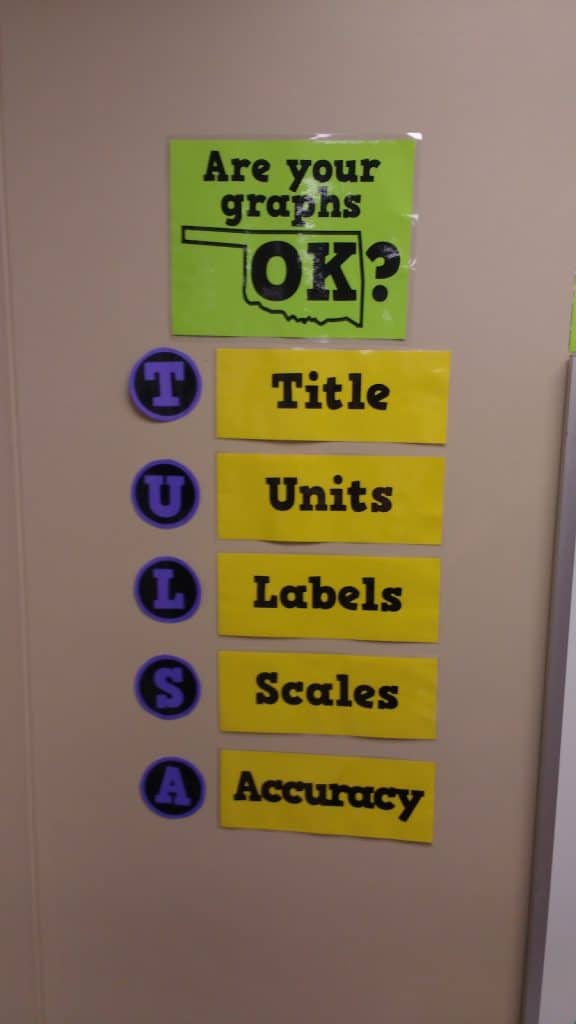
I want to share a set of TULSA Graphing Posters here on the blog today. Does your graph have a Title, Units, Labels, Scales, and Accuracy?
Normal Distribution Activities
Normal Distribution Question Stack Activity
This normal distribution question stack activity was my introduction to a new practice structure for math class: question stacks. Since then, I have gone on to create question stacks for a large number of math topics.
Scatterplot Activities
M&M’s Scatter Plot Activity
Students take turns building scatter plots using m&m’s and having their classmates determine if the scatterplot has positive, negative, or no correlation.
Candy Grab Lab for Linear Regression
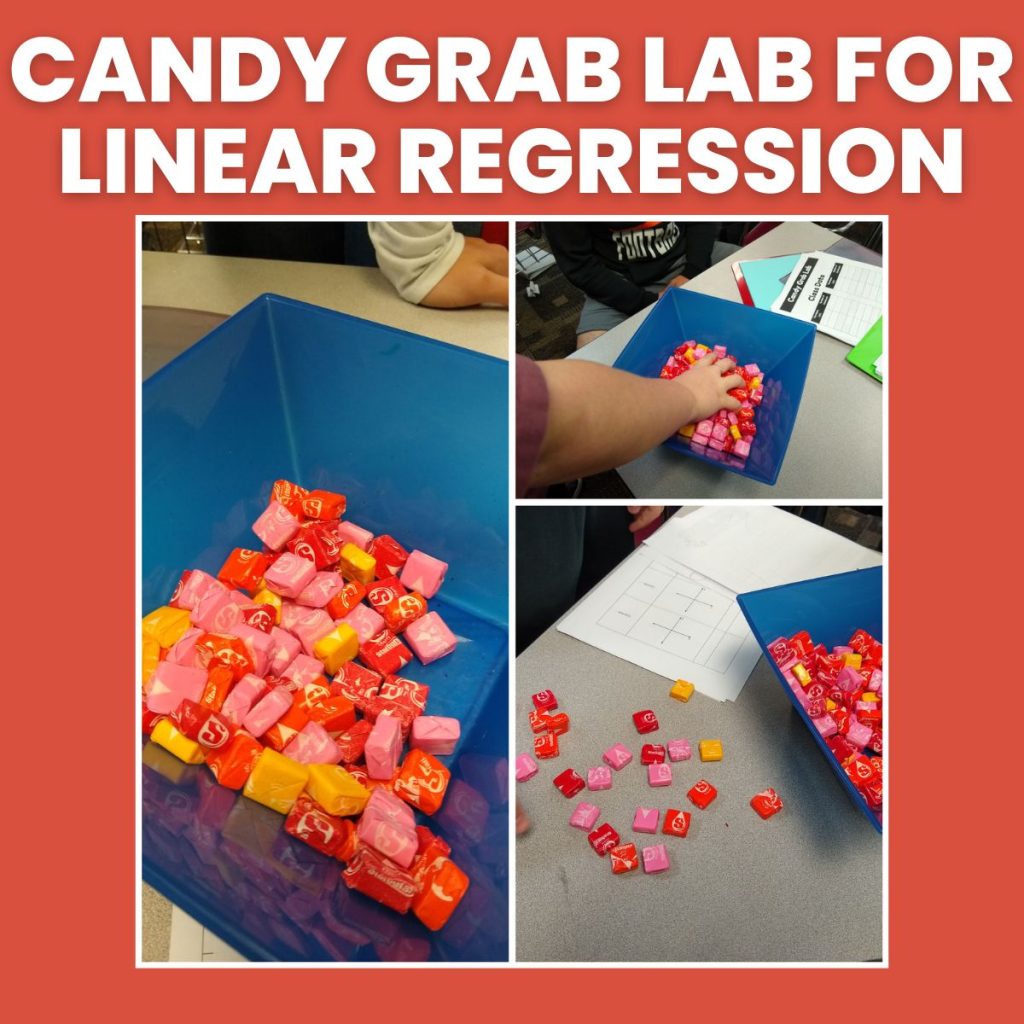
This Candy Grab Lab is one of my favorite ways to introduce students to the process of linear regression.
Twizzlers Linear Regression Lab
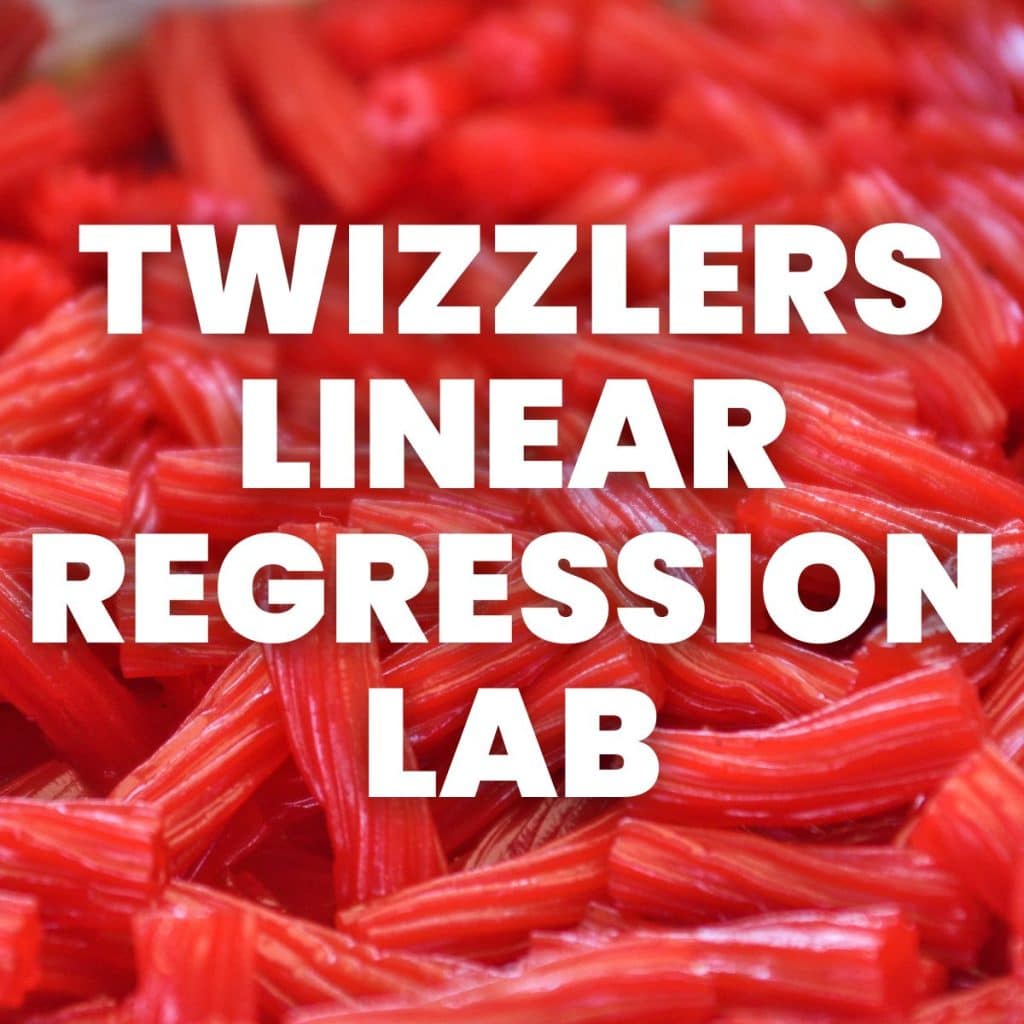
I learned about using twizzlers for linear regression from Tammy Ballard with Wake County Public Schools. I modified her activity to create my own twizzlers linear regression lab that met the needs of my specific group of algebra students.
Best Line of Best Fit Contest

This Desmos activity kept students engaged and interested while learning how to draw lines of best fit by hand.
Hula Hoop Scatterplot Activity
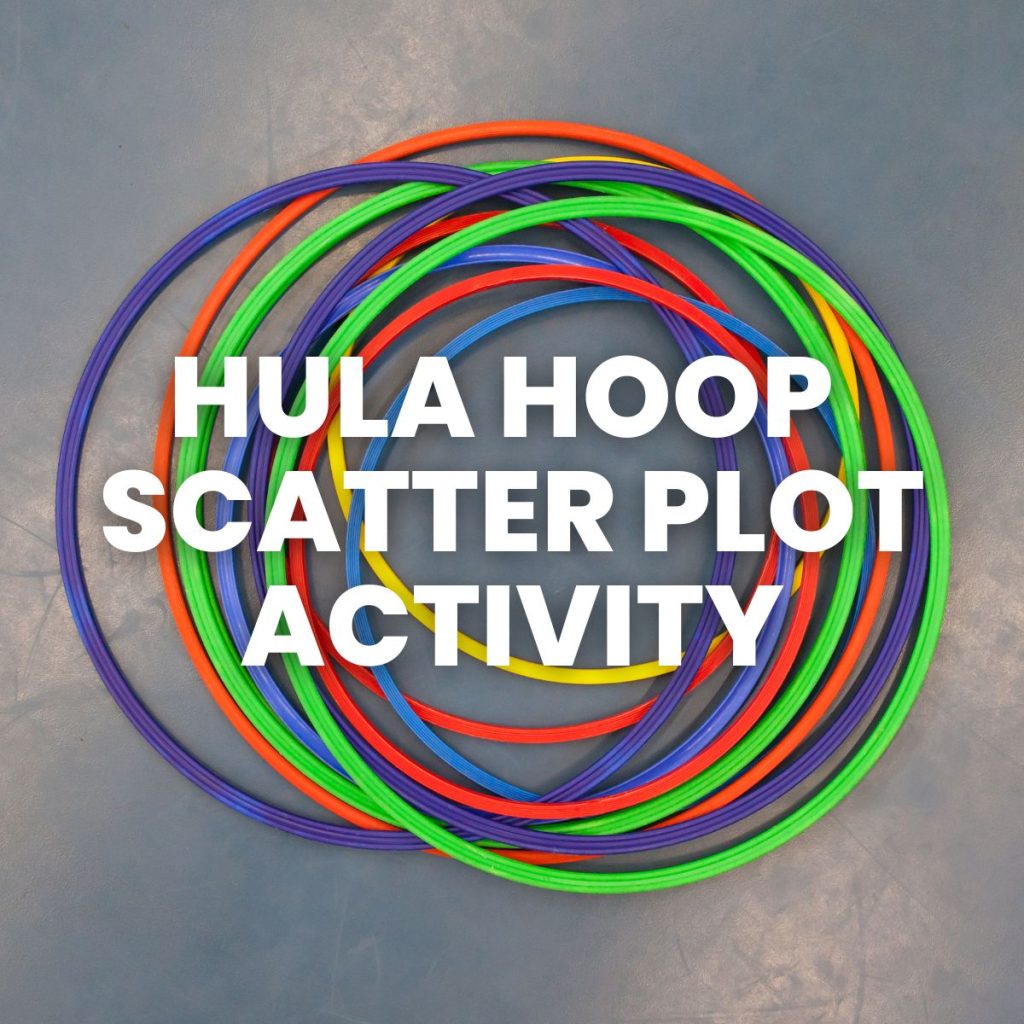
This hula hoop scatterplot activity gets students moving in math class while learning about how to create a scatterplot and use that scatterplot and linear regression to make predictions.
Starburst Scatterplot Activity
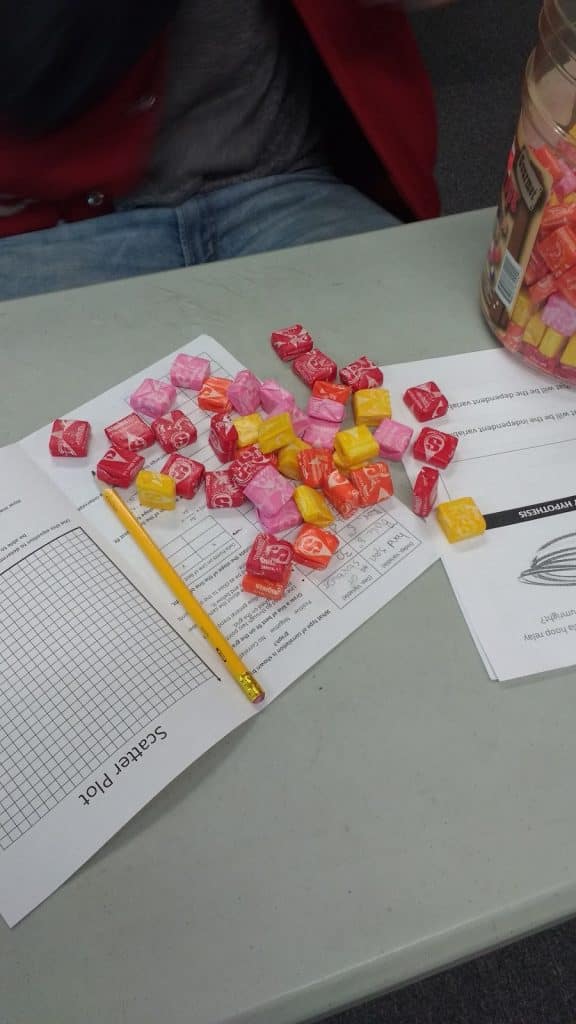
This starburst scatterplot activity ended up being one of my favorite activities of the year!
Tongue Twister Linear Regression Activity
I created this tongue twister linear regression activity for my algebra students to use while collecting tongue twister data in their small groups. Students work in groups to collect data regarding the amount of time it takes various numbers of people to recite a tongue twister.
Bouncing Tennis Balls Linear Regression Activity
Warning: don’t try this bouncing tennis balls linear regression activity if your classroom is on the 2nd floor. The science teacher below your classroom will not appreciate it.
Linear Regression Activity with the True Colors Personality Test
I was inspired to give my students the true colors personality test after attending a workshop where we did this personality test as one of our activities. We took turns going around the room saying what color we found as our result.
When comparing the amount of time it took for different numbers of students, we were able to perform a linear regression to figure out how long it would take the entire class to speak their results.
Statistics Projects
Response Bias Project
Instead of giving my statistics students a semester test, I chose to assign them a response bias project based on one shared online by Josh Tabor.
Confidence Interval Projects
I’m excited today to share the results of our confidence interval projects in statistics.
Statistics Survey Project
Before Spring Break, I gave my statistics students the assignment to design their own survey projects. We spent well over a week on this project, but I definitely think it was time well spent.
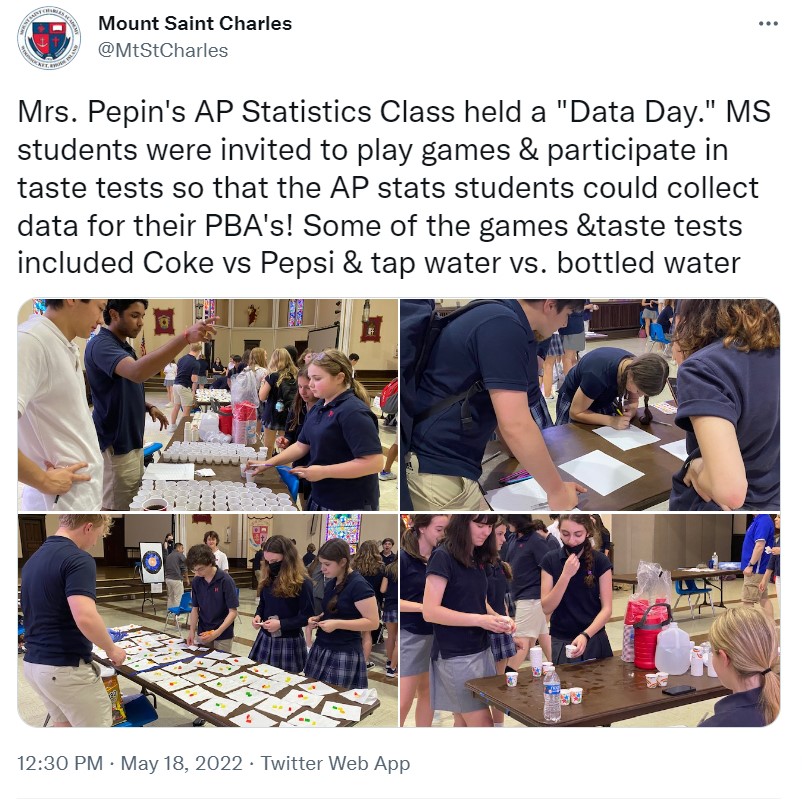
Statistics Data Day
I love this idea shared by Mount Saint Charles School of having a “Data Day” where AP Statistics students collect data from middle school students to use for their projects!
Probability Activities
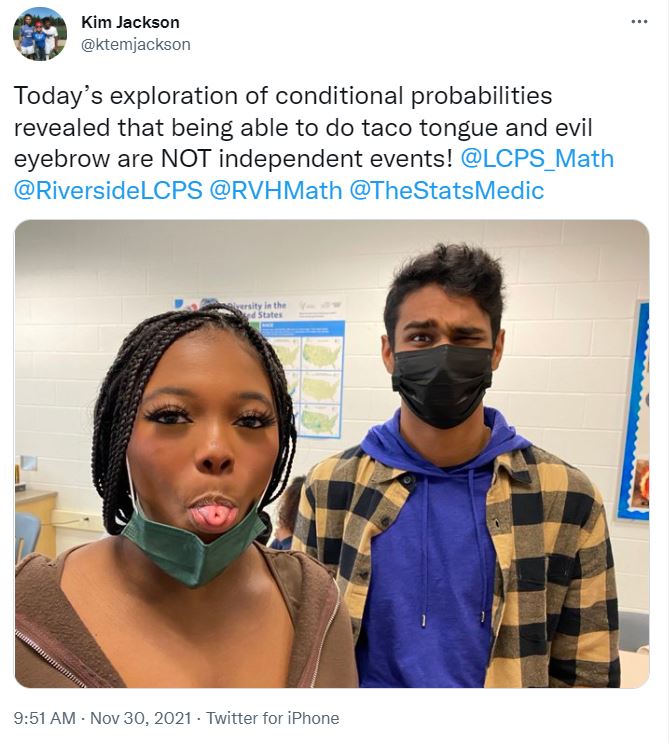
Conditional Probability Exploration Activity
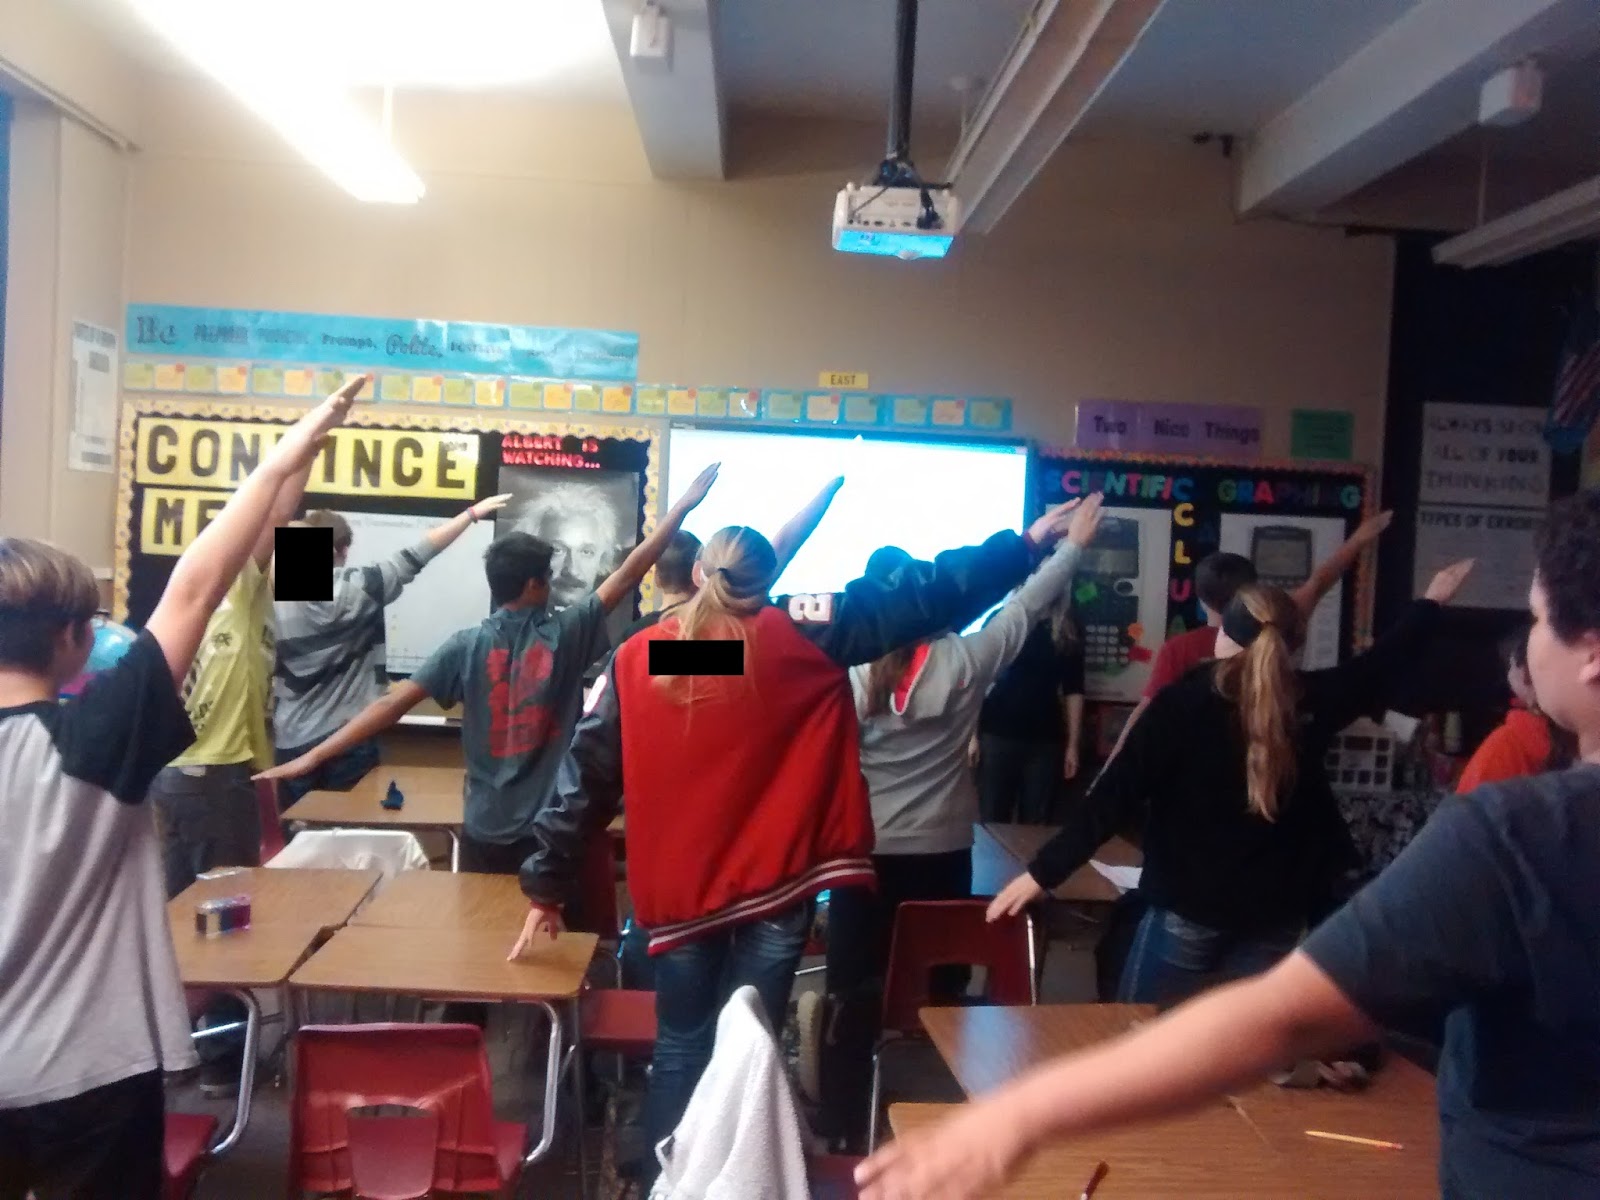
Check out this fun probability lesson from Kim Jackson involving “taco tongue” and “evil eyebrow”!
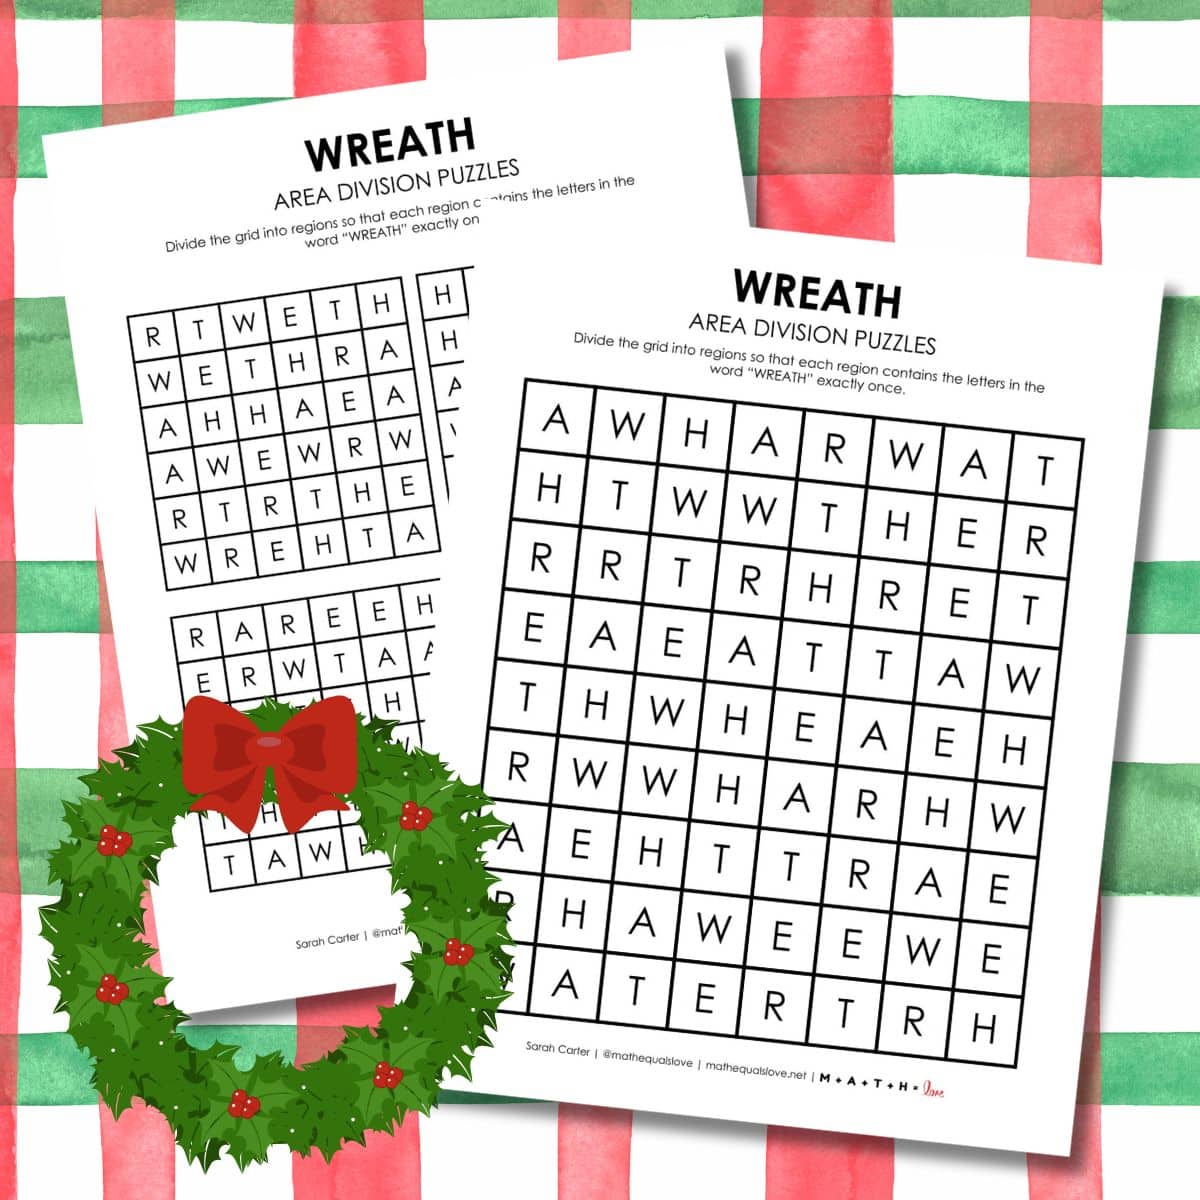
Probability Vocabulary Word Search Puzzle
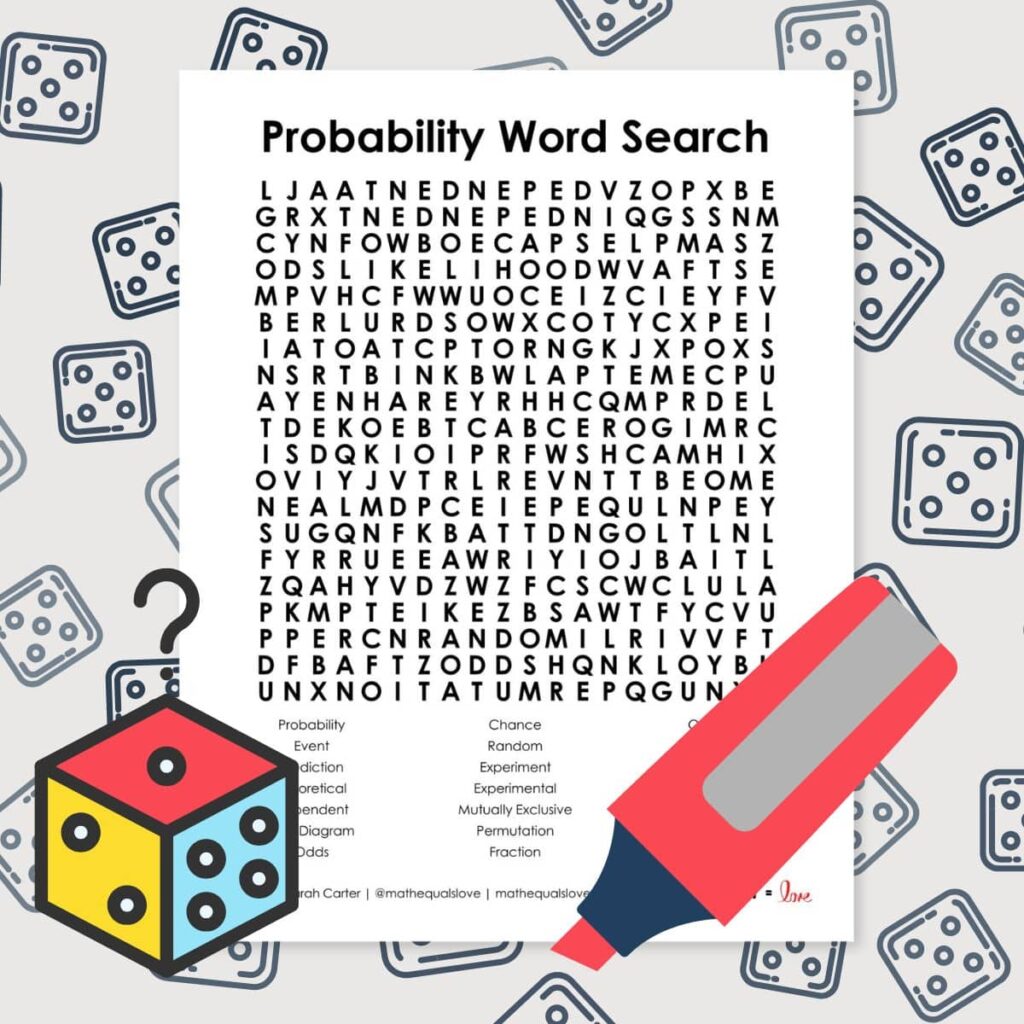
Here’s a fun probability word search to enjoy that features various probability vocabulary words for you to find in the grid. It is available as a free printable pdf file.
Hex Nut Probability Activity
All you need for this fun and engaging hex nut probability activity are hex nuts, empty soda bottles, and a plastic ring.
Mystery Box Probability Activity
Can your students use their knowledge of probability to determine the contents of the mystery box?
Blocko Probability Game
This Blocko Probability game is perfect for introducing the difference between experimental and theoretical probability to students.
I play the game with linking cubes with my students, but you could actually use any collection of small items.
Probability Bingo
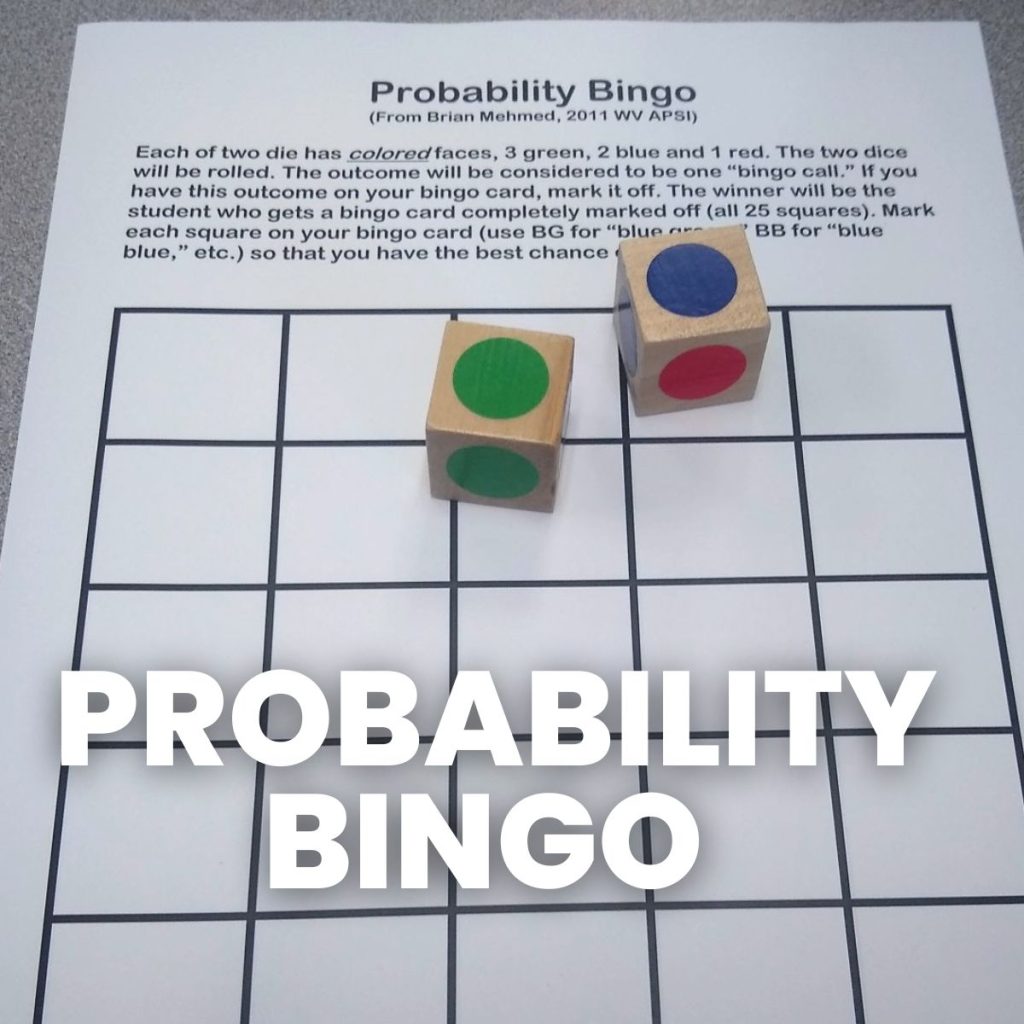
Probability Bingo is not your typical bingo game!
Students fill their bingo boards based on the color combinations they think will appear the most. The winner is the person who fills out their entire bingo board first.
Greedy Pig Dice Game
I have been playing this greedy pig dice game with my students to practice probability since I learned it while student teaching!
All you need for this game is a set of dice!
Venn Diagram Template with Guess My Rule Cards
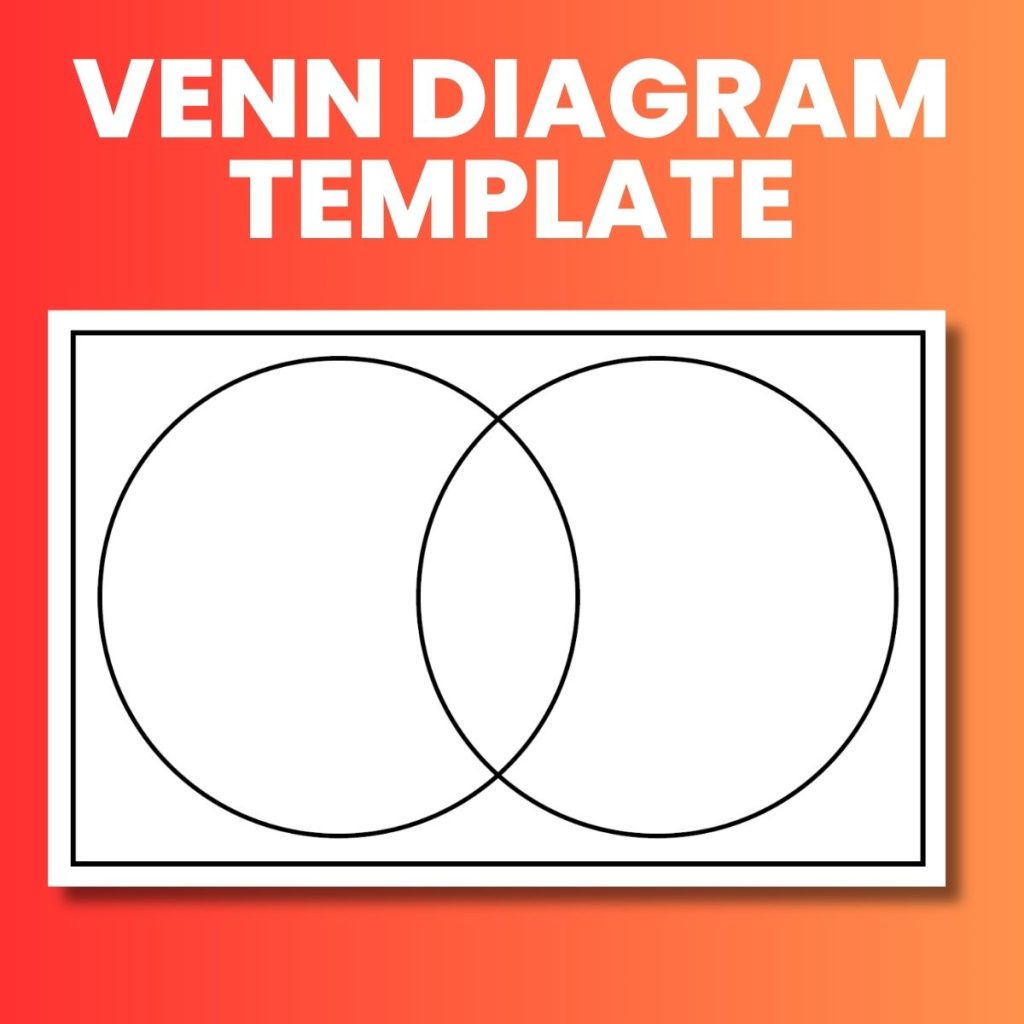
I created this Venn Diagram template to use with Guess My Rule cards, but it could be used in so many different ways in the math classroom.
Miscellaneous Statistics Activities
Statistics Word Search Puzzle
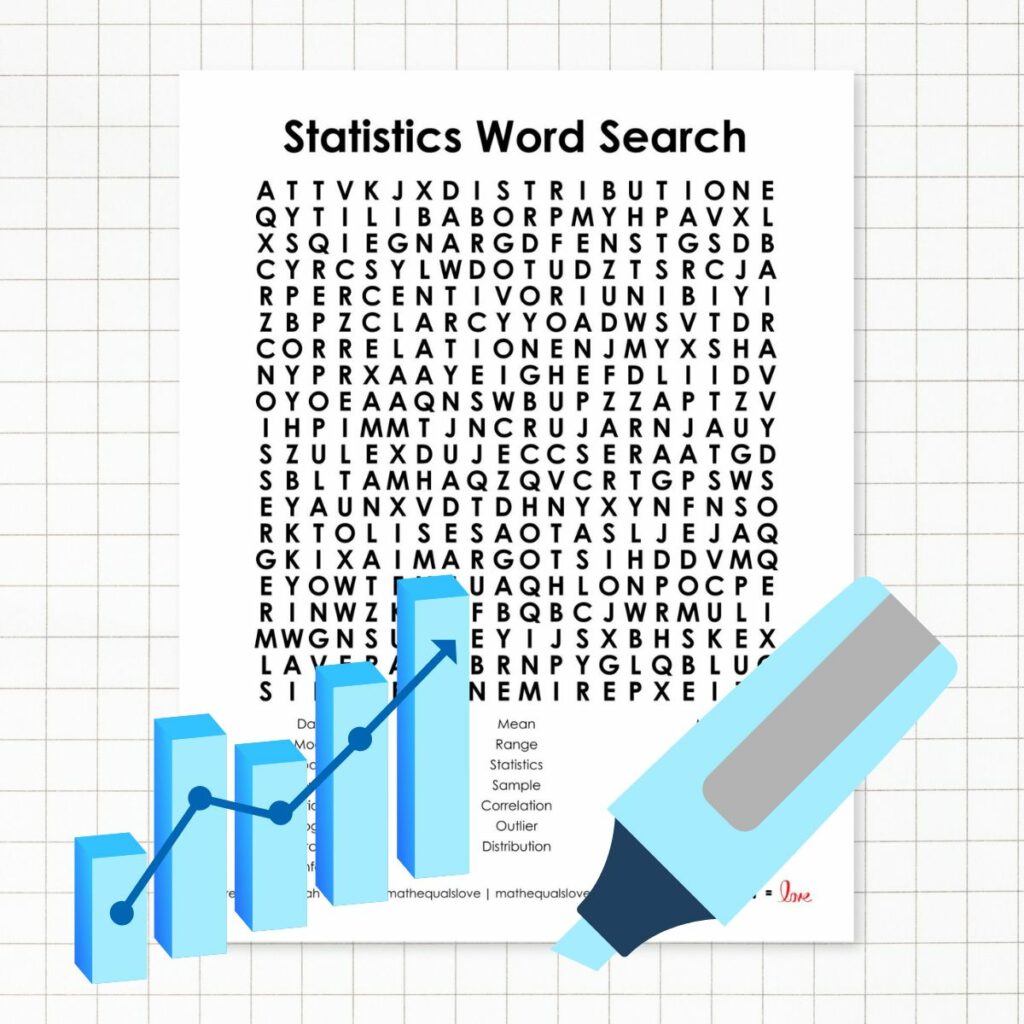
Here’s a fun statistics themed word search to enjoy that features vocabulary words related to statistics and probability. It is available as a free printable pdf.
Activity Solutions
Activity and worksheet solutions are available on a password-protected solution page. I do not openly post the answer keys because one of my goals as a resource creator is to craft learning experiences for students that are non-google-able. I want teachers to be able to use these activities and resources in their classrooms without the solutions being found easily on the Internet.
Please email me at sarah@mathequalslove.net for the password to the answer key database featuring all of my printable puzzles and math worksheets. I frequently have students emailing me for the answer key, so please specify in your email what school you teach at and what subjects you teach. If you do not provide these details, I will not be able to send you the password.